In this tutorial we will generate Loki Log links from selected dropdown template variables in a Grafana Dashboard.
Context
To give more context, we have a Grafana Dashboard with all our services, and when you select that service you see all the metrics of that service, now if you want to see the logs of that service, the selected label values will be parsed to a log link which you can click and it will take you to the Loki Explorer and parse the label values to the log link, so your logql will already be generated for you.
In order to achieve this, our metrics and logs need to share the same labels and label values (environment, container_name) etc.
Dashboard Variables
First we have our environment variable:

And here we have our service variable:
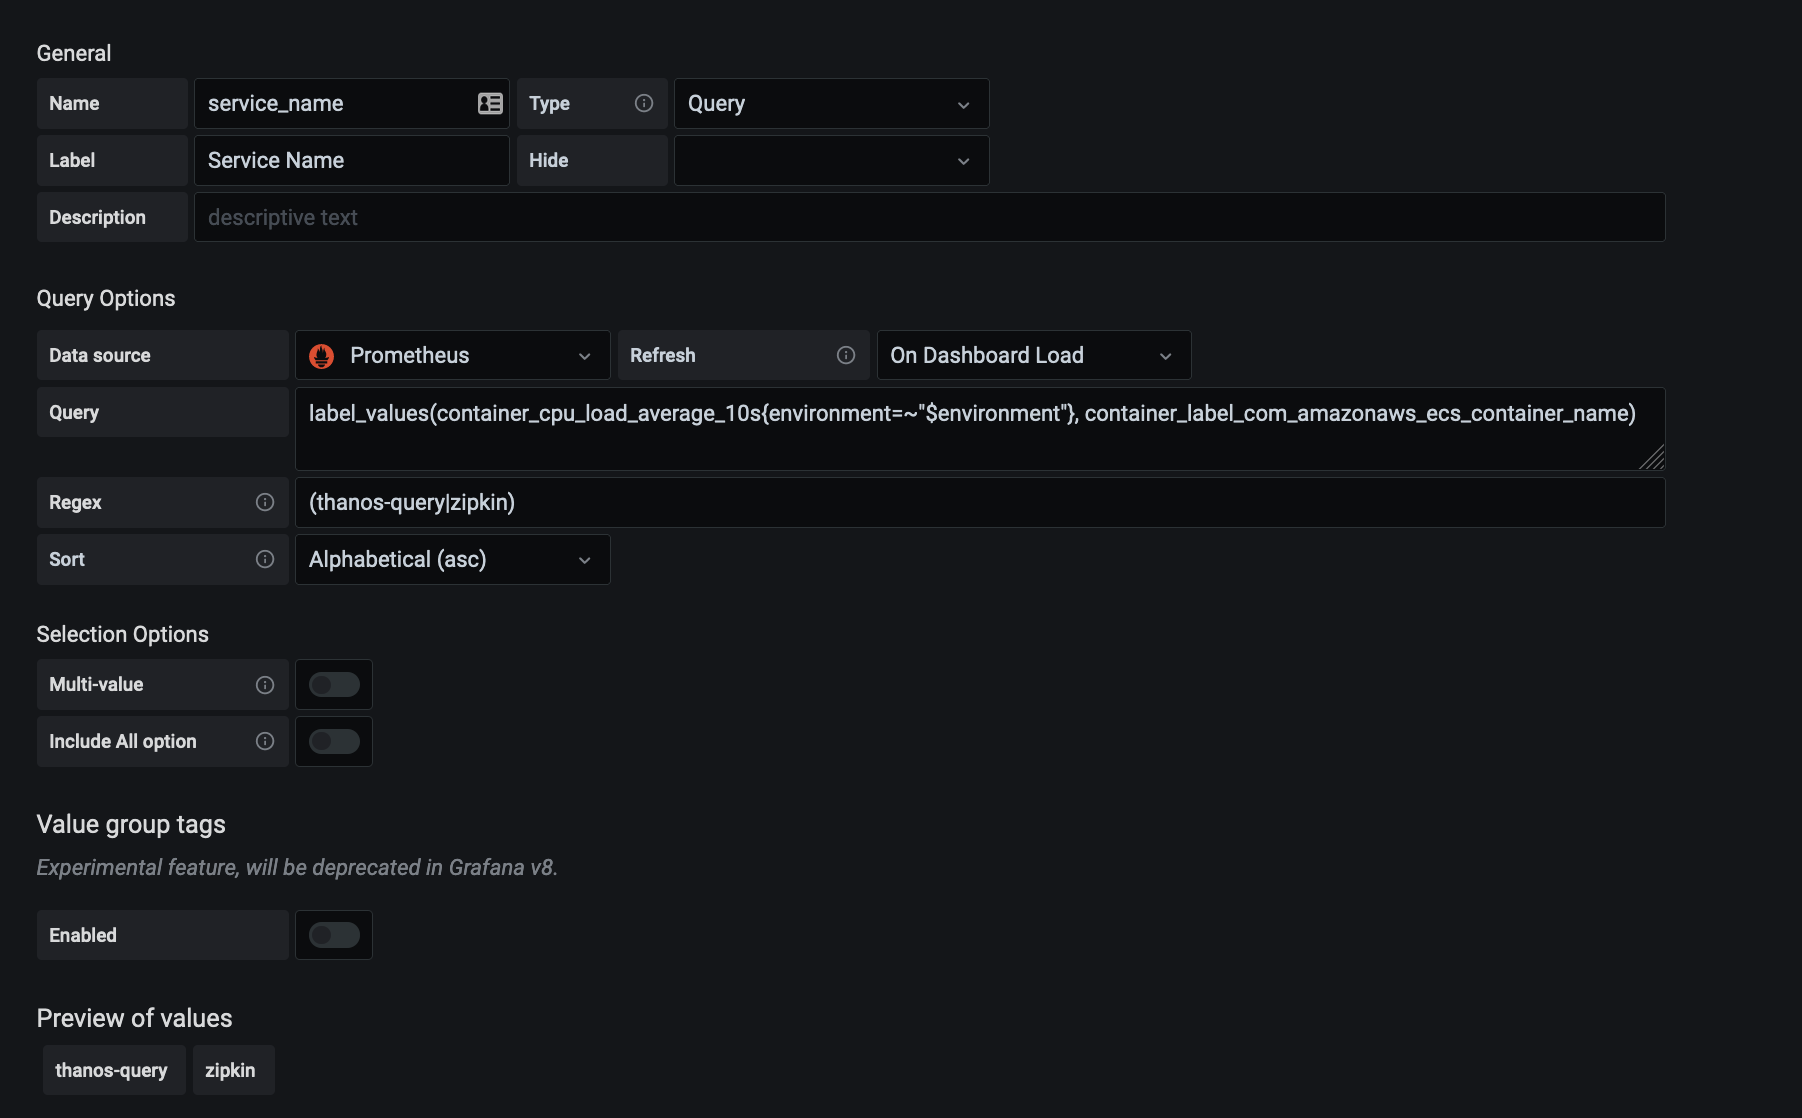
Then for our container_name we have:

Notice the /^(.*?)-[0-9]/ thats just to strip the end, if we remove it it will be:

Grafana Dashboard
Now when we select the environment, service, we get presented with a Loki LogURL:

If we look at our dashboard links, under the dashboard settings:

The Logs Uri is:
1
| |
Now when we select our label values from the dropdown for our service and we follow the link we will get:
