<![CDATA[Ruan Bekker's Blog]]>2024-03-10T01:13:45-05:00https://blog.ruanbekker.com/Octopress<![CDATA[How to Use Cert-Manager DNS Challenge With Cloudflare on Kubernetes With Helm]]>2023-12-22T08:04:02-05:00https://blog.ruanbekker.com/blog/2023/12/22/how-to-use-cert-manager-dns-challenge-with-cloudflare-on-kubernetes-with-helmIn this tutorial, we will be issuing Let’s Encrypt certificates using cert-manager on Kubernetes and we will be using the DNS Challenge with Cloudflare.
The reason I am using DNS Challenge instead of HTTP Challenge is because the Kubernetes environment is local on my laptop and there isn’t a direct HTTP route into my environment from the internet and I would like to not expose the endpoints to the public internet.
Summary of what we will be doing
We would like to have Let’s Encrypt Certificates on our web application that will be issued by Cert-Manager using the DNS Challenge from CloudFlare.
Our ingress controller will be ingress-nginx and our endpoints will be private, as they will resolve to private IP addresses, hence the reason why we are using DNS validation instead of HTTP.
Pre-Requisites
To follow along in this tutorial you will need the following
kind create cluster --name example --config kind-config.yaml
Nginx Ingress Controller
First we need to install a ingress controller and I am opting in to use ingress-nginx, so first we need to add the helm repository to our local repositories:
We need to grant Cert-Manager access to make DNS changes on our Cloudflare account for DNS validation on our behalf, and in order to do that, we need to create a Cloudflare API Token.
apiVersion:cert-manager.io/v1kind:ClusterIssuermetadata:name:letsencrypt-dns01-issuerspec:acme:server:https://acme-v02.api.letsencrypt.org/directoryemail:you@example.com# your email address for updatesprivateKeySecretRef:name:letsencrypt-dns01-private-keysolvers:-dns01:cloudflare:email:you@example.com# your cloudflare account email addressapiTokenSecretRef:name:cloudflare-api-key-secretkey:api-key
Then create the cluster issuer:
1
kubectl apply -f clusterissuer.yaml
Request a Certificate
Now that we have our ClusterIssuer created, we can request a certificate. In my scenario, I have a domain example.com which is hosted on CloudFlare and I would like to create a wildcard certificate on the sub-domain *.workshop.example.com
Certificates are scoped on a namespace level, and ClusterIssuer’s are cluster-wide, therefore I am prefixing my certificate with the namespace (just my personal preference).
Before we create the certificate on CloudFlare, I have created private DNS to the names mentioned in the manifest above like the following:
12
- workshop.example.com -> A Record -> 10.5.24.254
- *.workshop.example.com -> CNAME -> workshop.example.com
In the DNS configuration mentioned above, to explain why I am creating 2 entries:
10.2.24.254 - This is my LoadBalancer IP Address
I have a static DNS entry to the name workshop.example.com so if my LoadBalancer IP Address ever change, I can just change this address
I am creating a wildcard DNS entry for *.workshop.example.com and I am creating a CNAME record for it to resolve to workshop.example.com so it will essentially respond to the LoadBalancer IP.
So lets say I create test1.workshop.example.com and test2.workshop.example.com then it will resolve to the LoadBalancer IP in workshop.example.com and as mentioned before, if the LoadBalancer IP ever changes, I only have to update the A Record of workshop.example.com
Then after DNS was created, I went ahead and created the certificate:
1
kubectl apply -f certificate.yaml
You can view the progress by viewing the certificate status by running:
1
kubectl get certificate -n default
Specify the Certificate in your Ingress
Let’s deploy a nginx web server deployment and I have concatenated the following in one manifest called deployment.yaml:
A few important things to notice on the ingress resource:
host the host needs to match the certificate
secretName the secret needs to match the secret defined in the certificate
Then create the deployment:
1
kubectl apply -f deployment.yaml
Ensure DNS Challenges are successful
Ensure that cert-manager can set DNS-01 challenge records correctly, if you encounter issues, you can inspect the cert-manager pod logs.
To view the pods for cert-manager:
1
kubectl get pods -n cert-manager
Then view the logs using:
1
kubectl logs -f pod <pod-id> -n cert-manager
Test
You can open up a browser and access the ingress on your browser, in my case it would be https://nginx.workshop.example.com and verify that you have a certificate issued from Lets Encrypt.
]]><![CDATA[How to Deploy Ingress-Nginx Controller on Kubernetes With Helm]]>2023-12-22T07:56:22-05:00https://blog.ruanbekker.com/blog/2023/12/22/how-to-deploy-ingress-nginx-controller-on-kubernetes-with-helmIn this tutorial we will deploy the ingress-nginx controller on kubernetes.
Pre-Requisites
I will be using kind to run a kubernetes cluster locally, if you want to follow along, have a look at my previous post on how to install kubectl and kind and the basic usage of kind:
Then install the helm release, and set a couple of overrides.
The reason we use NodePort is because our kubernetes cluster runs on docker containers, and from our kind config we have exposed port 80 locally, we are using the NodePort service so that we can make an HTTP request to port 80 to traverse to the port of the service:
In summary, we are creating a deployment with a pod that listens on port 5000, and then we are creating a service with port 80 that will forward its connections to the container port of 5000.
Then we define our ingress that will match our hostname and forward its connections to our service on port 80, and also notice that we are defining our ingress class name, which we have set in our helm values.
]]><![CDATA[Creating a Python Lambda Function With Terraform on AWS]]>2023-08-03T11:29:35-04:00https://blog.ruanbekker.com/blog/2023/08/03/creating-a-python-lambda-function-with-terraform-on-awsIn this tutorial I will explain how to deploy a AWS Lambda Function with Terraform using the Python runtime. It will include the permissions it needs to write its logs to AWS CloudWatch as well as to get information from the AWS API’s as a boilerplate for you to expand on it.
We will also use CloudWatch Events to trigger this lambda function every two hours.
Pre-Requisites
First you will need to have Terraform installed as well as authentication for Terraform to interact with your AWS account, I have written a post about it and you can follow that on “How to use the AWS Terraform Provider”.
Project Structure
The following code will be available on my github repository, but if you would like to follow along we will create everything step by step.
First create the project directory:
1
mkdir -p ~/workspace/aws-lambda-terraform
Then change into the directory:
1
cd ~/workspace/aws-lambda-terraform
First we want to create our modules directory:
1
mkdir -p modules/lambda-function
Then our environment directory:
1
mkdir -p environment/test
We will also create the directory for our function code:
1
mkdir -p modules/lambda-function/functions
And we can create the file for our python function:
1
touch modules/lambda-function/functions/demo.py
Now we will create our files inside our modules directory:
And since we are using AWS, we need to define our providers and the profile that we will use to authenticate against AWS, in my case, im using the default profile in environment/test/provider.tf:
If we want to redeploy our function with updated code, we can change the content of functions/demo.py and then run:
1
terraform apply
Since our terraform code defined that if the source has of the function code changes, it will trigger a redeploy, and from the computed plan we can see that it will redeploy our function code:
1234567891011121314151617181920212223
Terraform used the selected providers to generate the following execution plan. Resource actions are indicated with the following symbols:
~ update in-place
Terraform will perform the following actions:
# module.myfunction.aws_lambda_function.lambda[0] will be updated in-place ~ resource "aws_lambda_function""lambda"{id="test-lambda-function" ~ last_modified="2023-12-21T06:26:46.000+0000" -> (known after apply) ~ source_code_hash="8TLrm4GmTrfAxwfElmIjws1Vf9UDZ6k2w1+VEONJaCQ=" -> "RIQ62KCcjlcHh5lLCOlrkB7GioBpLY1Y5vN4UZGyN+c="tags={}# (18 unchanged attributes hidden)# (3 unchanged blocks hidden)}Plan: 0 to add, 1 to change, 0 to destroy.
Do you want to perform these actions?
Terraform will perform the actions described above.
Only 'yes' will be accepted to approve.
Enter a value:
After entering “yes” we will update our function code
Discover AWS Console
If we logon to the AWS Console and head to Lambda we can inspect our function code:
If we manually want to trigger the function, select “Test”, then enter the “Event name” with something like “testing” then click “Test”:
If we follow the CloudWatch log link we can view the logs in CloudWatch:
Destroy Infrastructure
If you followed along and would like to destroy the created infrastructure:
]]><![CDATA[How to Use the MySQL Terraform Provider]]>2023-07-15T20:55:23-04:00https://blog.ruanbekker.com/blog/2023/07/15/how-to-use-the-mysql-terraform-providerIn this tutorial we will provision a MySQL Server with Docker and then use Terraform to provision MySQL Users, Database Schemas and MySQL Grants with the MySQL Terraform Provider.
About
Terraform is super powerful and can do a lot of things. And it shines when it provisions Infrastructure. So in a scenario where we use Terraform to provision RDS MySQL Database Instances, we might still want to provision extra MySQL Users, or Database Schemas and the respective MySQL Grants.
Usually you will logon to the database and create them manually with sql syntax. But in this tutorial we want to make use of Docker to provision our MySQL Server and we would like to make use of Terraform to provision the MySQL Database Schemas, Grants and Users.
Instead of using AWS RDS, I will be provisioning a MySQL Server on Docker so that we can keep the costs free, for those who are following along.
We will also go through the steps on how to rotate the database password that we will be provisioning for our user.
MySQL Server
First we will provision a MySQL Server on Docker Containers, I have a docker-compose.yaml which is available in my quick-starts github repository:
If you don’t have Terraform installed, you can install it from their documentation.
If you want the source code of this example, its available in my terraform-mysql/petoju-provider repository. Which you can clone and jump into the terraform/mysql/petoju-provider directory.
variable "database_name"{description="The name of the database that you want created."type= string
default= null
}variable "database_username"{description="The name of the database username that you want created."type= string
default= null
}variable "password_version"{description="The password rotates when this value gets updated."type= number
default= 0
}
Now we are ready to run our terraform code, which will ultimately create a database, user and grants. Outputs the encrypted string of your password which was encrypted with your keybase_username.
Initialise Terraform:
1
terraform init
Run the plan to see what terraform wants to provision:
1
terraform plan
And we can see the following resources will be created:
Terraform used the selected providers to generate the following execution plan. Resource actions are indicated with the following symbols:
+ create
Terraform will perform the following actions:
# mysql_database.user_db will be created + resource "mysql_database""user_db"{ + default_character_set="utf8mb4" + default_collation="utf8mb4_general_ci" + id=(known after apply) + name="foobar"}# mysql_grant.user_id will be created + resource "mysql_grant""user_id"{ + database="foobar" + grant=false + host="%" + id=(known after apply) + privileges=[ + "SELECT",
+ "UPDATE",
] + table="*" + tls_option="NONE" + user="ruanb"}# mysql_user.user_id will be created + resource "mysql_user""user_id"{ + host="%" + id=(known after apply) + plaintext_password=(sensitive value) + tls_option="NONE" + user="ruanb"}# random_password.user_password will be created + resource "random_password""user_password"{ + bcrypt_hash=(sensitive value) + id=(known after apply) + keepers={ + "password_version"="0"} + length= 24
+ lower=true + min_lower= 0
+ min_numeric= 0
+ min_special= 2
+ min_upper= 0
+ number=true + numeric=true + override_special="!#$%^&*()-_=+[]{}<>:?" + result=(sensitive value) + special=true + upper=true}Plan: 4 to add, 0 to change, 0 to destroy.
Changes to Outputs:
+ password=(sensitive value) + user="ruanb"
Run the apply which will create the database, the user, sets the password and applies the grants:
1
terraform apply
Then our returned output should show something like this:
If we want to rotate the mysql password for the user, we can update the password_version variable either in our terraform.tfvars or via the cli. Let’s pass the variable in the cli and do a terraform plan to verify the changes:
1
terraform plan -var password_version=1
And due to our value for the random resource keepers parameter being updated, it will trigger the value of our password to be changed, and that will let terraform update our mysql user’s password:
12345678910111213141516171819202122232425
Terraform used the selected providers to generate the following execution plan. Resource actions are indicated with the following symbols:
~ update in-place
-/+ destroy and then create replacement
Terraform will perform the following actions:
# mysql_user.user_id will be updated in-place ~ resource "mysql_user""user_id"{id="ruanb@%" ~ plaintext_password=(sensitive value)# (5 unchanged attributes hidden)}# random_password.user_password must be replaced-/+ resource "random_password""user_password"{ ~ bcrypt_hash=(sensitive value) ~ id="none" -> (known after apply) ~ keepers={# forces replacement ~ "password_version"="0" -> "1"} ~ result=(sensitive value)# (11 unchanged attributes hidden)}Plan: 1 to add, 1 to change, 1 to destroy.
To validate that the password has changed, we can try to logon to mysql by using the password variable that was created initially:
1
docker exec -it mysql mysql -u ruanb -p$DBPASS
And as you can see authentication failed:
12
mysql: [Warning] Using a password on the command line interface can be insecure.
ERROR 1045(28000): Access denied for user 'ruanb'@'localhost'(using password: YES)
Set the new password to the variable again:
1
DBPASS=$(terraform output -raw password)
Then try to logon again:
1
docker exec -it mysql mysql -u ruanb -p$DBPASS
And we can see we are logged on again:
12345
Welcome to the MySQL monitor.  Commands end with ; or \g.
Your MySQL connection id is 22
Server version: 8.0.33 MySQL Community Server - GPL

mysql>
]]><![CDATA[How to Use the AWS Terraform Provider]]>2023-07-15T20:01:13-04:00https://blog.ruanbekker.com/blog/2023/07/15/how-to-use-the-aws-terraform-providerIn this post we will be using the AWS Terraform provider, from how to install Terraform, create a AWS IAM User, configure the AWS Provider and deploy a EC2 instance using Terraform.
AWS IAM User
In order to authenticate against AWS’s APIs, we need to create a AWS IAM User and create Access Keys for Terraform to use to authenticate.
Select IAM, then select “Users” on the left hand side and select “Create User”, then provide the username for your AWS IAM User:
Now we need to assign permissions to our new AWS IAM User. For this scenario I will be assigning a IAM Policy directly to the user and I will be selecting the “AdministratorAccess” policy. Keep in mind that this allows admin access to your whole AWS account:
Once you select the policy, select “Next” and select “Create User”. Once the user has been created, select “Users” on the left hand side, search for your user that we created, in my case “medium-terraform”.
Select the user and click on “Security credentials”. If you scroll down to the “Access keys” section, you will notice we don’t have any access keys for this user:
In order to allow Terraform access to our AWS Account, we need to create access keys that Terraform will use, and because we assigned full admin access to the user, Terraform will be able to manage resources in our AWS Account.
Click “Create access key”, then select the “CLI” option and select the confirmation at the bottom:
Select “Next” and then select “Create access key”. I am providing a screenshot of the Access Key and Secret Access Key that has been provided, but by the time this post has been published, the key will be deleted.
Store your Access Key and Secret Access Key in a secure place and treat this like your passwords. If someone gets access to these keys they can manage your whole AWS Account.
I will be using the AWS CLI to configure my Access Key and Secret Access Key, as I will configure Terraform later to read my Access Keys from the Credential Provider config.
First we need to configure the AWS CLI by passing the profile name, which I have chosen medium for this demonstration:
1
aws --profile medium configure
We will be asked to provide the access key, secret access key, aws region and the default output:
1234
AWS Access Key ID [None]: AKIATPRT2G4SGXLAC3HJ
AWS Secret Access Key [None]: KODnR[............]nYTYbd
Default region name [None]: eu-west-1
Default output format [None]: json
To verify if everything works as expected we can use the following command to verify:
1
aws --profile medium sts get-caller-identity
The response should look something similar to the following:
Now that we have our AWS IAM User configured, we can install Terraform, if you don’t have Terraform installed yet, you can follow their Installation Documentation.
Once you have Terraform installed, we can setup our workspace where we will ultimately deploy a EC2 instance, but before we get there we need to create our project directory and change to that directory:
We will define our Terraform definitions on how we want our desired infrastructure to look like. We will get to the content in the files soon.
I personally love Terraform’s documentation as they are rich in examples and really easy to use.
Head over to the Terraform AWS Provider documentation and you scroll a bit down, you can see the Authentication and Configuration section where they outline the order in how Terraform will look for credentials and we will be making use of the shared credentials file as that is where our access key and secret access key is stored.
If you look at the top right corner of the Terraform AWS Provider documentation, they show you how to use the AWS Provider:
We can copy that code snippet and paste it into our providers.tf file and configure the aws provider section with the medium profile that we’ve created earlier.
This will tell Terraform where to look for credentials in order to authenticate with AWS.
In the above example we are filtering for the latest Ubuntu 22.04 64bit AMI then we are defining a EC2 instance and specifying the AMI ID that we filtered from our data source.
Note that we haven’t specified a SSH Keypair, as we are just focusing on how to provision a EC2 instance.
As you can see we are also referencing variables, which we need to define in variables.tf :
1234567891011
variable "instance_name"{description="Instance Name for EC2."type= string
default="test"}variable "instance_type"{description="Instance Type for EC2."type= string
default="t2.micro"}
And then lastly we need to define our outputs.tf which will be used to output the instance id and ip address:
Now that our infrastructure has been defined as code, we can first initialise terraform which will initialise the backend and download all the providers that has been defined:
1
terraform init
Once that has done we can run a “plan” which will show us what Terraform will deploy:
1
terraform plan
Now terraform will show us the difference in what we have defined, and what is actually in AWS, as we know its a new account with zero infrastructure, the diff should show us that it needs to create a EC2 instance.
The response from the terraform plan shows us the following:
Terraform used the selected providers to generate the following execution plan. Resource actions are indicated with the following symbols:
+ create
Terraform will perform the following actions:
# aws_instance.ec2 will be created + resource "aws_instance""ec2"{ + ami="ami-0f56955469757e5aa" + arn=(known after apply) + id=(known after apply) + instance_type="t2.micro" + key_name=(known after apply) + private_ip=(known after apply) + public_ip=(known after apply) + security_groups=(known after apply) + subnet_id=(known after apply) + tags={ + "Name"="test-ec2-instance"} + tags_all={ + "Name"="test-ec2-instance"} + vpc_security_group_ids=(known after apply)}Plan: 1 to add, 0 to change, 0 to destroy.
Changes to Outputs:
+ instance_id=(known after apply) + ip=(known after apply)
As you can see terraform has looked up the AMI ID using the data source, and we can see that terraform will provision 1 resource which is a EC2 instance. Once we hare happy with the plan, we can run a apply which will show us the same but this time prompt us if we want to proceed:
123456789101112131415161718
Do you want to perform these actions?
Terraform will perform the actions described above.
Only 'yes' will be accepted to approve.
Enter a value: yes
aws_instance.ec2: Creating...
aws_instance.ec2: Still creating... [10s elapsed]aws_instance.ec2: Still creating... [20s elapsed]aws_instance.ec2: Still creating... [30s elapsed]aws_instance.ec2: Creation complete after 35s [id=i-005c08b899229fff0]Apply complete! Resources: 1 added, 0 changed, 0 destroyed.
Outputs:
instance_id="i-005c08b899229fff0"ip="34.253.196.167"
And now we can see our EC2 instance was provisioned and our outputs returned the instance id as well as the public ip address.
We can also confirm this by looking at the AWS EC2 Console:
Note that Terraform Configuration is idempotent, so when we run a terraform apply again, terraform will check what we have defined as what we want our desired infrastructure to be like, and what we actually have in our AWS Account, and since we haven’t made any changes there should be no changes.
It will show us what terraform will destroy, then upon confirming we should see the following output:
12345678910111213141516171819
Plan: 0 to add, 0 to change, 1 to destroy.
Changes to Outputs:
- instance_id="i-005c08b899229fff0" -> null
- ip="34.253.196.167" -> null
Do you really want to destroy all resources?
Terraform will destroy all your managed infrastructure, as shown above.
There is no undo. Only 'yes' will be accepted to confirm.
Enter a value: yes
aws_instance.ec2: Destroying... [id=i-005c08b899229fff0]aws_instance.ec2: Still destroying... [id=i-005c08b899229fff0, 10s elapsed]aws_instance.ec2: Still destroying... [id=i-005c08b899229fff0, 20s elapsed]aws_instance.ec2: Still destroying... [id=i-005c08b899229fff0, 30s elapsed]aws_instance.ec2: Destruction complete after 31s
Destroy complete! Resources: 1 destroyed.
If you followed along and you also want to clean up the AWS IAM user, head over to the AWS IAM Console and delete the “medium-terraform” IAM User.
Thank You
I hope you enjoyed this post, I will be posting more terraform related content.
Should you want to reach out to me, you can follow me on Twitter at @ruanbekker or check out my website at https://ruan.dev
]]><![CDATA[Getting Started With FerretDB on Docker]]>2023-06-14T22:00:00-04:00https://blog.ruanbekker.com/blog/2023/06/14/getting-started-with-ferretdb-on-docker
In this post we will have a look at FerretDB which is a opensource proxy that translates MongoDB queries to SQL, where PostgreSQL being the database engine.
Initially built as open-source software, MongoDB was a game-changer for many developers, enabling them to build fast and robust applications. Its ease of use and extensive documentation made it a top choice for many developers looking for an open-source database. However, all this changed when they switched to an SSPL license, moving away from their open-source roots.
In light of this, FerretDB was founded to become the true open-source alternative to MongoDB, making it the go-to choice for most MongoDB users looking for an open-source alternative to MongoDB. With FerretDB, users can run the same MongoDB protocol queries without needing to learn a new language or command.
What can you expect from this tutorial
We will be doing the following:
deploying ferretdb and postgres on docker containers using docker compose
then use mongosh as a client to logon to ferretdb using the ferretdb endpoint
explore some example queries to insert and read data from ferretdb
use scripting to generate data into ferretedb
explore the embedded prometheus endpoint for metrics
Deploy FerretDB
The following docker-compose.yaml defines a postgres container which will be used as the database engine for ferretdb, and then we define the ferretdb container, which connects to postgres via the environment variable FERRETDB_POSTGRESQL_URL.
Once you have the content above saved in docker-compose.yaml you can run the following to run the containers in a detached mode:
1
docker-compose up -d
Connect to FerretDB
Once the containers started, we can connect to our ferretdb server using mongosh, which is a shell utility to connect to the database). I will make use of a container to do this, where I will reference the network which we defined in our docker compose file, and set the endpoint that mongosh need to connect to:
1
docker run --rm -it --network=ferretdb --entrypoint=mongosh mongo:6.0 "mongodb://ferret:password@ferretdb/ferretdb?authMechanism=PLAIN"
Once it successfully connects to ferretdb, we should see the following prompt:
123456
Current Mongosh Log ID:  64626c5c259916d1a68b7dad
Connecting to:        mongodb://<credentials>@ferretdb/ferretdb?authMechanism=PLAIN&directConnection=true&appName=mongosh+1.8.2
Using MongoDB:        6.0.42
Using Mongosh:        1.8.2

ferretdb>
Run example queries on FerretDB
If you are familiar with MongoDB, you will find the following identical to MongoDB.
First we show the current databases:
12
ferretdb> show dbs;public 0 B
The we create and use the database named mydb:
12
ferretdb> use mydb
switched to db mydb
To see which database are we currently connected to:
12
mydb> db
mydb
Now we can create a collection named mycol1 and mycol2:
We will create a script so that we can generate data that we want to write into FerretDB.
Create the following script, write.js:
1234567891011121314151617181920
var txs=[]for(var x= 0; x < 1000; x++){ var transaction_types=["credit card", "cash", "account"]; var store_names=["edgards", "cna", "makro", "picknpay", "checkers"]; var random_transaction_type= Math.floor(Math.random() * (2 - 0 + 1)) + 0; var random_store_name= Math.floor(Math.random() * (4 - 0 + 1)) + 0; var random_age= Math.floor(Math.random() * (80 - 18) + 18) txs.push({ transaction: 'tx_' + x,
transaction_price: Math.round(Math.random()*1000),
transaction_type: transaction_types[random_transaction_type],
store_name: store_names[random_store_name],
age: random_age
});}console.log("drop and recreate the collection")db.mycollection1.drop()db.createCollection("mycollection1")console.log("insert documents into collection")db.mycollection1.insertMany(txs)
The script will loop a 1000 times and create documents that will include fields of transaction_types, store_names, random_transaction_type, random_store_name and random_age.
Use docker, mount the file inside the container, point the database endpoint to ferretdb and load the file that we want to execute:
]]><![CDATA[How to Run a AMD64 Bit Linux VM on a Mac M1]]>2023-05-26T08:35:38-04:00https://blog.ruanbekker.com/blog/2023/05/26/how-to-run-a-amd64-bit-linux-vm-on-a-mac-m1This tutorial will show you how you can run 64bit Ubuntu Linux Virtual Machines on a Apple Mac M1 arm64 architecture macbook using UTM.
Installation
Head over to their documentation and download the UTM.dmg file and install it, once it is installed and you have opened UTM, you should see this screen:
Creating a Virtual Machine
In my case I would like to run a Ubuntu VM, so head over to the Ubuntu Server Download page and download the version of choice, I will be downloading Ubuntu Server 22.04, once you have your ISO image downloaded, you can head over to the next step which is to “Create a New Virtual Machine”:
I will select “Emulate” as I want to run a amd64 bit architecture, then select “Linux”:
In the next step we want to select the Ubuntu ISO image that we downloaded, which we want to use to boot our VM from:
Browse and select the image that you downloaded, once you selected it, it should show something like this:
Select continue, then select the architecture to x86_64, the system I kept on defaults and the memory I have set to 2048MB and cores to 2 but that is just my preference:
The next screen is to configure storage, as this is for testing I am setting mine to 8GB:
The next screen is shared directories, this is purely optional, I have created a directory for this:
1
mkdir ~/utm
Which I’ve then defined for a shared directory, but this depends if you need to have shared directories from your local workstation.
The next screen is a summary of your choices and you can name your vm here:
Once you are happy select save, and you should see something like this:
You can then select the play button to start your VM.
The console should appear and you can select install or try this vm:
This will start the installation process of a Linux Server:
Here you can select the options that you would like, I would just recommend to ensure that you select Install OpenSSH Server so that you can connect to your VM via SSH.
Once you get to this screen:
The installation process is busy and you will have to wait a couple of minutes for it to complete. Once you see the following screen the installation is complete:
On the right hand side select the circle, then select CD/DVD and select the ubuntu iso and select eject:
Starting your VM
Then power off the guest and power on again, then you should get a console login, then you can proceed to login, and view the ip address:
SSH to your VM
Now from your terminal you should be able to ssh to the VM:
We can also verify that we are running a 64bit vm, by running uname --processor:
Thank You
Thanks for reading, feel free to check out my website, feel free to subscribe to my newsletter or follow me at @ruanbekker on Twitter.
]]><![CDATA[Running a Multi-Broker Kafka Cluster on Docker]]>2023-05-17T10:50:57-04:00https://blog.ruanbekker.com/blog/2023/05/17/running-a-multi-broker-kafka-cluster-on-dockerIn this post we will run a Kakfa cluster with 3 kafka brokers on docker compose and using a producer to send messages to our topics and a consumer that will receive the messages from the topics, which we will develop in python and explore the kafka-ui.
What is Kafka?
Kafka is a distributed event store and stream processing platform. Kafka is used to build real-time streaming data pipelines and real-time streaming applications.
But on a high level, the components of a typical Kafka setup:
Zookeeper: Kafka relies on Zookeeper to do leadership election of Kafka Brokers and Topic Partitions.
Broker: Kafka server that receives messages from producers, assigns them to offsets and commit the messages to disk storage. A offset is used for data consistency in a event of failure, so that consumers know from where to consume from their last message.
Topic: A topic can be thought of categories to organize messages. Producers writes messages to topics, consumers reads from those topics.
Partitions: A topic is split into multiple partitions. This improves scalability through parallelism (not just one broker). Kafka also does replication
For great in detail information about kafka and its components, I encourage you to visit the mentioned post from above.
Launch Kafka
This is the docker-compose.yaml that we will be using to run a kafka cluster with 3 broker containers, 1 zookeeper container, 1 producer, 1 consumer and a kafka-ui.
You can verify that the brokers are passing their health checks with:
12345678910
docker-compose ps

NAME                IMAGE                                           COMMAND                  SERVICE             CREATED             STATUS                   PORTS
broker-1            confluentinc/cp-kafka:7.4.0                     "/etc/confluent/dock…"   broker-1            5 minutes ago       Up 4 minutes (healthy)   0.0.0.0:9091->9091/tcp, :::9091->9091/tcp, 9092/tcp
broker-2            confluentinc/cp-kafka:7.4.0                     "/etc/confluent/dock…"   broker-2            5 minutes ago       Up 4 minutes (healthy)   0.0.0.0:9092->9092/tcp, :::9092->9092/tcp
broker-3            confluentinc/cp-kafka:7.4.0                     "/etc/confluent/dock…"   broker-3            5 minutes ago       Up 4 minutes (healthy)   9092/tcp, 0.0.0.0:9093->9093/tcp, :::9093->9093/tcp
consumer            ruanbekker/kafka-producer-consumer:2023-05-17   "sh /src/run.sh $ACT…"   consumer            5 minutes ago       Up 4 minutes
kafka-ui            provectuslabs/kafka-ui:latest                   "/bin/sh -c 'java --…"   kafka-ui            5 minutes ago       Up 4 minutes             0.0.0.0:8080->8080/tcp, :::8080->8080/tcp
producer            ruanbekker/kafka-producer-consumer:2023-05-17   "sh /src/run.sh $ACT…"   producer            5 minutes ago       Up 4 minutes
zookeeper           confluentinc/cp-zookeeper:7.4.0                 "/etc/confluent/dock…"   zookeeper           5 minutes ago       Up 5 minutes (healthy)   0.0.0.0:2888->2888/tcp, :::2888->2888/tcp, 0.0.0.0:3888->3888/tcp, :::3888->3888/tcp, 2181/tcp, 0.0.0.0:32181->32181/tcp, :::32181->32181/tcp
Producers and Consumers
The producer generates random data and sends it to a topic, where the consumer will listen on the same topic and read messages from that topic.
To view the output of what the producer is doing, you can tail the logs:
12345678
docker logs -f producer

setting up producer, checking if brokers are available
brokers not available yet
brokers are available and ready to produce messages
message sent to kafka with squence id of 1
message sent to kafka with squence id of 2
message sent to kafka with squence id of 3
And to view the output of what the consumer is doing, you can tail the logs:
1234567
docker logs -f consumer
starting consumer, checks if brokers are availabe
brokers not availbe yet
brokers are available and ready to consume messages
{'sequence_id': 10, 'user_id': '20520', 'transaction_id': '4026fd10-2aca-4d2e-8bd2-8ef0201af2dd', 'product_id': '17974', 'address': '71741 Lopez Throughway | South John | BT', 'signup_at': '2023-05-11 06:54:52', 'platform_id': 'Tablet', 'message': 'transaction made by userid 119740995334901'}{'sequence_id': 11, 'user_id': '78172', 'transaction_id': '4089cee1-0a58-4d9b-9489-97b6bc4b768f', 'product_id': '21477', 'address': '735 Jasmine Village Apt. 009 | South Deniseland | BN', 'signup_at': '2023-05-17 09:54:10', 'platform_id': 'Tablet', 'message': 'transaction made by userid 159204336307945'}
]]><![CDATA[Manage Helm Releases With Terraform]]>2023-03-09T16:15:47-05:00https://blog.ruanbekker.com/blog/2023/03/09/manage-helm-releases-with-terraform
In this post we will use terraform to deploy a helm release to kubernetes.
Kubernetes
For this demonstration I will be using kind to deploy a local Kubernetes cluster to the operating system that I am running this on, which will be Ubuntu Linux. For a more in-depth tutorial on Kind, you can see my post on Kind for Local Kubernetes Clusters.
Installing the Pre-Requirements
We will be installing terraform, docker, kind and kubectl on Linux.
Now we can test if kubectl can communicate with the kubernetes api server:
1
kubectl get nodes
In my case it returns:
12
NAME                 STATUS   ROLES           AGE     VERSION
rbkr-control-plane   Ready    control-plane   6m20s   v1.24.0
Terraform
Now that our pre-requirements are sorted we can configure terraform to communicate with kubernetes. For that to happen, we need to consult the terraform kubernetes provider’s documentation.
As per their documentation they provide us with this snippet:
And from their main page, it gives us a couple of options to configure the provider and the easiest is probably to read the ~/.kube/config configuration file.
But in cases where you have multiple configurations in your kube config file, this might not be ideal, and I like to be precise, so I will extract the client certificate, client key and cluster ca certificate and endpoint from our ~/.kube/config file.
If we run cat ~/.kube/config we will see something like this:
First we will create a directory for our certificates:
1
mkdir ~/certs
I have truncated my kube config for readability, but for our first file certs/client-cert.pem we will copy the value of client-certificate-data:, which will look something like this:
Then we will copy the contents of client-key-data: into certs/client-key.pem and then lastly the content of certificate-authority-data: into certs/cluster-ca-cert.pem.
So then we should have the following files inside our certs/ directory:
Your host might look different to mine, but you can find your host endpoint in ~/.kube/config.
For a simple test we can list all our namespaces to ensure that our configuration is working. In a file called namespaces.tf, we can populate the following:
12345
data "kubernetes_all_namespaces""allns"{}output "all-ns"{value= data.kubernetes_all_namespaces.allns.namespaces
}
Now we need to initialize terraform so that it can download the providers:
1
terraform init
Then we can run a plan which will reveal our namespaces:
12345678910111213
terraform plan
data.kubernetes_all_namespaces.allns: Reading...
data.kubernetes_all_namespaces.allns: Read complete after 0s [id=a0ff7e83ffd7b2d9953abcac9f14370e842bdc8f126db1b65a18fd09faa3347b]Changes to Outputs:
+ all-ns =[ + "default",
+ "kube-node-lease",
+ "kube-public",
+ "kube-system",
+ "local-path-storage",
]
We can now remove our namespaces.tf as our test worked:
1
rm namespaces.tf
Helm Releases with Terraform
We will need two things, we need to consult the terraform helm release provider documentation and we also need to consult the helm chart documentation which we are interested in.
As we are working with helm releases, we need to configure the helm provider, I will just extend my configuration from my previous provider config in providers.tf:
In our main.tf I will use two ways to override values in our values.yaml using set and templatefile. The reason for the templatefile, is when we want to fetch a value and want to replace the content with our values file, it could be used when we retrieve a value from a data source as an example. In my example im just using a variable.
variable "release_name" {type = stringdefault = "nginx"description = "The name of our release."}variable "chart_repository_url" {type = stringdefault = "https://charts.bitnami.com/bitnami"description = "The chart repository url."}variable "chart_name" {type = stringdefault = "nginx"description = "The name of of our chart that we want to install from the repository."}variable "chart_version" {type = stringdefault = "13.2.20"description = "The version of our chart."}variable "namespace" {type = stringdefault = "apps"description = "The namespace where our release should be deployed into."}variable "create_namespace" {type = booldefault = truedescription = "If it should create the namespace if it doesnt exist."}variable "atomic" {type = booldefault = falsedescription = "If it should wait until release is deployed."}
Terraform used the selected providers to generate the following execution plan. Resource actions are indicated with the following symbols:
+ create
Terraform will perform the following actions:
# helm_release.nginx will be created + resource "helm_release""nginx"{ + atomic=false + chart="nginx" + cleanup_on_fail=false + create_namespace=true + dependency_update=false + disable_crd_hooks=false + disable_openapi_validation=false + disable_webhooks=false + force_update=false + id=(known after apply) + lint=false + manifest=(known after apply) + max_history= 0
+ metadata=(known after apply) + name="nginx" + namespace="apps" + pass_credentials=false + recreate_pods=false + render_subchart_notes=true + replace=false + repository="https://charts.bitnami.com/bitnami" + reset_values=false + reuse_values=false + skip_crds=false + status="deployed" + timeout= 300
+ values=[ + <<-EOT nameOverride: "nginx" ## ref: https://hub.docker.com/r/bitnami/nginx/tags/ image: registry: docker.io repository: bitnami/nginx tag: 1.23.3-debian-11-r3 EOT,
] + verify=false + version="13.2.20" + wait=false + wait_for_jobs=false + set{ + name="image.tag" + value="1.23.3-debian-11-r3"}}Plan: 1 to add, 0 to change, 0 to destroy.
Changes to Outputs:
+ metadata=(known after apply)
Once we are happy with our plan, we can run a apply:
123456789101112131415161718192021222324252627
terraform apply
Plan: 1 to add, 0 to change, 0 to destroy.
Changes to Outputs:
+ metadata=(known after apply)Do you want to perform these actions?
Terraform will perform the actions described above.
Only 'yes' will be accepted to approve.
Enter a value: yes
helm_release.nginx: Creating...
helm_release.nginx: Still creating... [10s elapsed]metadata= tolist([{"app_version"="1.23.3""chart"="nginx""name"="nginx""namespace"="apps""revision"= 1
"values"="{\"image\":{\"registry\":\"docker.io\",\"repository\":\"bitnami/nginx\",\"tag\":\"1.23.3-debian-11-r3\"},\"nameOverride\":\"nginx\"}""version"="13.2.20"},
])
Then we can verify if the pod is running:
123
kubectl get pods -n apps
NAME READY STATUS RESTARTS AGE
nginx-59bdc6465-xdbfh 1/1 Running 0 2m35s
Importing Helm Releases into Terraform State
If you have an existing helm release that was deployed with helm and you want to transfer the ownership to terraform, you first need to write the terraform code, then import the resources into terraform state using:
1
terraform import helm_release.nginx apps/nginx
Where the last argument is <namespace>/<release-name>. Once that is imported you can run terraform plan and apply.
If you want to discover all helm releases managed by helm you can use:
1
kubectl get all -A -l app.kubernetes.io/managed-by=Helm
Thank You
Thanks for reading, feel free to check out my website, feel free to subscribe to my newsletter or follow me at @ruanbekker on Twitter.
]]><![CDATA[Persisting Terraform Remote State in Gitlab]]>2023-03-05T01:43:54-05:00https://blog.ruanbekker.com/blog/2023/03/05/persisting-terraform-remote-state-in-gitlab
In this tutorial we will demonstrate how to persist your terraform state in gitlab managed terraform state, using the terraform http backend.
We will create a terraform pipeline which will run the plan step automatically and a manual step to run the apply step.
During these steps and different pipelines we need to persist our terraform state remotely so that new pipelines can read from our state what we last stored.
Gitlab offers a remote backend for our terraform state which we can use, and we will use a basic example of using the random resource.
Prerequisites
If you don’t see the “Infrastructure” menu on your left, you need to enable it at “Settings”, “General”, “Visibility”, “Project features”, “Permissions” and under “Operations”, turn on the toggle.
For more information on this see their documentation
Authentication
For this demonstration I created a token which is only scoped for this one project, for this we need a to create a token under, “Settings”, “Access Tokens”:
Select the api under scope:
Store the token name and token value as TF_USERNAME and TF_PASSWORD as a CICD variable under “Settings”, “CI/CD”, “Variables”.
Terraform Code
We will use a basic random_uuid resource for this demonstration, our main.tf:
Where the magic happens is in the terraform init step, that is where we will initialize the terraform state in gitlab, and as you can see we are taking the TF_ADDRESS variable to define the path of our state and in this case our state file will be named default-terraform.tfstate.
If it was a case where you are deploying multiple environments, you can use something like ${ENVIRONMENT}-terraform.tfstate.
When we run our pipeline, we can look at our plan step:
Once we are happy with this we can run the manual step and do the apply step, then our pipeline should look like this:
When we inspect our terraform state in the infrastructure menu, we can see the state file was created:
Thank You
Thanks for reading, feel free to check out my website, feel free to subscribe to my newsletter or follow me at @ruanbekker on Twitter.
]]><![CDATA[Everything You Need to Know About Helm]]>2023-01-24T16:02:22-05:00https://blog.ruanbekker.com/blog/2023/01/24/everything-you-need-to-know-about-helm
Helm, its one amazing piece of software that I use multiple times per day!
What is Helm?
You can think of helm as a package manager for kubernetes, but in fact its much more than that.
Think about it in the following way:
Kubernetes Package Manager
Way to templatize your applications (this is the part im super excited about)
Easy way to install applications to your kubernetes cluster
Easy way to do upgrades to your applications
Websites such as artifacthub.io provides a nice interface to lookup any application an how to install or upgrade that application.
How does Helm work?
Helm uses your kubernetes config to connect to your kubernetes cluster. In most cases it utilises the config defined by the KUBECONFIG environment variable, which in most cases points to ~/kube/config.
If you want to follow along, you can view the following blog post to provision a kubernetes cluster locally:
Once you have provisioned your kubernetes cluster locally, you can proceed to install helm, I will make the assumption that you are using Mac:
1
brew install helm
Once helm has been installed, you can test the installation by listing any helm releases, by running:
1
helm list
Helm Charts
Helm uses a packaging format called charts, which is a collection of files that describes a related set of kubernetes resources. A sinlge helm chart m
ight be used to deploy something simple such as a deployment or something complex that deploys a deployment, ingress, horizontal pod autoscaler, etc.
Using Helm to deploy applications
So let’s assume that we have our kubernetes cluster deployed, and now we are ready to deploy some applications to kubernetes, but we are unsure on how we would do that.
Let’s assume we want to install Nginx.
First we would navigate to artifacthub.io, which is a repository that holds a bunch of helm charts and the information on how to deploy helm charts to our cluster.
Then we would search for Nginx, which would ultimately let us land on:
But before we do that, if we think about it, we add a repository, then before we install a release, we could first find information such as the release versions, etc.
So the way I would do it, is to first add the repository:
Then since we have added the repository, we can update our repository to ensure that we have the latest release versions:
1
$ helm repo update
Now that we have updated our local repositories, we want to find the release versions, and we can do that by listing the repository in question. For example, if we don’t know the application name, we can search by the repository name:
1
$ helm search repo bitnami/ --versions
In this case we will get an output of all the applications that is currently being hosted by Bitnami.
If we know the repository and the release name, we can extend our search by using:
1
$ helm search repo bitnami/nginx --versions
In this case we get an output of all the Nginx release versions that is currently hosted by Bitnami.
Installing a Helm Release
Now that we have received a response from helm search repo, we can see that we have different release versions, as example:
123
NAME CHART VERSION APP VERSION DESCRIPTION
bitnami/nginx 13.2.22 1.23.3 NGINX Open Source is a web server that can be a...
bitnami/nginx 13.2.21 1.23.3 NGINX Open Source is a web server that can be a...
For each helm chart, the chart has default values which means, when we install the helm release it will use the default values which is defined by the helm chart.
We have the concept of overriding the default values with a yaml configuration file we usually refer to values.yaml, that we can define the values that we want to override our default values with.
To get the current default values, we can use helm show values, which will look like the following:
1
$ helm show values bitnami/nginx --version 13.2.22
That will output to standard out, but we can redirect the output to a file using the following:
1
$ helm show values bitnami/nginx --version 13.2.22 > nginx-values.yaml
Now that we have redirected the output to nginx-values.yaml, we can inspect the default values using cat nginx-values.yaml, and any values that we see that we want to override, we can edit the yaml file and once we are done we can save it.
Now that we have our override values, we can install a release to our kubernetes cluster.
Let’s assume we want to install nginx to our cluster under the name my-nginx and we want to deploy it to the namespace called web-servers:
upgrade --install - meaning we are installing a release, if already exists, do an upgrade
my-nginx - use the release name my-nginx
bitnami/nginx - use the repository and chart named nginx
--values nginx-values.yaml - define the values file with the overrides
--namespace web-servers --create-namespace - define the namespace where the release will be installed to, and create the namespace if not exists
--version 13.2.22 - specify the version of the chart to be installed
Information about the release
We can view information about our release by running:
1
$ helm list -n web-servers
Creating your own helm charts
It’s very common to create your own helm charts when you follow a common pattern in a microservice architecture or something else, where you only want to override specific values such as the container image, etc.
In this case we can create our own helm chart using:
123
$ mkdir ~/charts
$ cd ~/charts
$ helm create my-chart
This will create a scaffoliding project with the required information that we need to create our own helm chart. If we look at a tree view, it will look like the following:
In our example it will create a service account, service, deployment, etc.
As you can see the spec.template.spec.containers[].image is set to nginx:1.16.0, and to see how that was computed, we can have a look at templates/deployment.yaml:
As you can see in image: section we have .Values.image.repository and .Values.image.tag, and those values are being retrieved from the values.yaml file, and when we look at the values.yaml file:
12345
image:repository:nginxpullPolicy:IfNotPresent# Overrides the image tag whose default is the chart appVersion.tag:""
If we want to override the image repository and image tag, we can update the values.yaml file to lets say:
$ helm plugin list
NAME VERSION DESCRIPTION
cm-push 0.10.3 Push chart package to ChartMuseum
Now we add our chartmuseum helm chart repository, which we will call cm-local:
1
$ helm repo add cm-local http://localhost:8080/
We can list our helm repository:
123
$ helm repo list
NAME URL
cm-local http://localhost:8080/
Now that our helm repository has been added, we can push our helm chart to our helm chart repository. Ensure that we are in our chart repository directory, where the Chart.yaml file should be in our current directory. We need this file as it holds metadata about our chart.
We can view the Chart.yaml:
123456
apiVersion:v2name:my-chartdescription:A Helm chart for Kubernetestype:applicationversion:0.1.0appVersion:"1.16.0"
Now we should update our repositories so that we can get the latest changes:
1
$ helm repo update
Now we can list the charts under our repository:
123
$ helm search repo cm-local/
NAME CHART VERSION APP VERSION DESCRIPTION
cm-local/my-chart 0.0.1 1.16.0 A Helm chart for Kubernetes
We can now get the values for our helm chart by running:
1
$ helm show values cm-local/my-chart
This returns the values yaml that we can use for our chart, so let’s say you want to output the values yaml so that we can use to to deploy a release we can do:
1
$ helm show values cm-local/my-chart > my-values.yaml
If you need a kubernetes cluster and you would like to run this locally, find the following documentation in order to do that:
- using kind for local kubernetes clusters
Thank You
Thanks for reading, feel free to check out my website, feel free to subscribe to my newsletter or follow me at @ruanbekker on Twitter.
]]><![CDATA[Getting Started With Wiremock]]>2023-01-14T17:03:12-05:00https://blog.ruanbekker.com/blog/2023/01/14/getting-started-with-wiremockIn this tutorial we will use docker to run an instance of wiremock to setup a mock api for us to test our api’s.
Wiremock
Wiremock is a tool for building mock API’s which enables us to build stable development environments.
Docker and Wiremock
Run a wiremock instance with docker:
1
docker run -it --rm -p 8080:8080 --name wiremock wiremock/wiremock:2.34.0
Then our wiremock instance will be exposed on port 8080 locally, which we can use to make a request against to create a api mapping:
]]><![CDATA[Logging With Docker Promtail and Grafana Loki]]>2022-11-18T00:42:49-05:00https://blog.ruanbekker.com/blog/2022/11/18/logging-with-docker-promtail-and-grafana-loki
In this post we will use Grafana Promtail to collect all our logs and ship it to Grafana Loki.
About
We will be using Docker Compose and mount the docker socket to Grafana Promtail so that it is aware of all the docker events and configure it that only containers with docker labels logging=promtail needs to be enabled for logging, which will then scrape those logs and send it to Grafana Loki where we will visualize it in Grafana.
Promtail
In our promtail configuration config/promtail.yaml:
You can see we are using the docker_sd_configs provider and filter only docker containers with the docker labels logging=promtail and once we have those logs we relabel our labels to have the container name and we also use docker labels like log_stream and logging_jobname to add labels to our logs.
Grafana Config
We would like to auto configure our datasources for Grafana and in config/grafana-datasources.yml we have:
Which uses logging: "promtail" to let promtail know this log container’s log to be scraped and logging_jobname: "containerlogs" which will assign containerlogs to the job label.
]]><![CDATA[KinD for Local Kubernetes Clusters]]>2022-09-20T02:18:16-04:00https://blog.ruanbekker.com/blog/2022/09/20/kind-for-local-kubernetes-clusters
In this tutorial we will demonstrate how to use KinD (Kubernetes in Docker) to provision local kubernetes clusters for local development.
Updated at: 2023-12-22
About
KinD uses container images to run as “nodes”, so spinning up and tearing down clusters becomes really easy or running multiple or different versions, is as easy as pointing to a different container image.
Configuration such as node count, ports, volumes, image versions can either be controlled via the command line or via configuration, more information on that can be found on their documentation:
Creating cluster "cluster-1" ...
✓ Ensuring node image (kindest/node:v1.26.6) 🖼
✓ Preparing nodes 📦
✓ Writing configuration 📜
✓ Starting control-plane 🕹️
✓ Installing CNI 🔌
✓ Installing StorageClass 💾
Set kubectl context to "kind-cluster-1"You can now use your cluster with:
kubectl cluster-info --context kind-cluster-1
Have a question, bug, or feature request? Let us know! https://kind.sigs.k8s.io/#community 🙂
Then you can interact with the cluster using:
1
kubectl get nodes --context kind-cluster-1
Then delete the cluster using:
1
kind delete cluster --name kind-cluster-1
I highly recommend installing kubectx, which makes it easy to switch between kubernetes contexts.
Create a Cluster with Config
If you would like to define your cluster configuration as config, you can create a file default-config.yaml with the following as a 2 node cluster, and specifying version 1.24.0:
kubectl get nodes -o wide
NAME STATUS ROLES AGE VERSION INTERNAL-IP EXTERNAL-IP OS-IMAGE KERNEL-VERSION CONTAINER-RUNTIME
kind-cluster-control-plane Ready control-plane 2m11s v1.26.6 172.20.0.5 <none> Ubuntu 21.10 5.10.104-linuxkit containerd://1.6.4
kind-cluster-worker Ready <none> 108s v1.26.6 172.20.0.4 <none> Ubuntu 21.10 5.10.104-linuxkit containerd://1.6.4
Deploy Sample Application
We will create a deployment, a service and port-forward to our service to access our application. You can also specify port configuration to your cluster so that you don’t need to port-forward, which you can find in their port mappings documentation
I will be using the following commands to generate the manifests, but will also add them to this post:
kubectl get deployment,pod,service
NAME READY UP-TO-DATE AVAILABLE AGE
deployment.apps/hostname 2/2 22 9m27s
NAME READY STATUS RESTARTS AGE
pod/hostname-7ff58c5644-67vhq 1/1 Running 0 9m27s
pod/hostname-7ff58c5644-wjjbw 1/1 Running 0 9m27s
NAME TYPE CLUSTER-IP EXTERNAL-IP PORT(S) AGE
service/hostname-http ClusterIP 10.96.218.58 <none> 80/TCP 5m48s
service/kubernetes ClusterIP 10.96.0.1 <none> 443/TCP 24m
]]><![CDATA[Ansible Playbook for Your Macbook Homebrew Packages]]>2022-08-28T19:14:54-04:00https://blog.ruanbekker.com/blog/2022/08/28/ansible-playbook-for-your-macbook-homebrew-packages
In this tutorial I will demonstrate how to use Ansible for Homebrew Configuration Management. The aim for using Ansible to manage your homebrew packages helps you to have a consistent list of packages on your macbook.
For me personally, when I get a new laptop it’s always a mission to get the same packages installed as what I had before, and ansible solves that for us to have all our packages defined in configuration management.
Our inventory.ini will define the information about our target host, which will be localhost as we are using ansible to run against our local target which is our macbook:
Our playbook homebrew.yaml will define the tasks to add the homebrew taps, cask packages and homebrew packages. You can change the packages as you desire, but these are the ones that I use:
-hosts:localhostname:Macbook Playbookgather_facts:Falsevars:TFENV_ARCH:amd64tasks:-name:Ensures taps are present via homebrewcommunity.general.homebrew_tap:name:""state:presentwith_items:-hashicorp/tap-name:Ensures packages are present via homebrew caskcommunity.general.homebrew_cask:name:""state:presentinstall_options:'appdir=/Applications'with_items:-visual-studio-code-multipass-spotify-name:Ensures packages are present via homebrewcommunity.general.homebrew:name:""path:"/Applications"state:presentwith_items:-openssl-readline-sqlite3-xz-zlib-jq-yq-wget-go-kubernetes-cli-fzf-sshuttle-hugo-helm-kind-awscli-gnupg-kubectx-helm-stern-terraform-tfenv-pyenv-jsonnetignore_errors:yestags:-packages
Thanks for reading, feel free to check out my website, feel free to subscribe to my newsletter or follow me at @ruanbekker on Twitter.
]]><![CDATA[Docker Multistage Builds for Hugo]]>2022-07-31T02:23:51-04:00https://blog.ruanbekker.com/blog/2022/07/31/docker-multistage-builds-for-hugo
In this tutorial I will demonstrate how to keep your docker container images nice and slim with the use of multistage builds for a hugo documentation project.
Hugo is a static content generator so essentially that means that it will generate your markdown files into html. Therefore we don’t need to include all the content from our project repository as we only need the static content (html, css, javascript) to reside on our final container image.
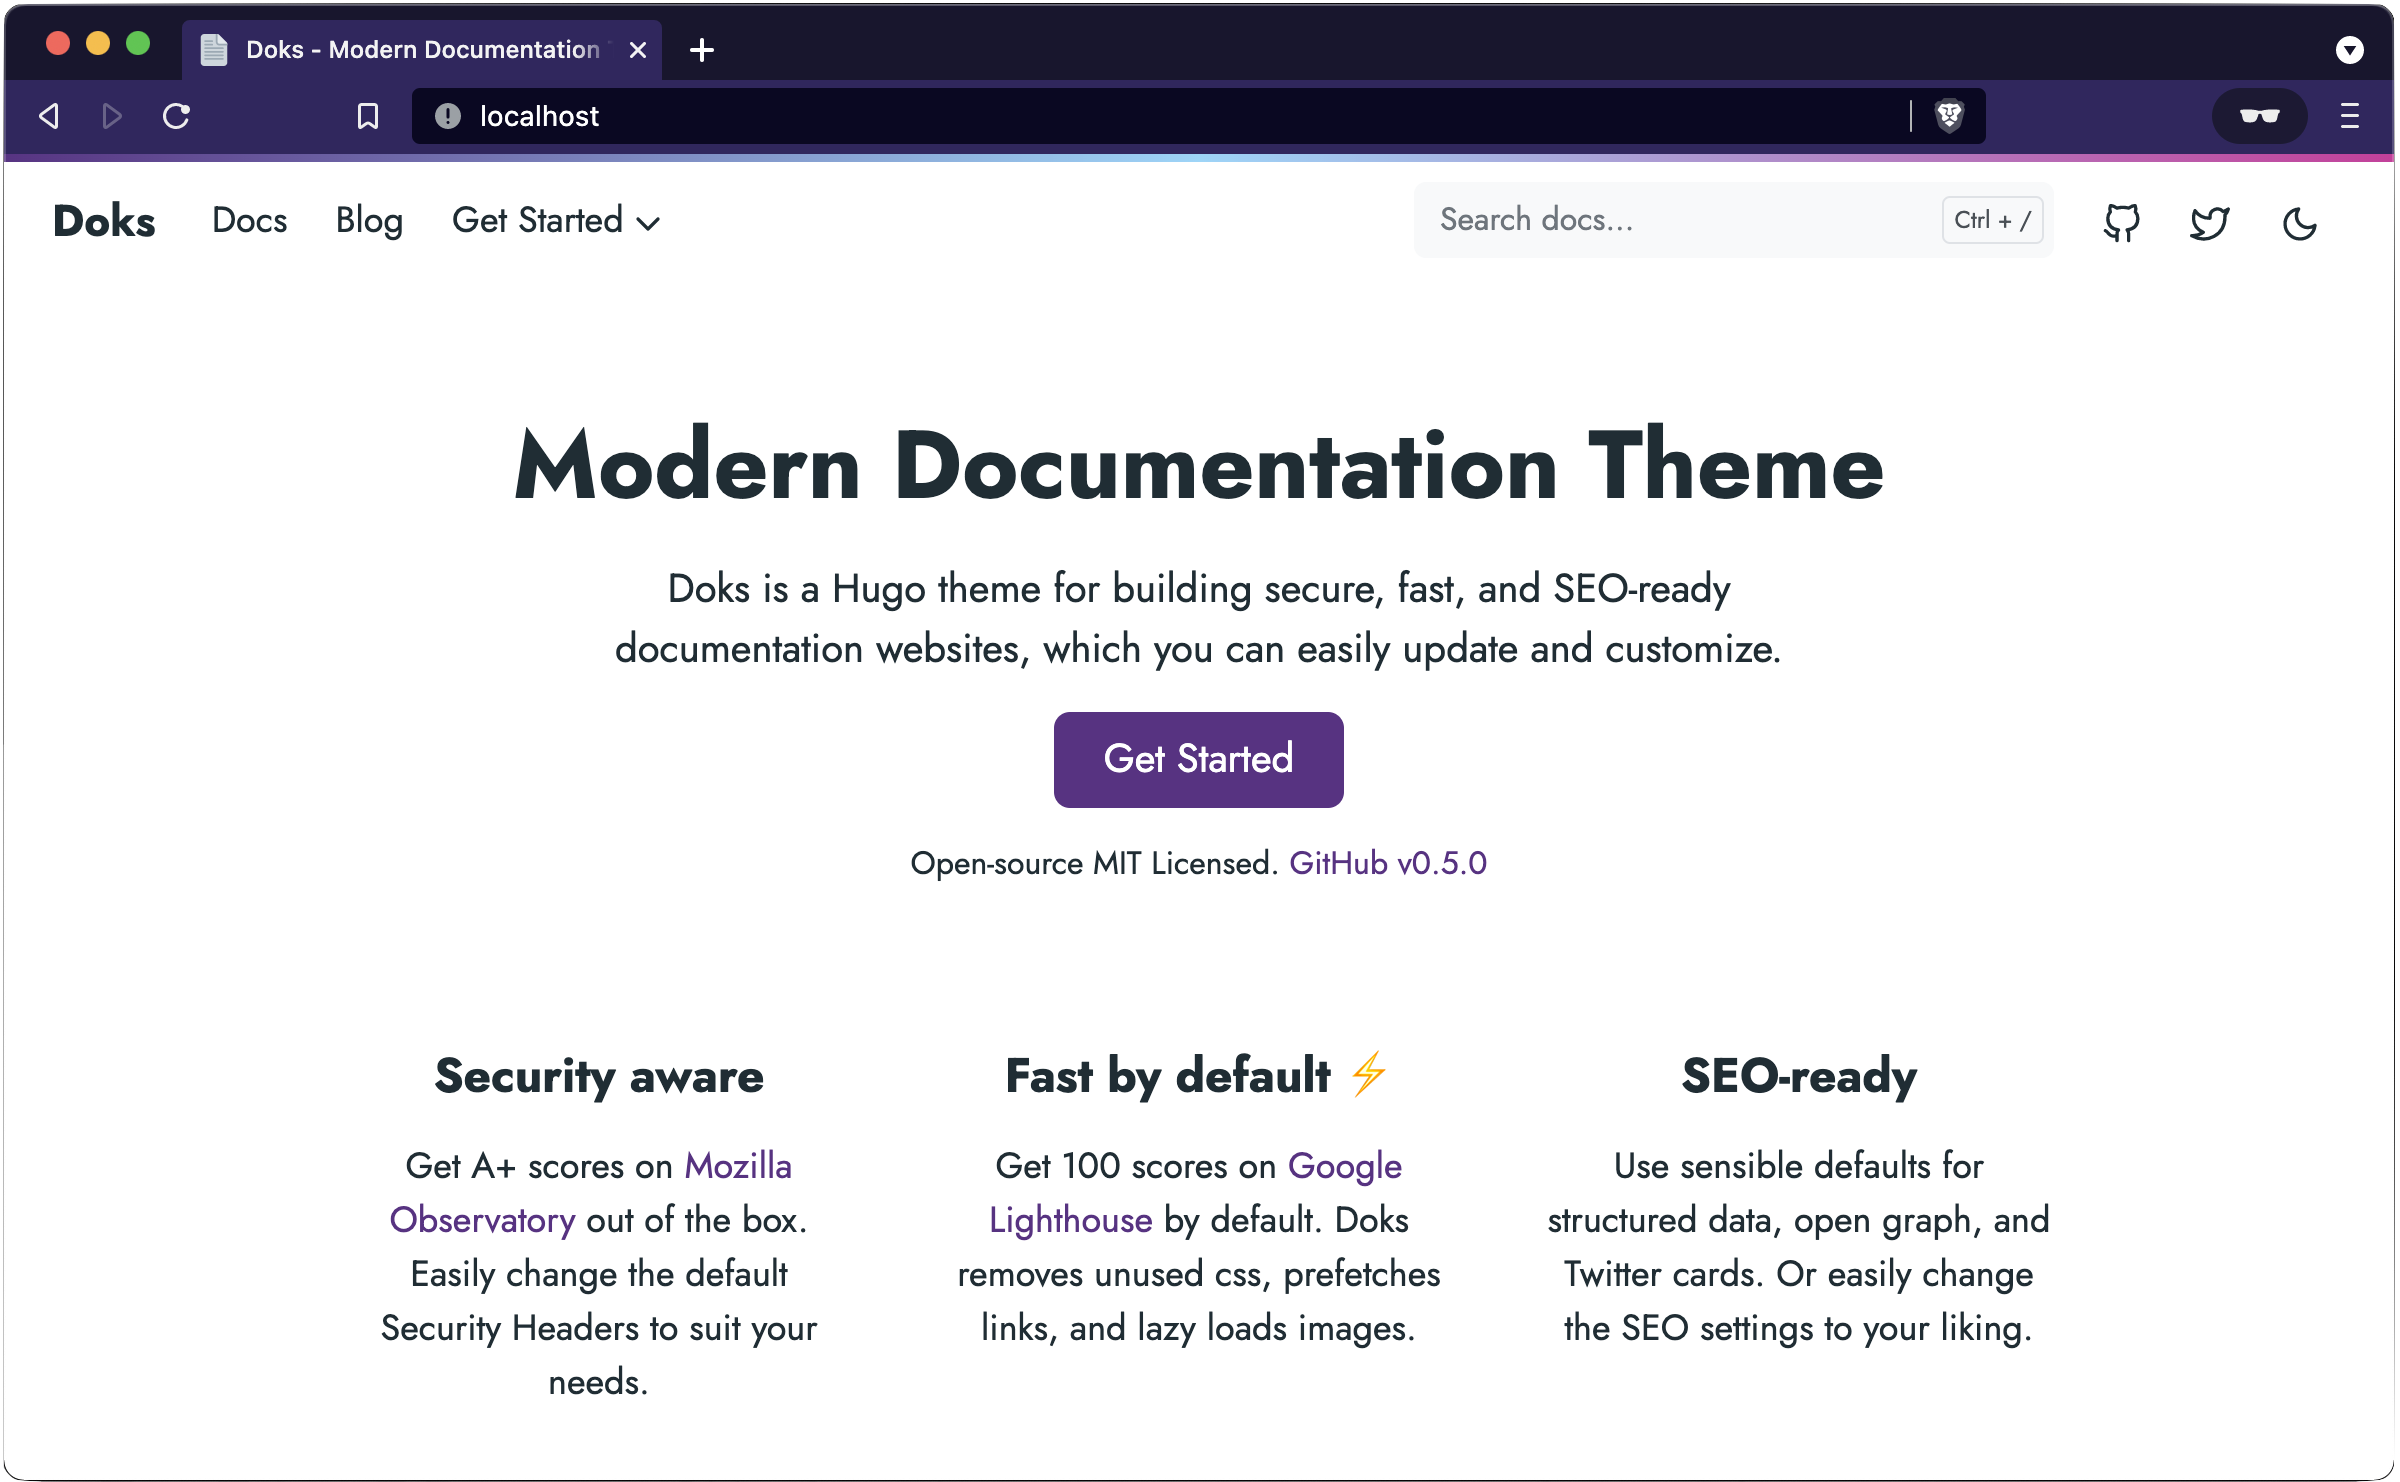
What are we doing today
We will use the DOKS Modern Documentation theme for Hugo as our project example, where we will build and run our documentation website on a docker container, but more importantly make use of multistage builds to optimize the size of our container image.
Our Build Strategy
Since hugo is a static content generator, we will use a node container image as our base. We will then build and generate the content using npm run build which will generate the static content to /src/public in our build stage.
Since we then have static content, we can utilize a second stage using a nginx container image with the purpose of a web server to host our static content. We will copy the static content from our build stage into our second stage and place it under our defined path in our nginx config.
This way we only include the required content on our final container image.
Then we can review the size of our container image, which is only 27.4MB in size, pretty neat right.
1234
docker images --filter reference=ruanbekker/hashnode-docs-blogpost
REPOSITORY TAG IMAGE ID CREATED SIZE
ruanbekker/hashnode-docs-blogpost latest 5b60f30f40e6 21 minutes ago 27.4MB
Running our Container
Now that we’ve built our container image, we can run our documentation site, by specifying our host port on the left to map to our container port on the right in 80:80:
1
docker run -it -p 80:80 ruanbekker/hashnode-docs-blogpost:latest
When you don’t have port 80 already listening prior to running the previous command, when you head to http://localhost (if you are running this locally), you should see our documentation site up and running:
Thanks for reading, feel free to check out my website, feel free to subscribe to my newsletter or follow me at @ruanbekker on Twitter.
]]><![CDATA[Remote Builds With Docker Contexts]]>2022-07-14T01:57:34-04:00https://blog.ruanbekker.com/blog/2022/07/14/remote-builds-with-docker-contexts
Often you want to save some battery life when you are doing docker builds and leverage a remote host to do the intensive work and we can utilise docker context over ssh to do just that.
About
In this tutorial I will show you how to use a remote docker engine to do docker builds, so you still run the docker client locally, but the context of your build will be sent to a remote docker engine via ssh.
We will setup password-less ssh, configure our ssh config, create the remote docker context, then use the remote docker context.
Password-less SSH
I will be copying my public key to the remote host:
1
$ ssh-copy-id ruan@192.168.2.18
Setup my ssh config:
1234567
$ cat ~/.ssh/config
Host home-server
Hostname 192.168.2.18
User ruan
IdentityFile ~/.ssh/id_rsa
StrictHostKeyChecking no
UserKnownHostsFile /dev/null
Test:
12
$ ssh home-server whoami
ruan
Docker Context
On the target host (192.168.2.18) we can verify that docker is installed:
1234567891011121314151617181920212223242526272829
$ docker version
Client: Docker Engine - Community
Version: 20.10.12
API version: 1.41
Go version: go1.16.12
Git commit: e91ed57
Built: Mon Dec 13 11:45:37 2021
OS/Arch: linux/amd64
Context: default
Experimental: trueServer: Docker Engine - Community
Engine:
Version: 20.10.12
API version: 1.41 (minimum version 1.12) Go version: go1.16.12
Git commit: 459d0df
Built: Mon Dec 13 11:43:46 2021
OS/Arch: linux/amd64
Experimental: falsecontainerd:
Version: 1.4.12
GitCommit: 7b11cfaabd73bb80907dd23182b9347b4245eb5d
runc:
Version: 1.0.2
GitCommit: v1.0.2-0-g52b36a2
docker-init:
Version: 0.19.0
GitCommit: de40ad0
On the client (my laptop in this example), we will create a docker context called “home-server” and point it to our target host:
docker context ls
NAME TYPE DESCRIPTION DOCKER ENDPOINT KUBERNETES ENDPOINT ORCHESTRATOR
default * moby Current DOCKER_HOST based configuration unix:///var/run/docker.sock https://k3d-master.127.0.0.1.nip.io:6445 (default) swarm
home-server moby ssh://home-server
Using Contexts
We can verify if this works by listing our cached docker images locally and on our remote host:
12
$ docker --context=default images | wc -l
16
And listing the remote images by specifying the context:
12
$ docker --context=home-server images | wc -l
70
We can set the default context to our target host:
12
$ docker context use home-server
home-server
Running Containers over Contexts
So running containers with remote contexts essentially becomes running containers on remote hosts. In the past, I had to setup a ssh tunnel, point the docker host env var to that endpoint, then run containers on the remote host.
Thats something of the past, we can just point our docker context to our remote host and run the container. If you haven’t set the default context, you can specify the context, so running a docker container on a remote host with your docker client locally:
12
$ docker --context=home-server run -it -p 8002:8080 ruanbekker/hostname
2022/07/14 05:44:04 Server listening on port 8080
Now from our client (laptop), we can test our container on our remote host:
The same way can be used to do remote docker builds, you have your Dockerfile locally, but when you build, you point the context to the remote host, and your context (dockerfile and files referenced in your dockerfile) will be sent to the remote host. This way you can save a lot of battery life as the computation is done on the remote docker engine.
Thank You
Thanks for reading, feel free to check out my website, feel free to subscribe to my newsletter or follow me at @ruanbekker on Twitter.
]]><![CDATA[Create a RAID5 Array With Mdadm on Linux]]>2022-06-29T05:02:13-04:00https://blog.ruanbekker.com/blog/2022/06/29/create-a-raid5-array-with-mdadm-on-linux
In this tutorial we will setup a RAID5 array, which is striping across multiple drives with distributed paritiy, which is good for redundancy. We will be using Ubuntu for our Linux Distribution, but the technique applies to other Linux Distributions as well.
What are we trying to achieve
We will run a server with one root disk and 6 extra disks, where we will first create our raid5 array with three disks, then I will show you how to expand your raid5 array by adding three other disks.
Things fail all the time, and it’s not fun when hard drives breaks, therefore we want to do our best to prevent our applications from going down due to hardware failures. To achieve data redundancy, we want to use three hard drives, which we want to add into a raid configuration that will proviide us:
striping, which is the technique of segmenting logically sequential data, so that consecutive segments are stored on different physical storage devices.
distributed parity, where parity data are distributed between the physical disks, where there is only one parity block per disk, this provide protection against one physical disk failure, where the minimum number of disks are three.
This is how a RAID5 array looks like (image from diskpart.com):
Hardware Overview
We will have a Linux server with one root disk and six extra disks:
12345678910
$ lsblk
NAME MAJ:MIN RM SIZE RO TYPE MOUNTPOINT
xvda 202:0 0 8G 0 disk
└─xvda1 202:1 0 8G 0 part /
xvdb 202:16 0 10G 0 disk
xvdc 202:32 0 10G 0 disk
xvdd 202:48 0 10G 0 disk
xvde 202:64 0 10G 0 disk
xvdf 202:80 0 10G 0 disk
xvdg 202:96 0 10G 0 disk
Dependencies
We require mdadm to create our raid configuration:
12
$ sudo apt update
$ sudo apt install mdadm -y
Format Disks
First we will format and partition the following disks: /dev/xvdb, /dev/xvdc, /dev/xvdd, I will demonstrate the process for one disk, but repeat them for the other as well:
$ fdisk /dev/xvdc
Welcome to fdisk (util-linux 2.34).
Changes will remain in memory only, until you decide to write them.
Be careful before using the write command.
The old ext4 signature will be removed by a write command.
Device does not contain a recognized partition table.
Created a new DOS disklabel with disk identifier 0x26a2d2f6.
Command (m forhelp): n
Partition typep primary (0 primary, 0 extended, 4 free) e extended (container for logical partitions)Select (default p): p
Partition number (1-4, default 1): 1
First sector (2048-20971519, default 2048):
Last sector, +/-sectors or +/-size{K,M,G,T,P}(2048-20971519, default 20971519):
Created a new partition 1 of type'Linux' and of size 10 GiB.
Command (m forhelp): t
Selected partition 1
Hex code (type L to list all codes): fd
Changed type of partition 'Linux' to 'Linux raid autodetect'.
Command (m forhelp): w
The partition table has been altered.
Calling ioctl() to re-read partition table.
Syncing disks.
Create RAID5 Array
Using mdadm, create the /dev/md0 device, by specifying the raid level and the disks that we want to add to the array:
123
$ mdadm --create /dev/md0 --level=5 --raid-devices=3 /dev/xvdb1 /dev/xvdc1 /dev/xvdd1
mdadm: Defaulting to version 1.2 metadata
mdadm: array /dev/md0 started.
Now that our device has been added, we can monitor the process:
To persist the device across reboots, add it to the /etc/fstab file:
12
$ cat /etc/fstab
/dev/md0 /mnt ext4 defaults 0 0
Now our filesystem which is mounted at /mnt is ready to be used.
RAID Configuration (across reboots)
By default RAID doesn’t have a config file, therefore we need to save it manually. If this step is not followed RAID device will not be in md0, but perhaps something else.
So, we must have to save the configuration to persist across reboots, when it reboot it gets loaded to the kernel and RAID will also get loaded.
Note: Saving the configuration will keep the RAID level stable in the md0 device.
Adding Spare Devices
Earlier I mentioned that we have spare disks that we can use to expand our raid device. After they have been formatted we can add them as spare devices to our raid setup:
Once we added the spares and growed our device, we need to run integrity checks, then we can resize the volume. But first, we need to unmount our filesystem:
$ resize2fs /dev/md0
resize2fs 1.45.5 (07-Jan-2020)Resizing the filesystem on /dev/md0 to 13094400(4k) blocks.
The filesystem on /dev/md0 is now 13094400(4k) blocks long.
Then we remount our filesystem:
1
$ mount /dev/md0 /mnt
After the filesystem has been mounted, we can view the disk size and confirm that the size increased:
123
$ df -h /mnt
Filesystem Size Used Avail Use% Mounted on
/dev/md0 50G 52M 47G 1% /mnt
Thank You
Thanks for reading, feel free to check out my website, feel free to subscribe to my newsletter or follow me at @ruanbekker on Twitter.
]]><![CDATA[Install a Specific Python Version on Ubuntu]]>2022-06-23T17:53:46-04:00https://blog.ruanbekker.com/blog/2022/06/23/install-a-specific-python-version-on-ubuntu
In this short tutorial, I will demonstrate how to install a spcific version of Python on Ubuntu Linux.
Head over to the Python Downloads section and select the version of your choice, in my case I will be using Python 3.8.13, once you have the download link, download it:
Compile and add --enable-optimizations flag as an argument:
1
$ ./configure --enable-optimizations
Run make and make install:
12
$ make
$ sudo make install
Once it completes, you can symlink the python binary so that it’s detected by your PATH, if you have no installed python versions or want to use it as the default, you can force overwriting the symlink:
Thanks for reading, feel free to check out my website, feel free to subscribe to my newsletter or follow me at @ruanbekker on Twitter.
]]><![CDATA[How to Persist Iptables Rules After Reboots]]>2022-06-15T06:10:12-04:00https://blog.ruanbekker.com/blog/2022/06/15/how-to-persist-iptables-rules-after-reboots
In this tutorial we will demonstrate how to persist iptables rules across reboots.
Rules Peristence
By default, when you create iptables rules its active, but as soon as you restart your server, the rules will be gone. Therefore we need to persist these rules across reboots.
Dependencies
We require the package iptables-persistent and I will install it on a debian system so I will be using apt: