Logging with Loki is AMAZING!
In the past couple of months i’ve been working a lot with logging, but more specifically logging with loki. As most of my metrics reside in prometheus, I use grafana quite extensively and logging was always the one that stood out a bit as I pushed my logs to elasticsearch and consumed them from grafana. Which worked pretty well, but the maintenance and resource costs was a bit too much for what I was looking for.
And then grafana released Loki, which is like prometheus, but for logs. And that was just super, exactly what I was looking for. For my use case, I was looking for something that can be consumed by grafana as a presentation layer, central based so I can push all sorts of logs, and want a easy way to grep for logs and a bonus would be to have a cli tool.
And Loki checked all those boxes!
What can you expect from this blog
In this post will be a getting started guide to Loki, we will provision Loki, Grafana and Nginx using Docker to get our environment up and running, so that we can push our nginx container logs to the loki datasource, and access the logs via grafana.
We will then generate some logs so that we can show a couple of query examples using the log query language (LogQL) and use the LogCLI to access our logs via cli.
In a future post, I will demonstrate how to setup Loki for a non-docker deployment.
Some useful information about Loki
Let’s first talk about Loki compared with Elasticsearch, as they are not the same:
- Loki does not index the text of the logs, instead grouping entries into streams and index those with labels
- Things like full text search engines tokenizes your text into k/v pairs and gets written to an inverted index, which over time in my opinion gets complex to maintain, expensive to scale, storage retention, etc.
- Loki is advertised as easy to scale, affordable to operate as it uses DynamoDB for Indexing and S3 for Storage
- When using Loki, you may need to forget what you know and look to see how the problem can be solved differently with parallelization. Loki’s superpower is breaking up queries into small pieces and dispatching them in parallel so that you can query huge amounts of log data in small amounts of time.
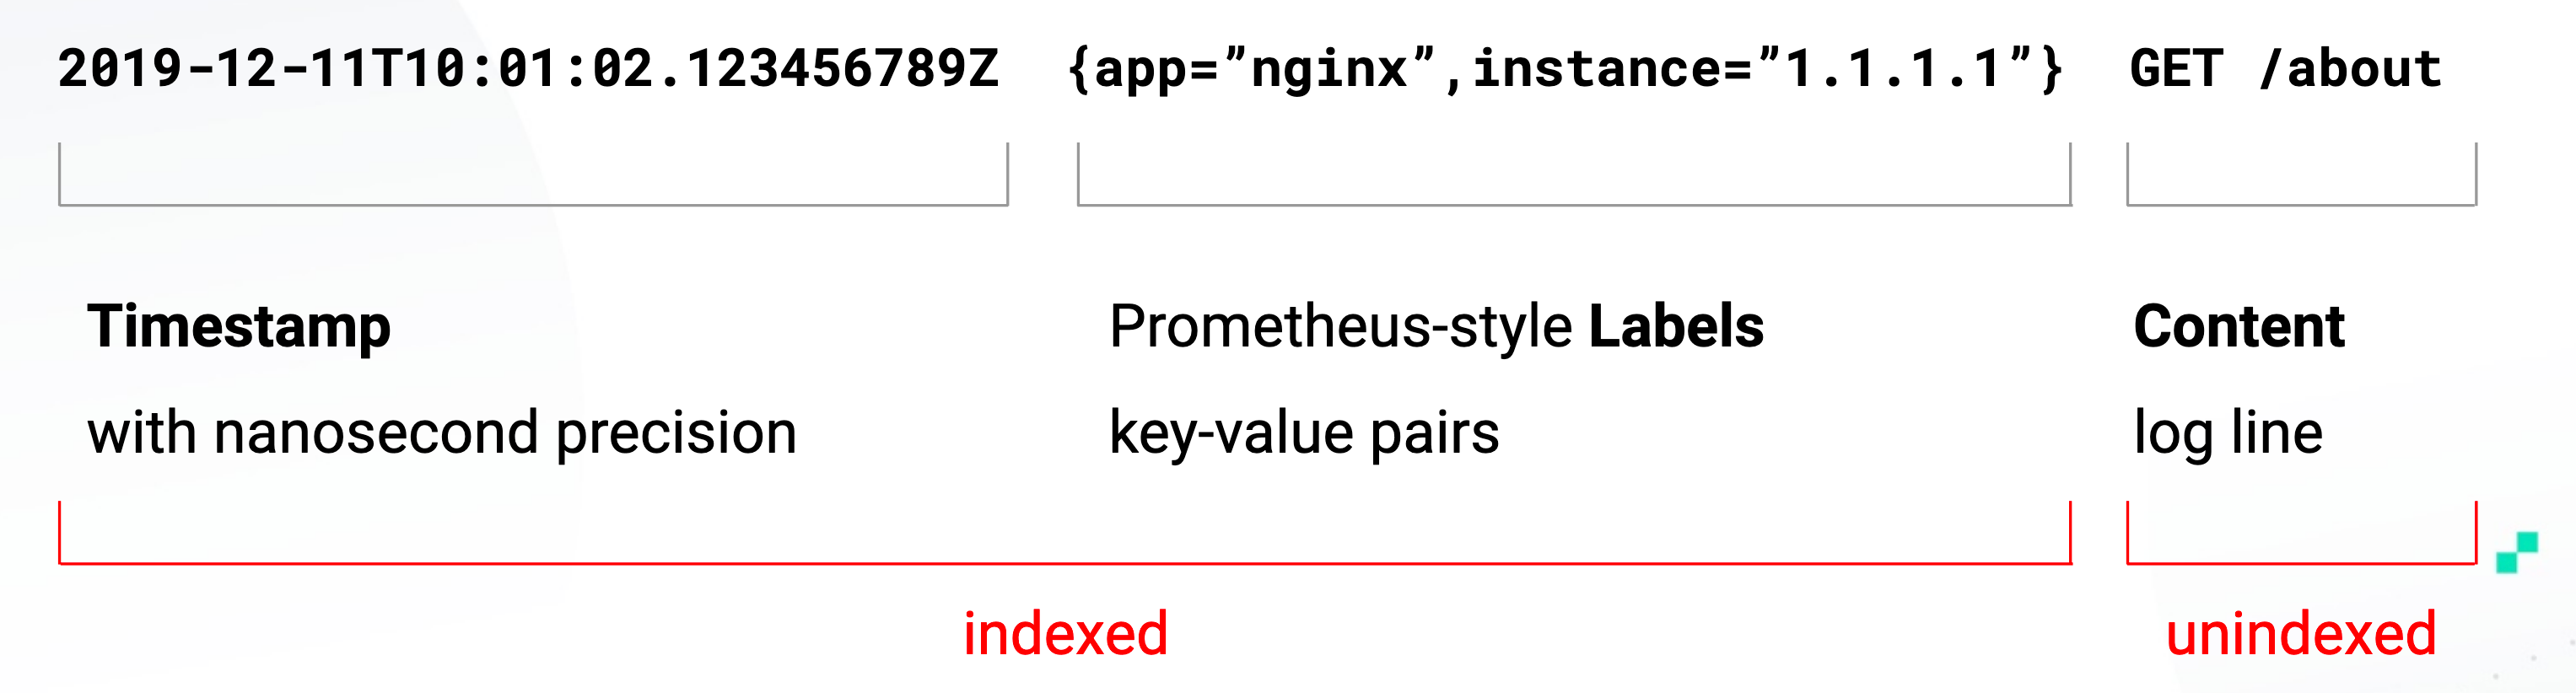
If we look at the Loki Log Model, we can see that the timestamp and the labels are indexed and the content of the logs are not indexed:
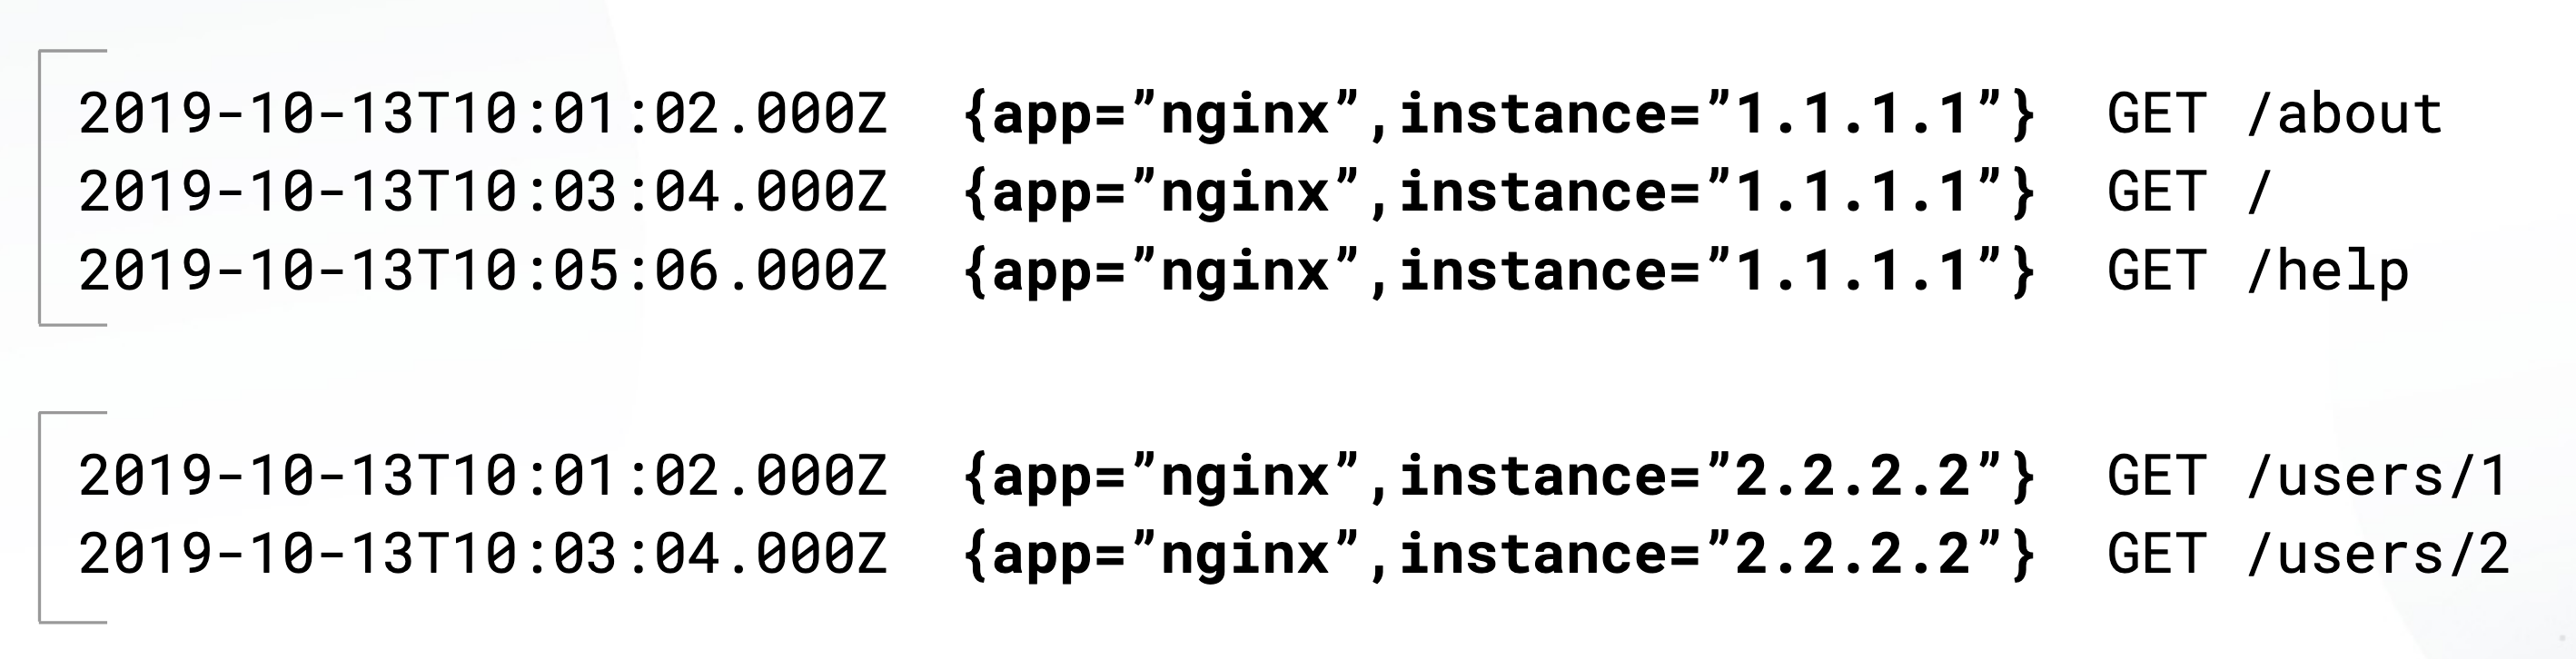
A log stream is a stream of log entries with the same exact label set:
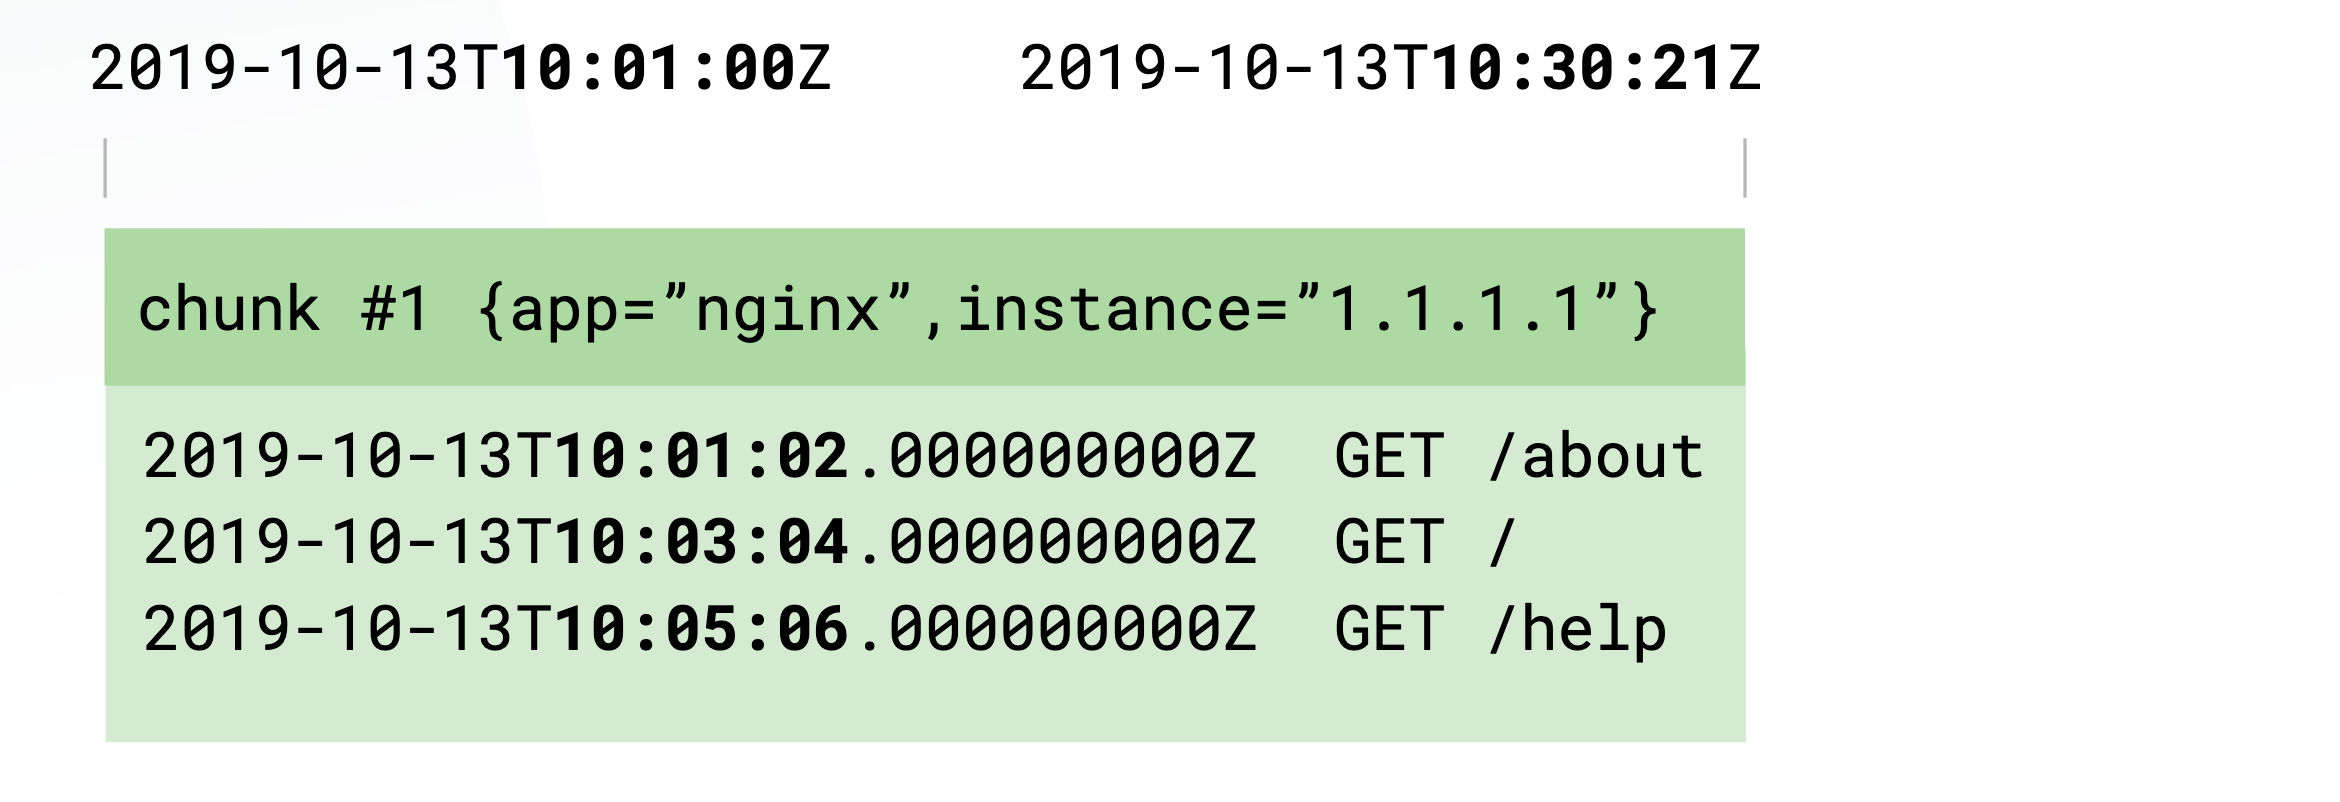
For the storage side, inside each chunk, log entries are sorted by timestamp. Loki only indexes minimum and maximum timestamps of a chunk. Storage options support local storage, AWS S3, Google Cloud Storage and Azure
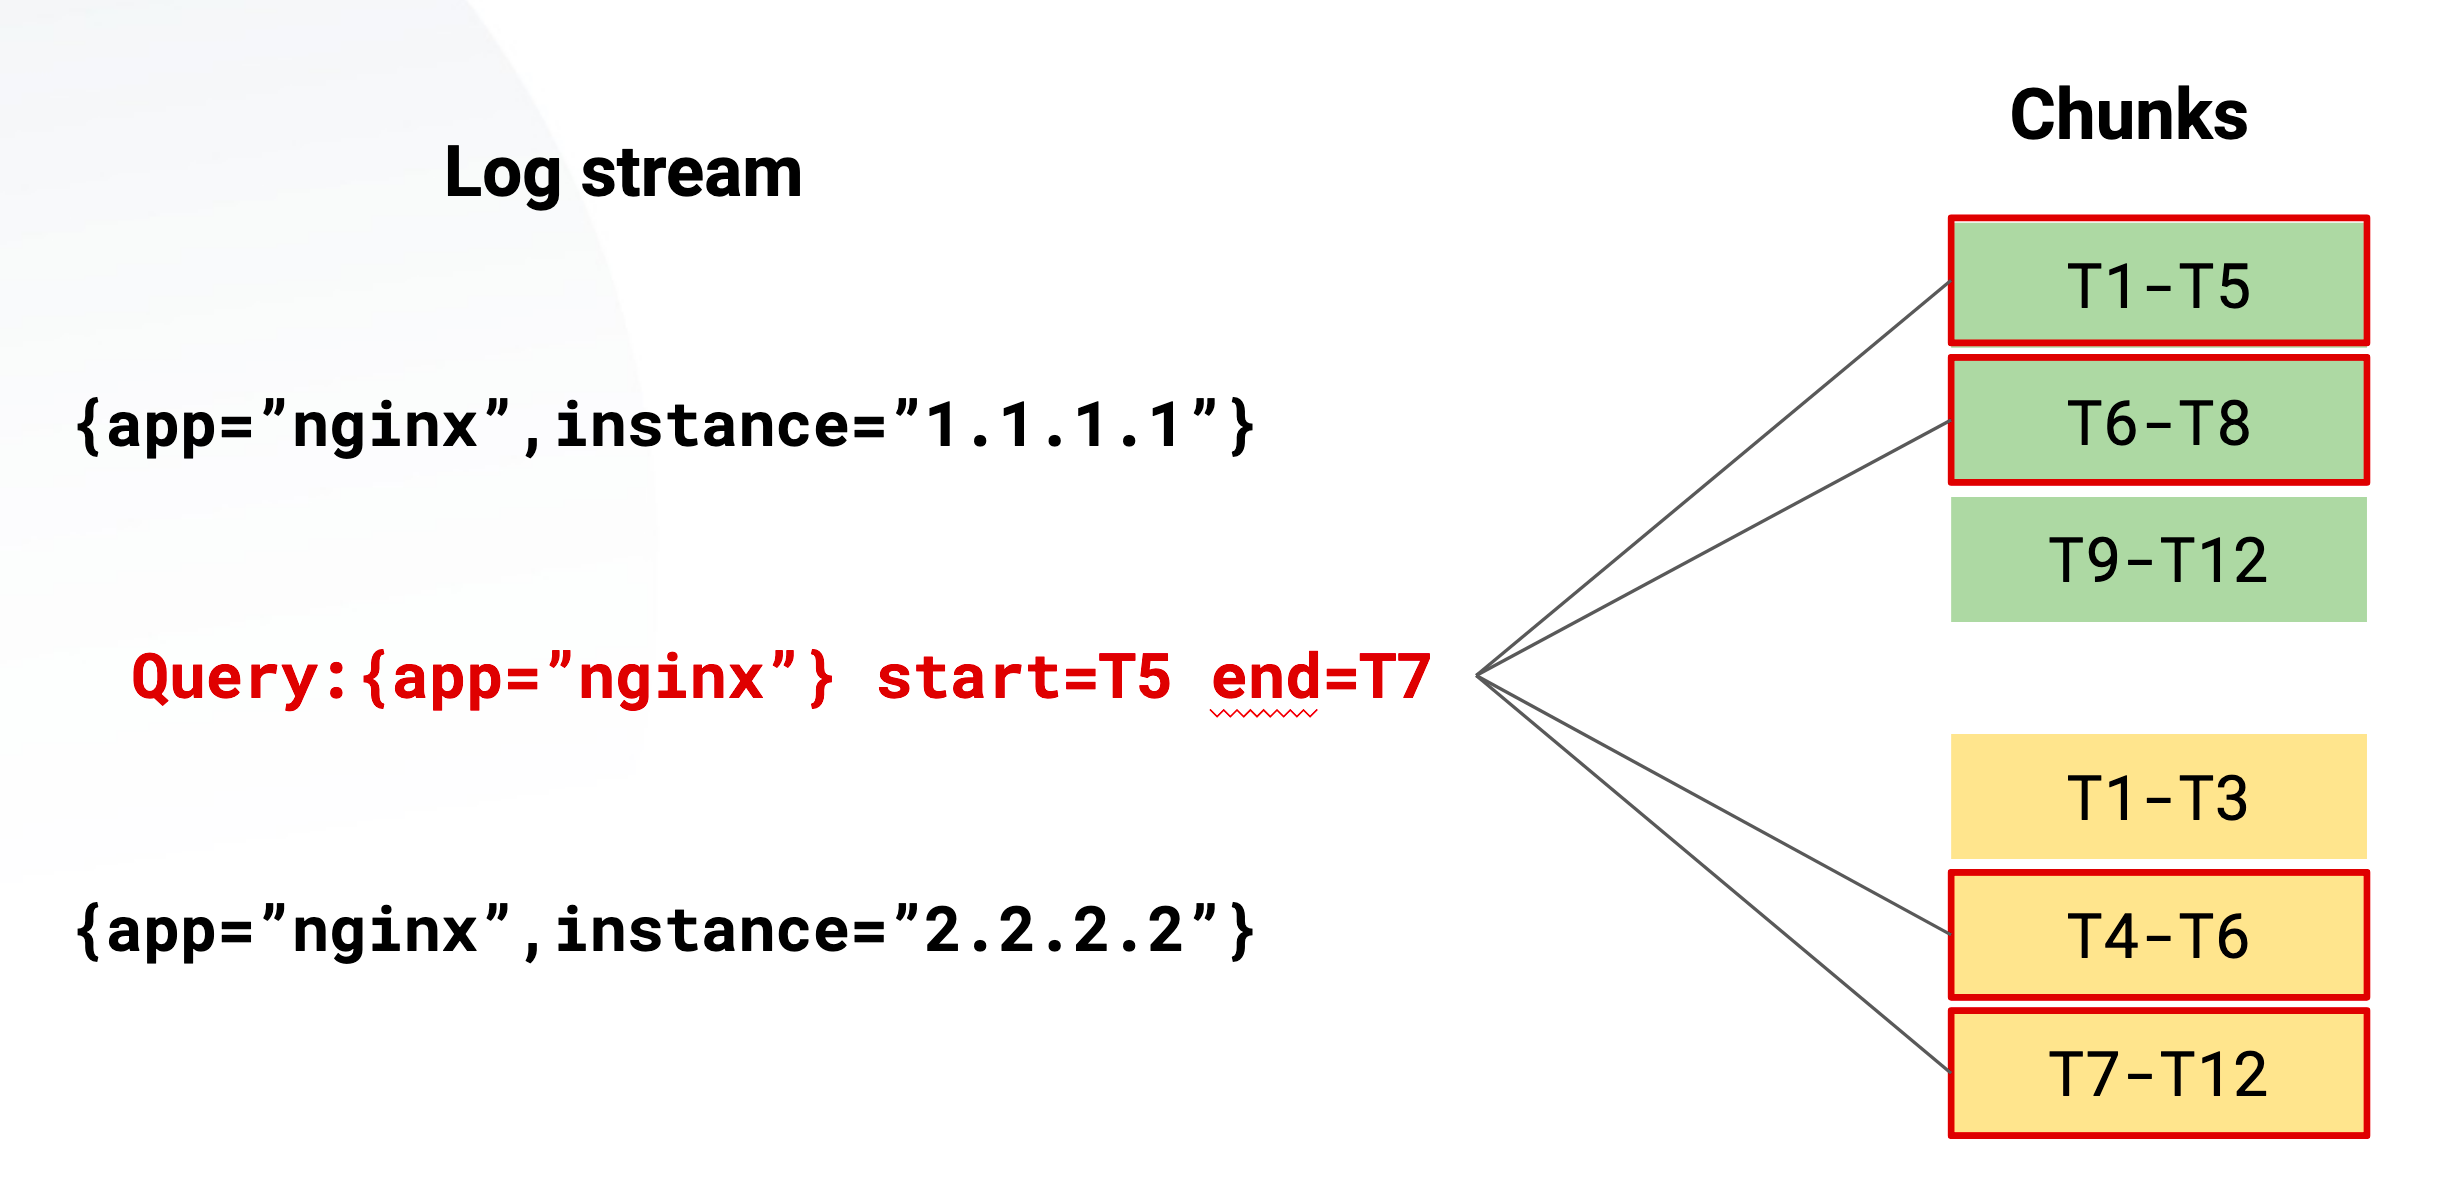
For chunks and querying, chunks are filled per stream and they are flushed of a few criterias such as age and size:
And one of the most important parts are the labels, labels define the stream and therefore its very important.
High cardinality is bad for labels, as something like a IP address can reduce your performance a lot, as it will create a stream for every unique IP label.
Static defined labels such as environment, hostnames are good, you can read more up about it here
Here is a info graphic on how one log line can be split up into 36 streams:
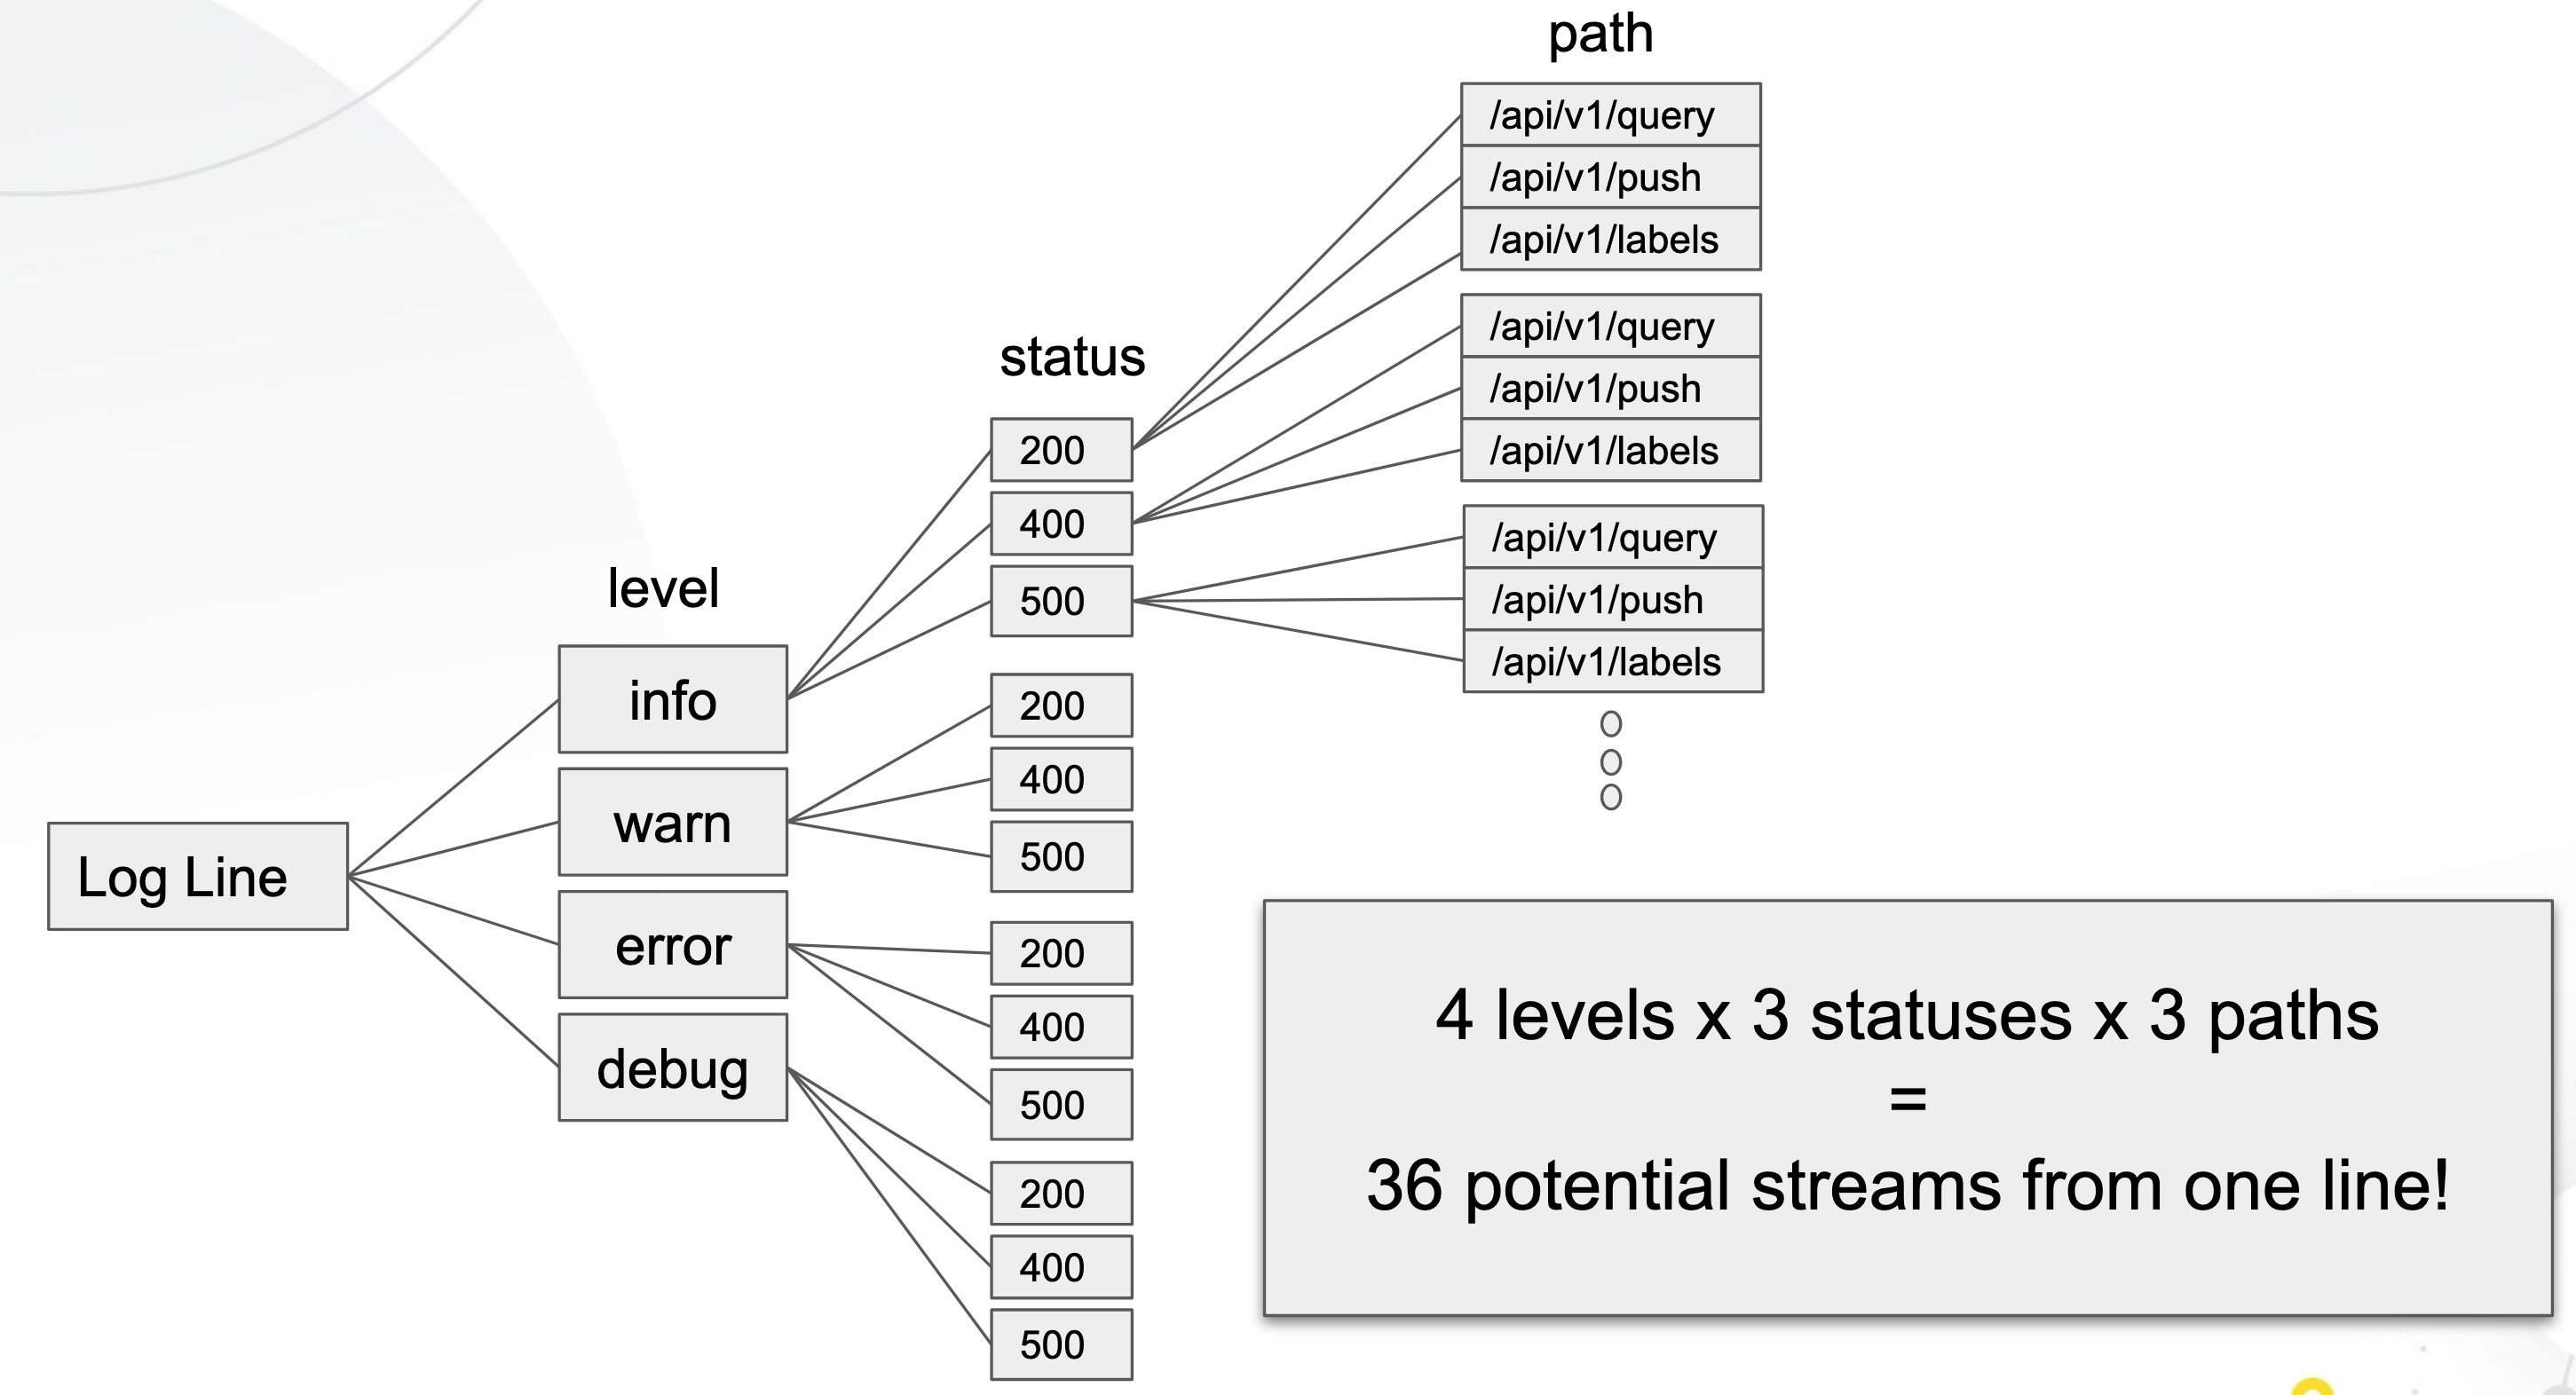
So with that being said, good labels will be considered as cluster, job, namespace, environment, etc where as bad labels will be things such as userid, ip address, url path, etc
Selecting logstreams with Loki
Selecting logstreams, is done by using label matchers and filter expressions, such as this example:
1
| |
Label Matchers and Filter Expressions support:
=Contains string!=Does not contain string=~Matches regular expression!~Does not match regular expression
Supported Clients
At the moment of writing, loki supports the following log clients:
- Promtail (tails logs and ships to Loki)
- Docker Driver
- Fluentd
- Fluent Bit
- Logstash
We will be going into more detail on using promtail in a future post, but you can read more up about it here
Loki in Action
Time to get to the fun part, clone my github repo:
1 2 | |
You can inspect the docker-compose.yml:
1 2 3 4 5 6 7 8 9 10 11 12 13 14 15 16 17 18 19 20 21 22 23 24 25 26 27 28 29 30 31 32 33 | |
As you can see loki will be the datasource where we will be pushing our logs to from our nginx container and we are defining our logging section where it should find loki and we are also setting labels to that log stream using loki-external-labels. Then we are using grafana to auto configure the loki datasource from the ./config/datasource.yml section so that we can visualize our logs.
If you don’t want to define the logging section per container, you can always set the defaults using the /etc/docker/daemon.json by following this guide
Let’s boot up our stack:
1
| |
After everything is up, you should be able to access nginx by visiting: http://nginx.localdns.xyz:8000/, after you received a response, visit Grafana on http://grafana.localdns.xyz:3000 using the username and password: admin/admin.
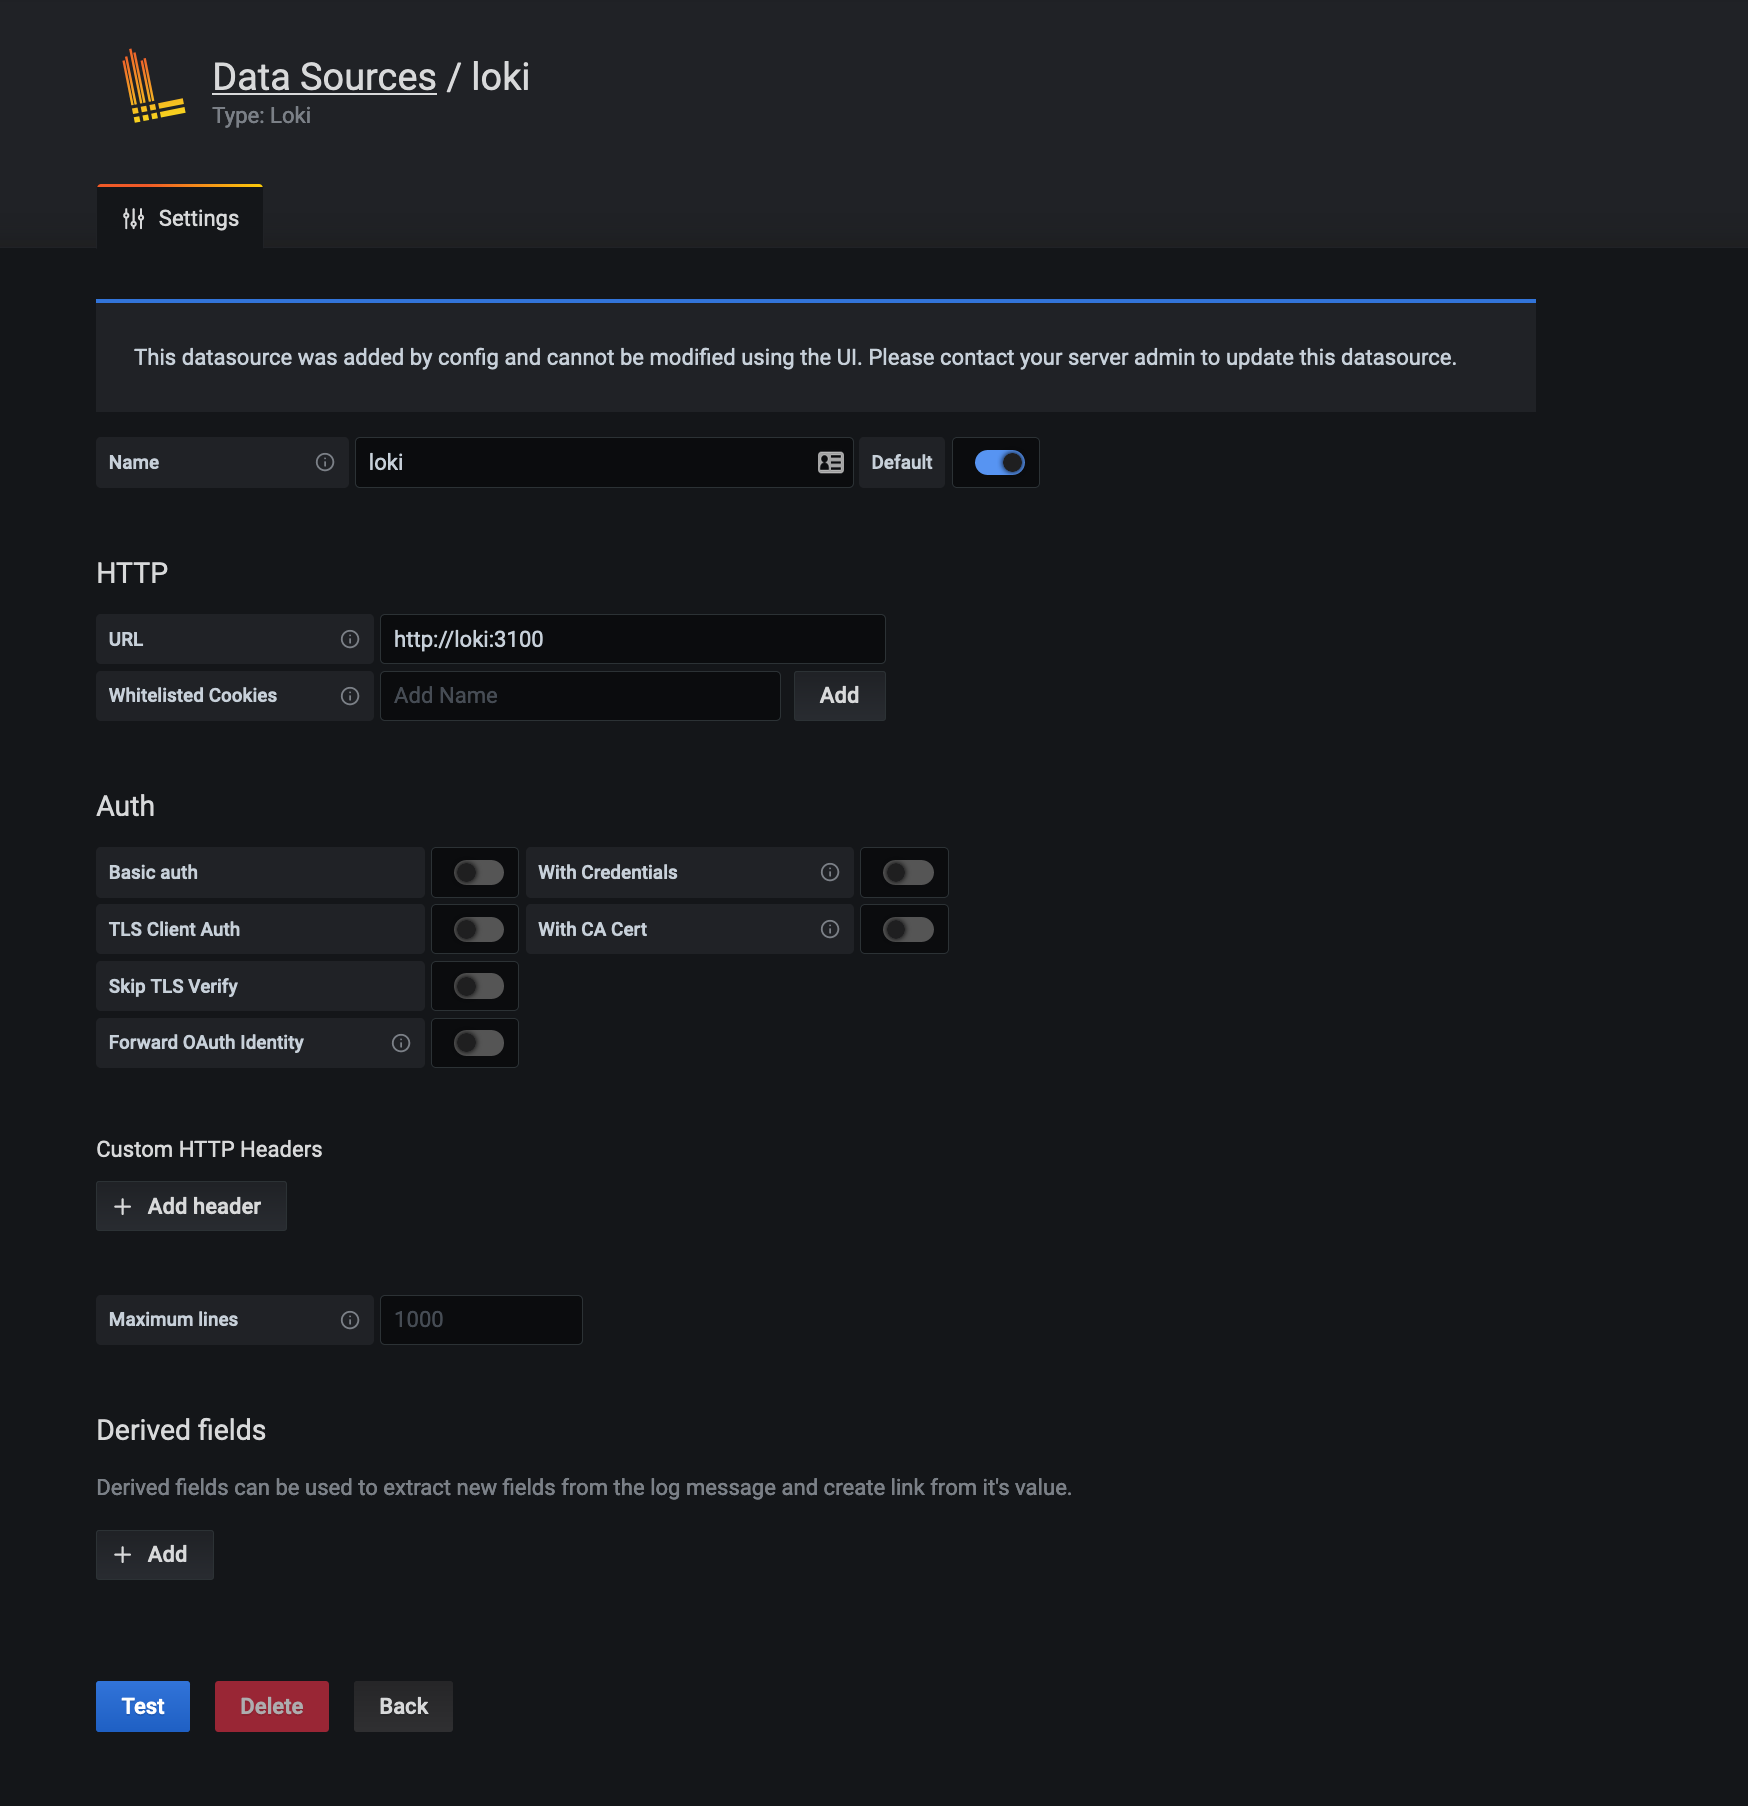
If you head over to datasources, you should see the loki datasource which was provisioned for you:
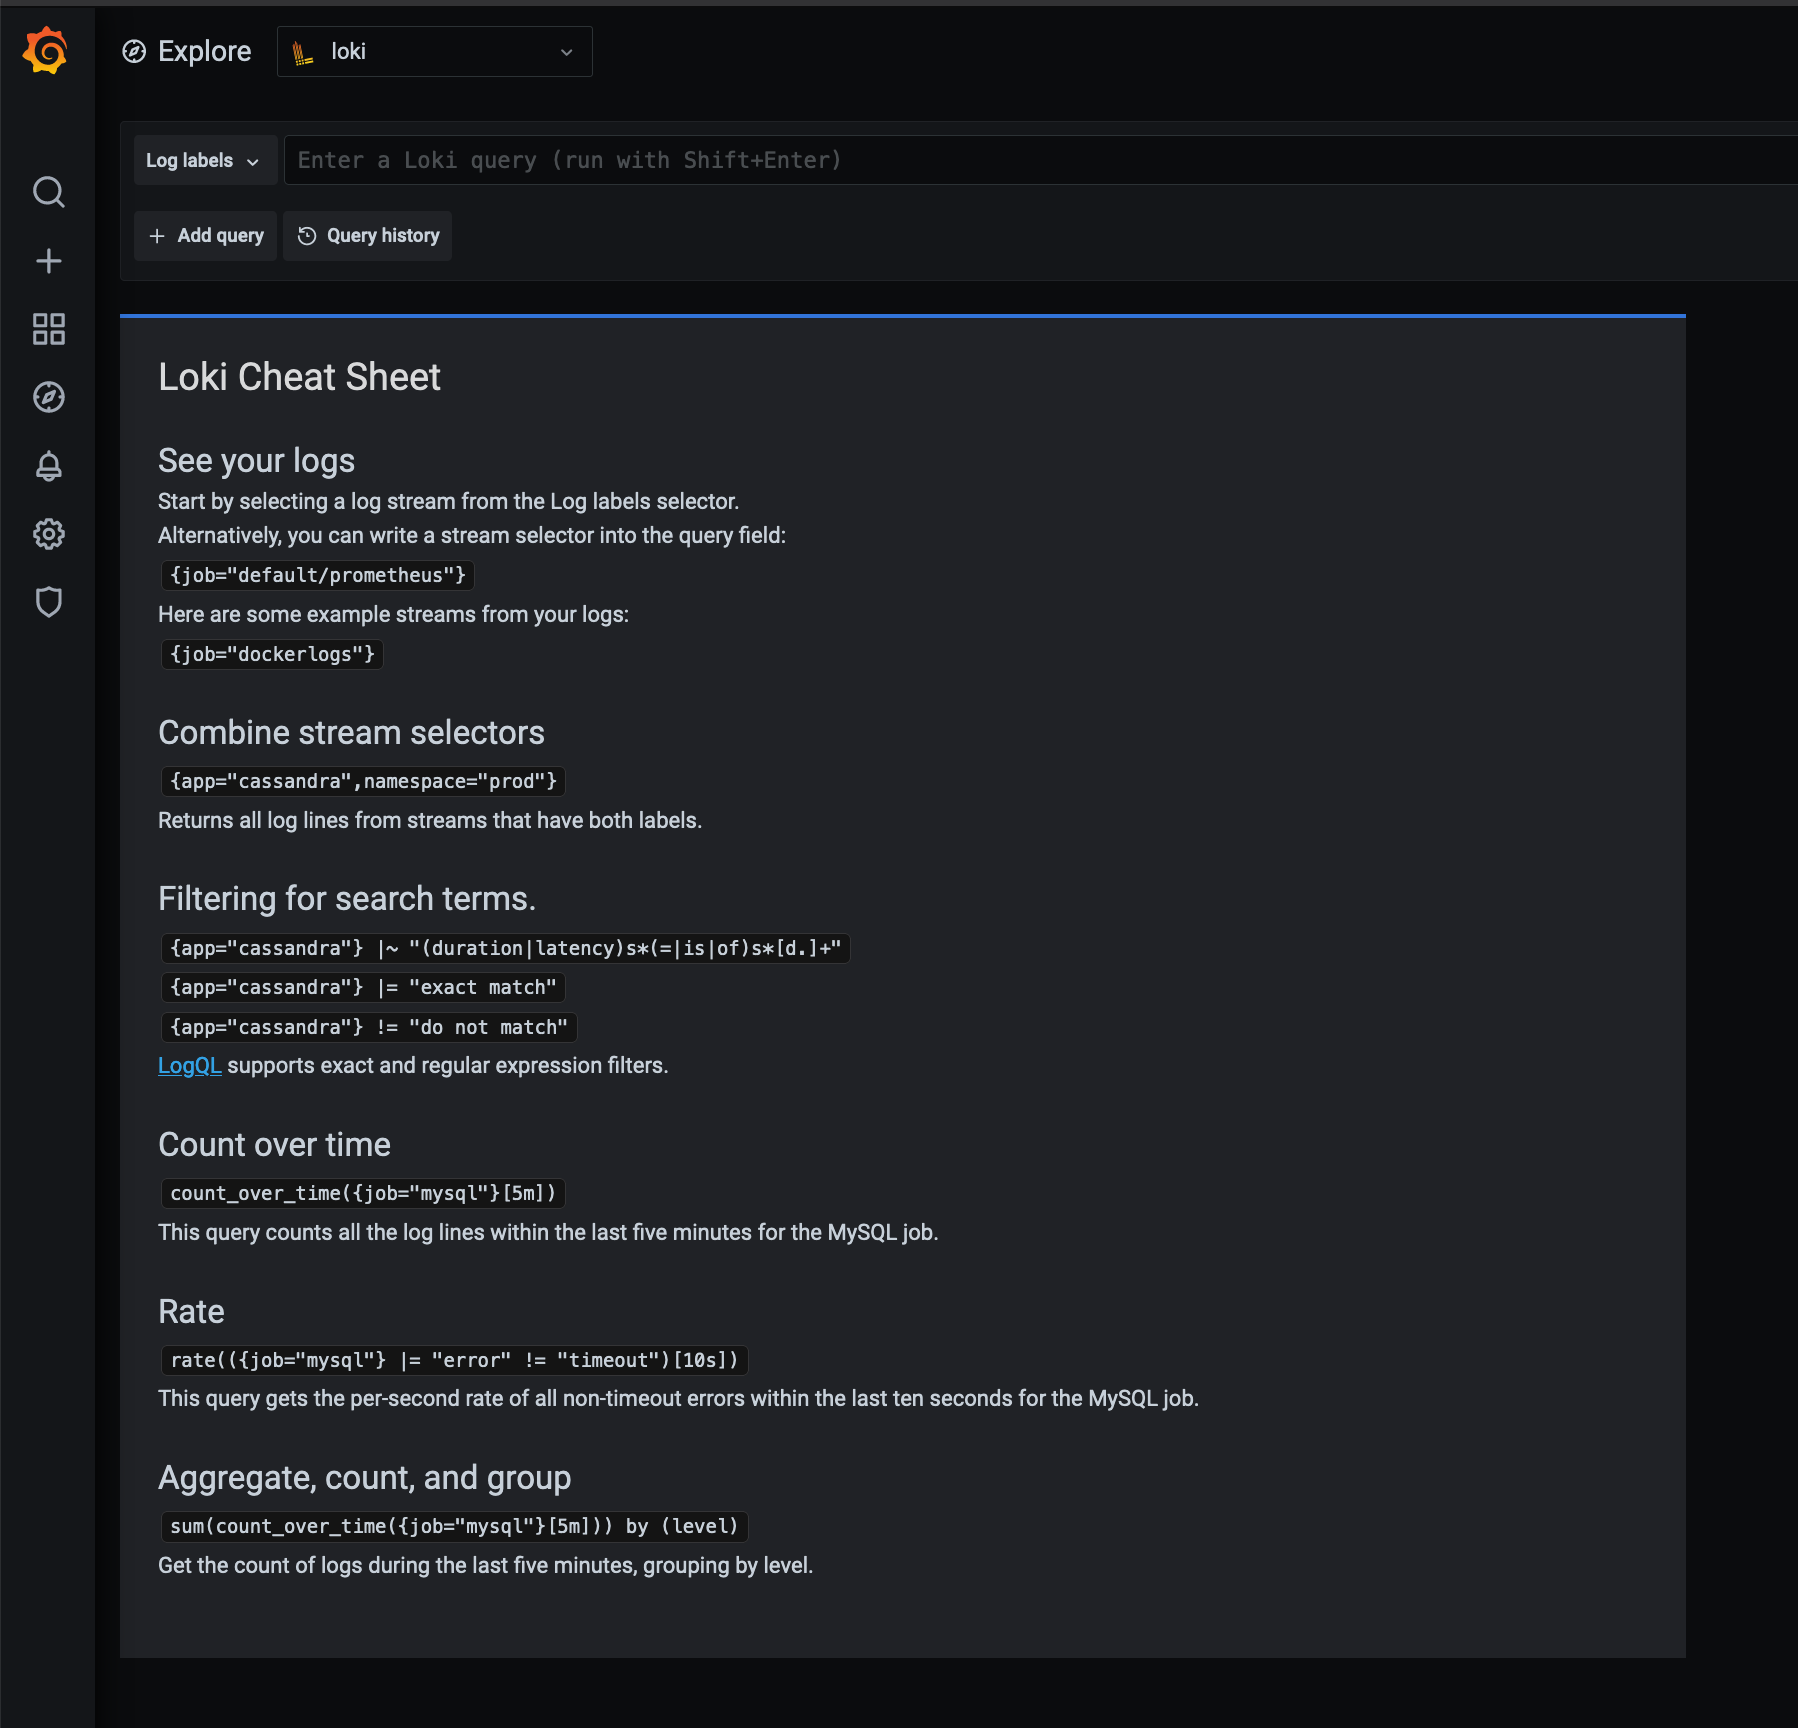
When you head to the left on explore and you select the loki datasource on http://grafana.localdns.xyz:3000/explore you should see the following:
You will see that grafana discovers logstreams with the label job as you can see that our job="dockerlogs" can be seen there. We can either click on it, select the log labels from the left and browse the label we want to select or manually enter the query.
I will be using the query manually:
1
| |
So now we will get all the logs that has that label associated and as you can see, we see our request that we made:
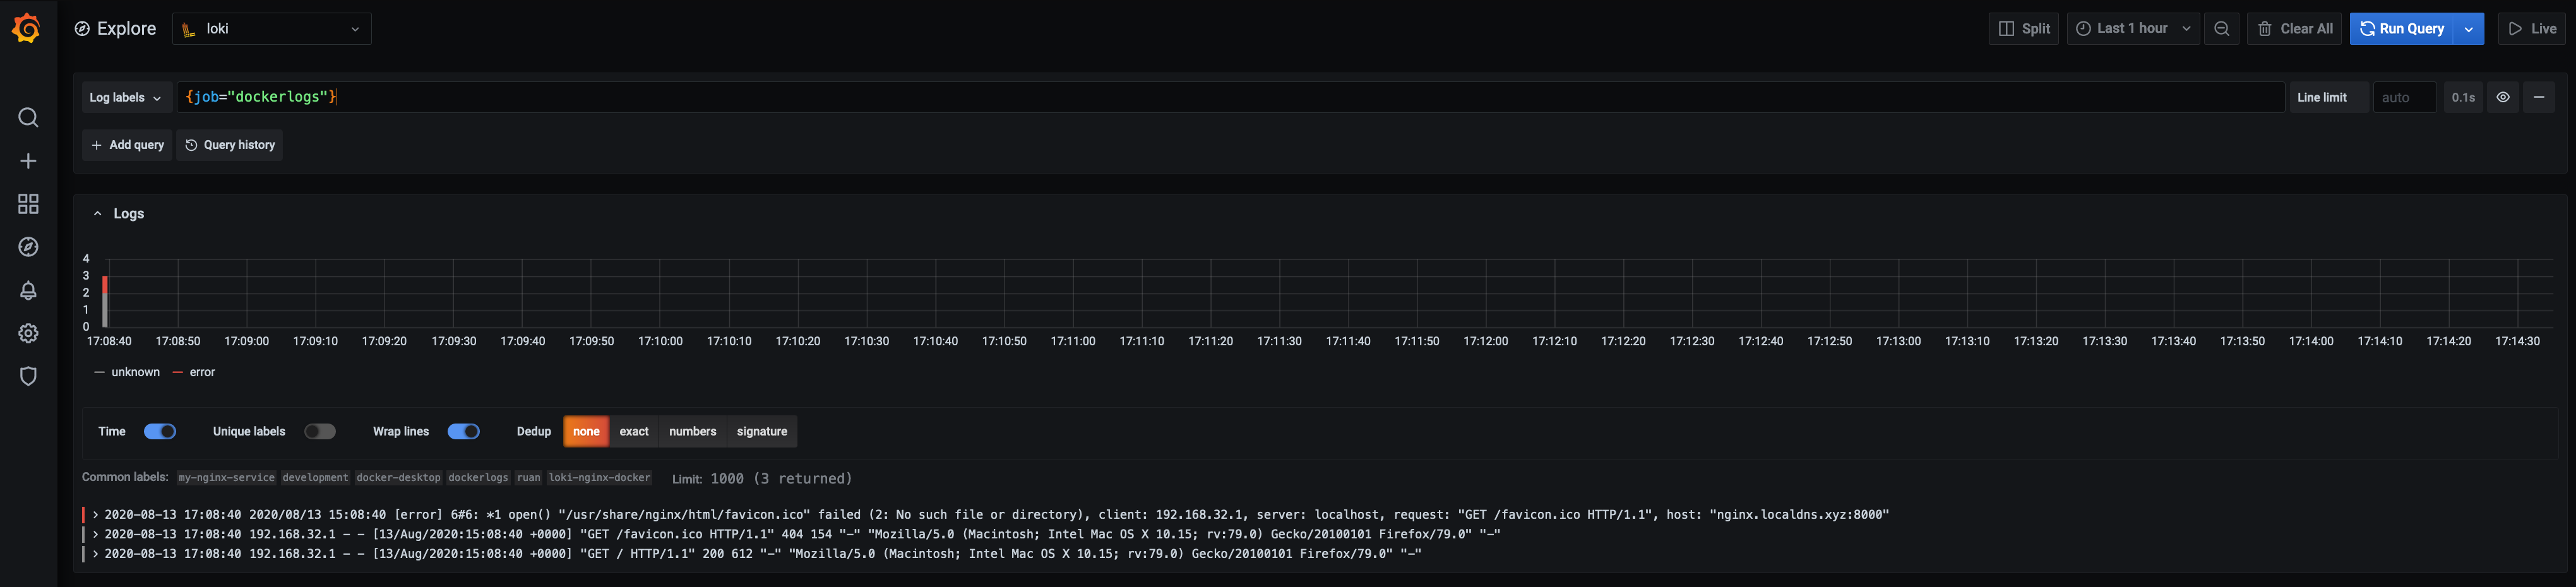
We can see one error due to the favicon.ico that it could not find, but let’s first inspect our first log line:
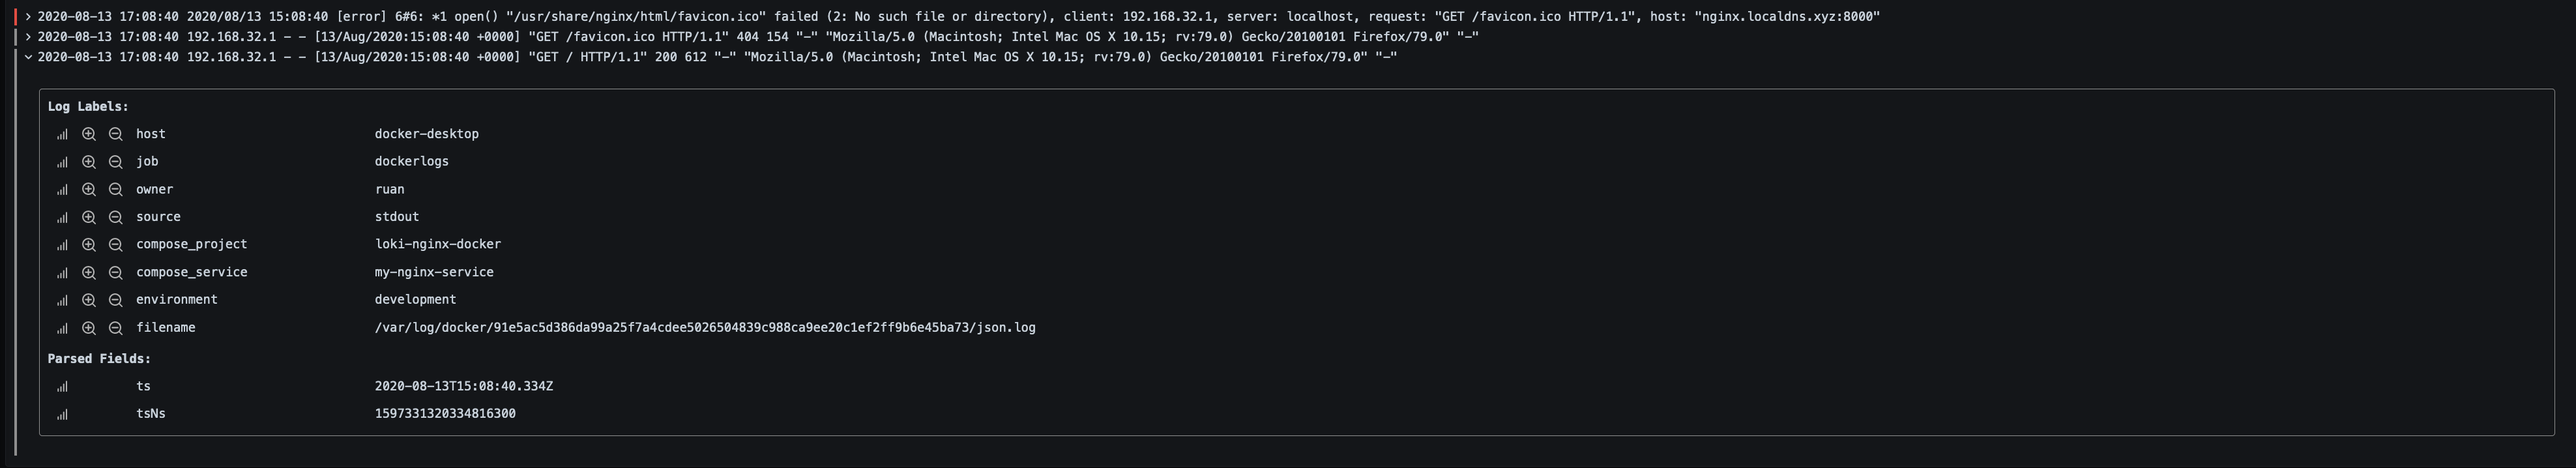
Here we can see the labels assigned to that log event, which we can include in our query, like if we had multiple services and different environments, we can use a query like the following to only see logs for a specific service and environment:
1
| |
In the example above we used the selectors to select the logs we want to see, now we can use our filter expressions, to “grep” our logs.
Let’s say we want to focus only on one service, and we want to filter for any logs with GET requests, so first we select to service then apply the filter expression:
1
| |
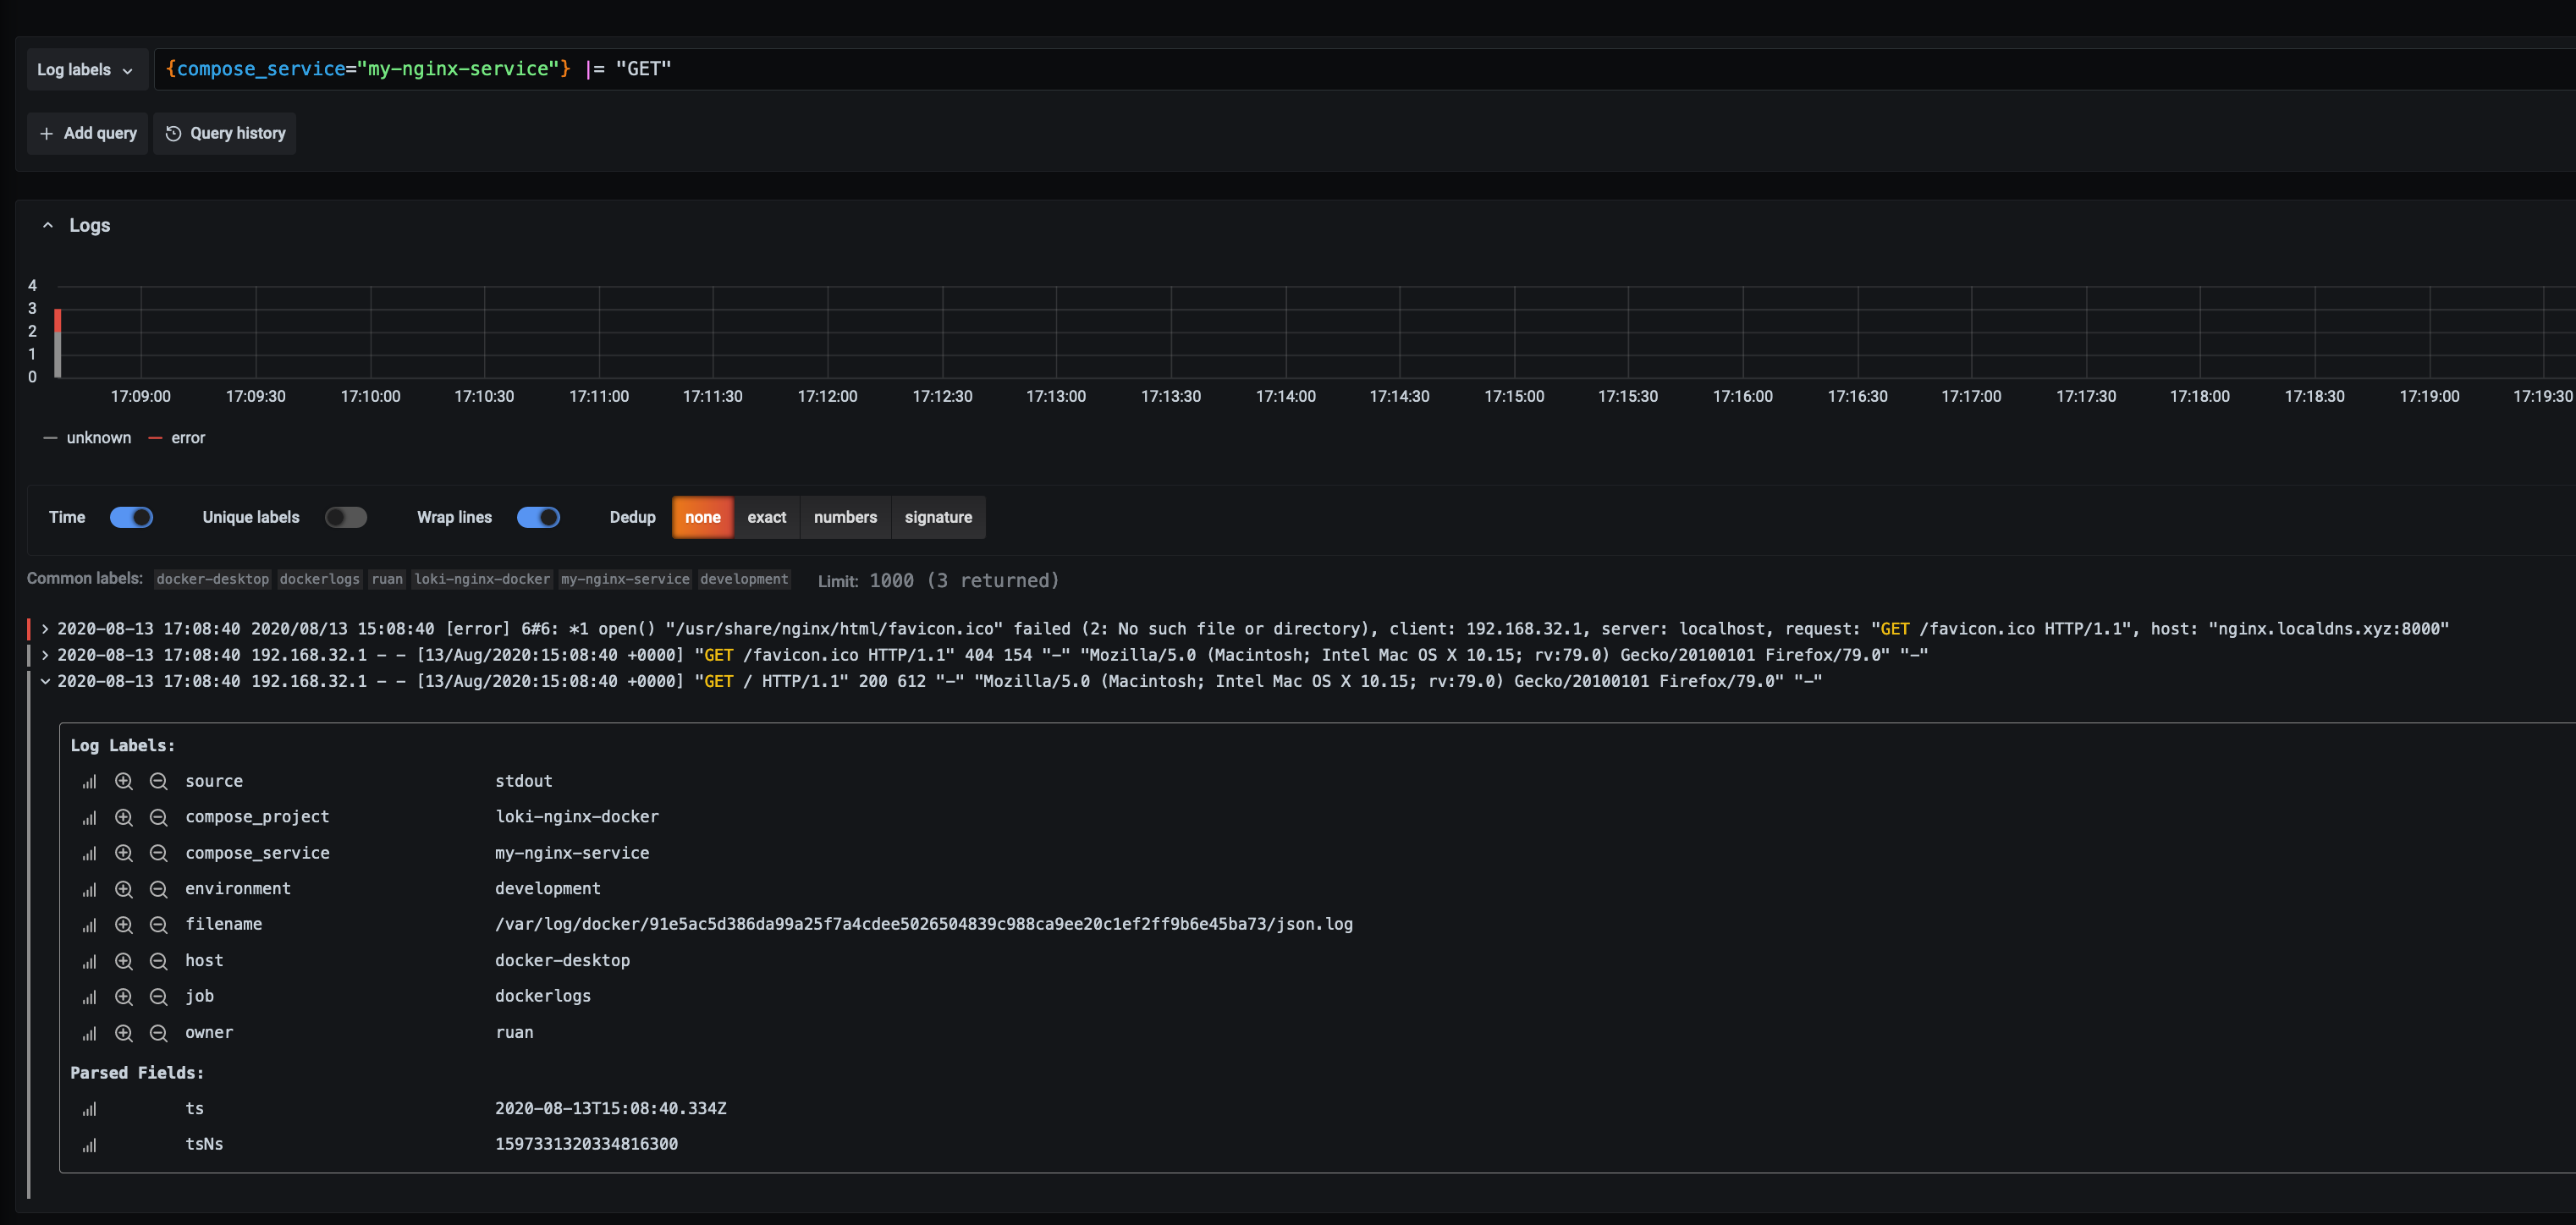
As you can see we can see the ones we were looking for, we can also chain them, so we want to se GET’s and errors:
1
| |
And lets say for some reason we only want to see the logs that comes from a 192.168.32 subnet:
1
| |
But we dont want to see requests from “nginx.localdns.xyz”:
1
| |
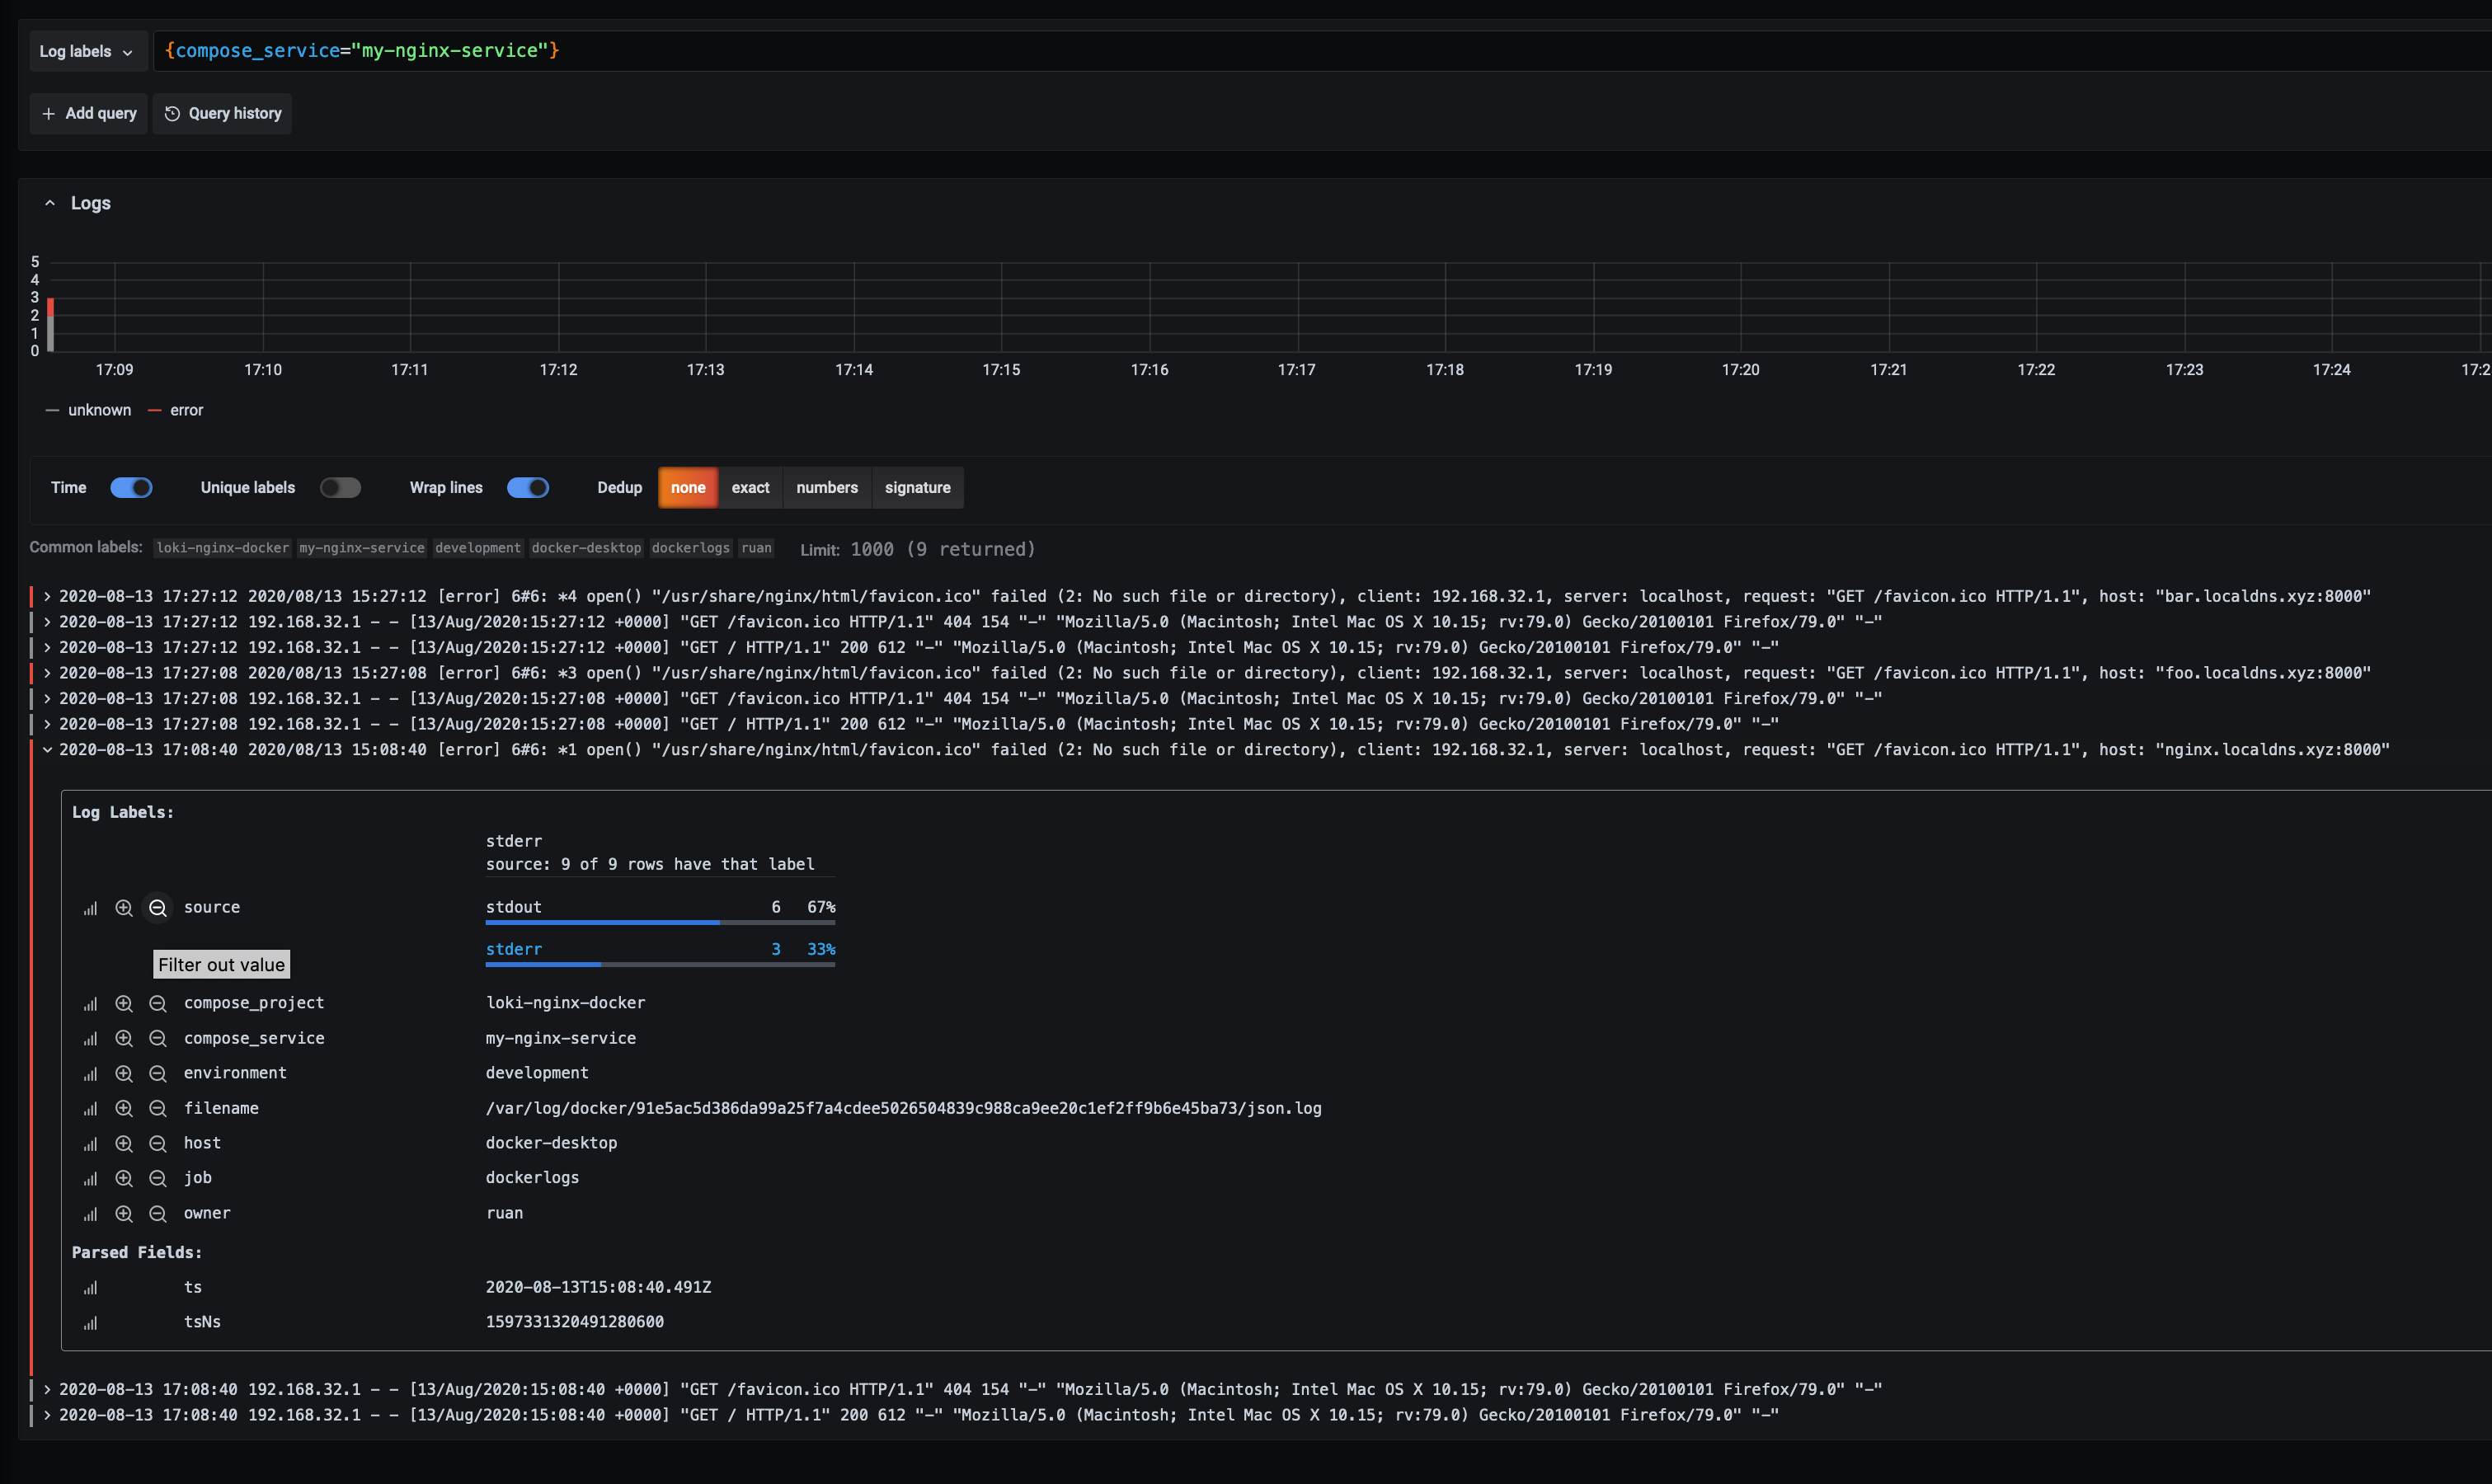
Make two extra get requests to “foo.localdns.xyz:8000” and “bar.localdns.xyz:8000” and then we change the query to say that we only want to see errors and hostnames coming from the 2 requests that we made:
1
| |
If we expand one of the log lines, we can do a ad-hoc analysis to see the percentage of logs by source for example:
LogCLI
If you prefer the cli to query logs, logcli is the command line client for loki, allows you to query logs from your terminal and has clients for linux, mac and windows.
Check the releases for the latest version:
1 2 3 | |
Set your environment details, in our case we dont have a username and password for loki:
1 2 3 | |
We can view all our labels, let’s view all the job labels:
1 2 3 | |
Let’s look at family apps nginx logs:
1 2 3 4 | |
We can also pipe that output to grep, awk, etc:
1
| |
Supported arguments:
1 2 3 4 5 6 7 8 9 10 11 12 13 14 15 16 17 18 19 20 21 22 23 24 25 26 27 28 29 30 31 32 33 34 35 36 37 38 39 40 41 | |
Thank you
I hope this was useful