
So we are pushing our time series metrics into prometheus, and now we would like to alarm based on certain metric dimensions. That’s where alertmanager fits in. We can setup targets and rules, once rules for our targets does not match, we can alarm to destinations suchs as slack, email etc.

What we will be doing:
In our previous tutorial we installed blackbox exporter to probe a endpoint. Now we will install Alertmanager and configure an alert to notify us via email and slack when our endpoint goes down. See this post if you have not seen the previous tutorial.
Install Alertmanager
Create the user for alertmanager:
1
| |
Download alertmanager and extract:
1 2 | |
Move alertmanager and amtool birnaries in place:
1 2 | |
Ensure that the correct permissions are in place:
1 2 | |
Cleanup:
1
| |
Configure Alertmanager:
Create the alertmanager directory and configure the global alertmanager configuration:
1 2 | |
Provide the global config and ensure to populate your personal information. See this post to create a slack webhook.
1 2 3 4 5 6 7 8 9 10 11 12 13 14 15 16 17 18 19 20 21 22 23 24 25 26 | |
Ensure the permissions are in place:
1
| |
Create the alertmanager systemd unit file:
1
| |
And supply the unit file configuration. Note that I am exposing port 9093 directly as Im not using a reverse proxy.
1 2 3 4 5 6 7 8 9 10 11 12 13 14 | |
Now we need to inform prometheus that we will send alerts to alertmanager to it’s exposed port:
1
| |
And supply the alertmanager configuration for prometheus:
1 2 3 4 5 6 7 | |
So when we get alerted, our alert will include a link to our alert. We need to provide the base url of that alert. That get’s done in our alertmanager systemd unit file: /etc/systemd/system/alertmanager.service under --web.external-url passing the alertmanager base ip address:
1 2 3 4 5 6 7 8 9 10 11 12 13 14 | |
Then we need to do the same with the prometheus systemd unit file: /etc/systemd/system/prometheus.service under --web.external-url passing the prometheus base ip address:
1 2 3 4 5 6 7 8 9 10 11 12 13 14 15 16 17 18 | |
Since we have edited the systemd unit files, we need to reload the systemd daemon:
1
| |
Then restart prometheus and alertmanager:
1 2 | |
Inspect the status of alertmanager and prometheus:
1 2 | |
If everything seems good, enable alertmanager on boot:
1
| |
Access Alertmanager:
Access alertmanager on your endpoint on port 9093:
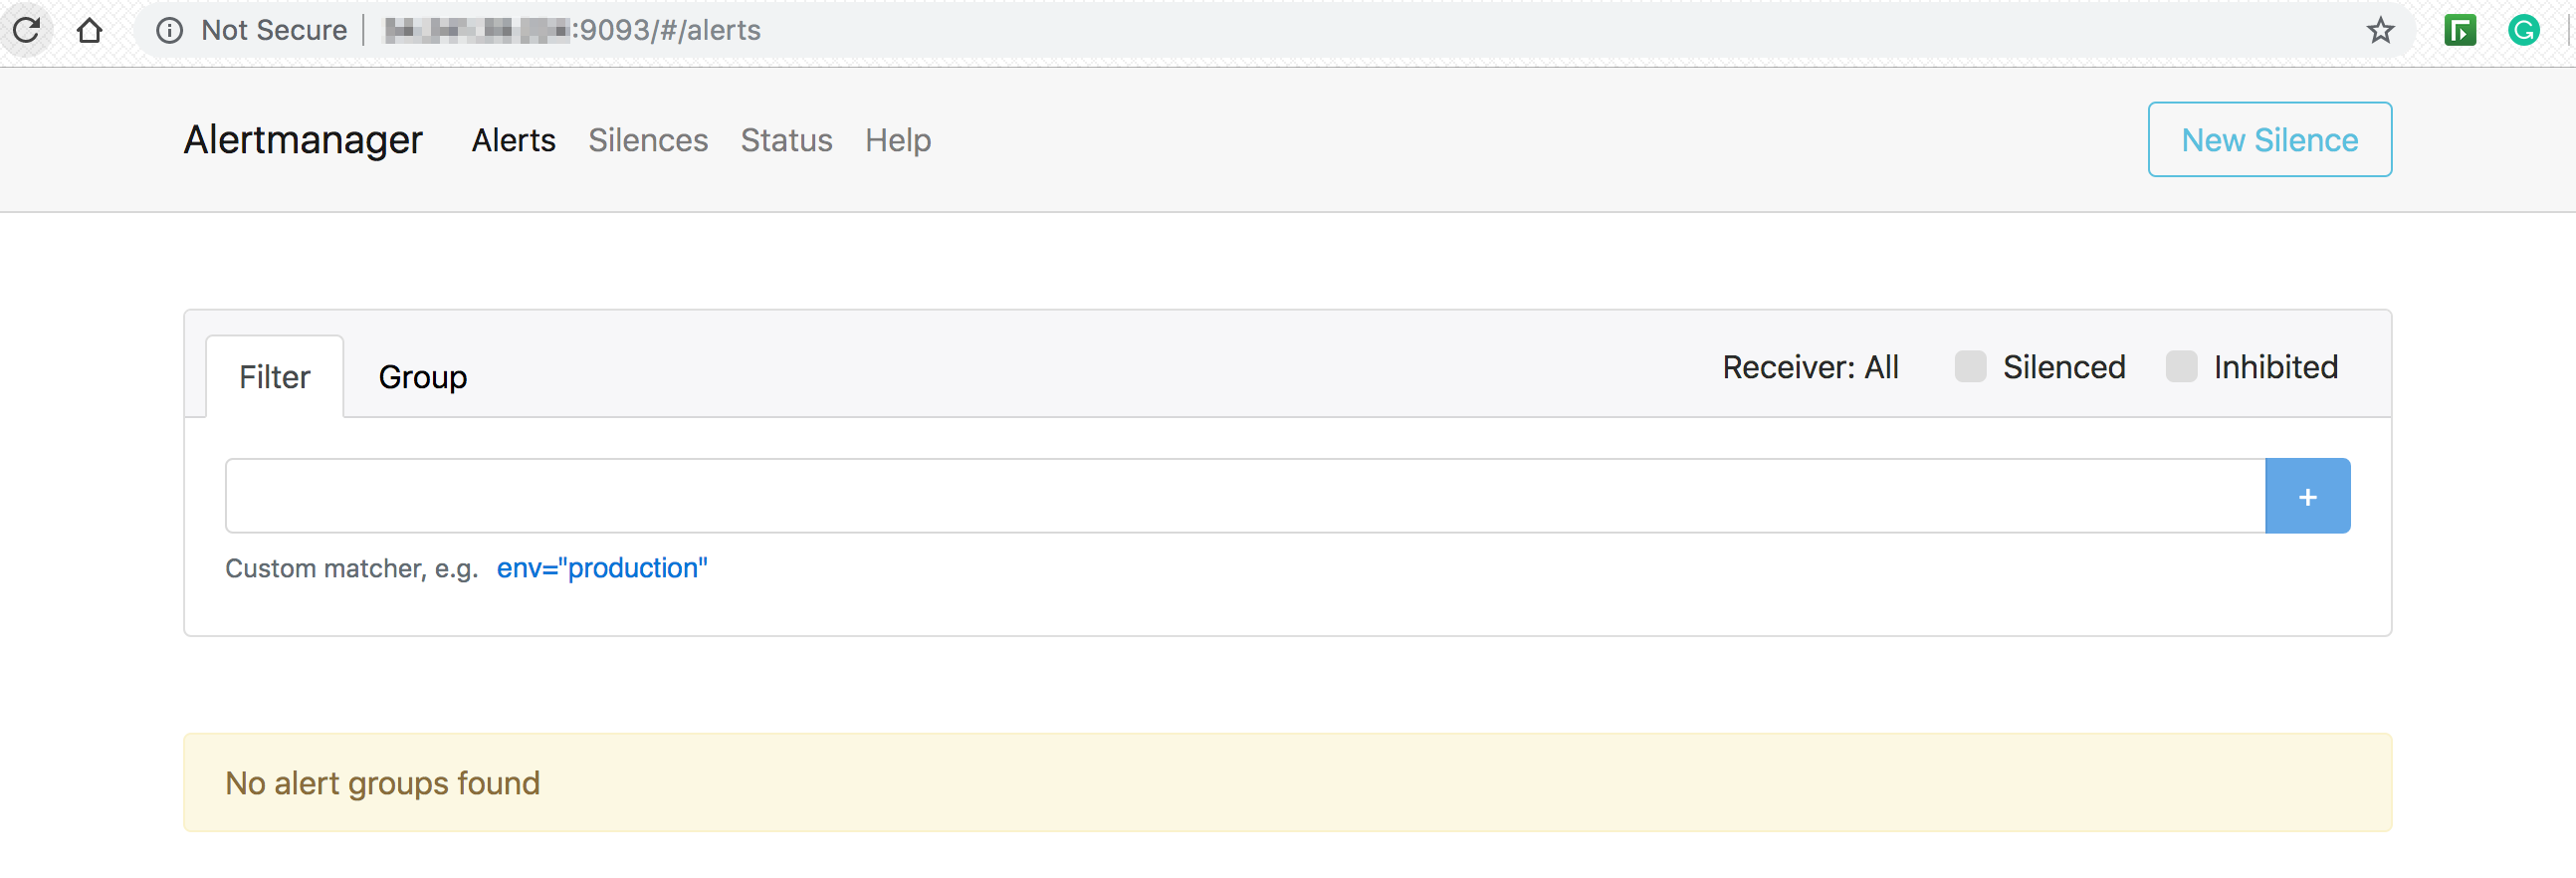
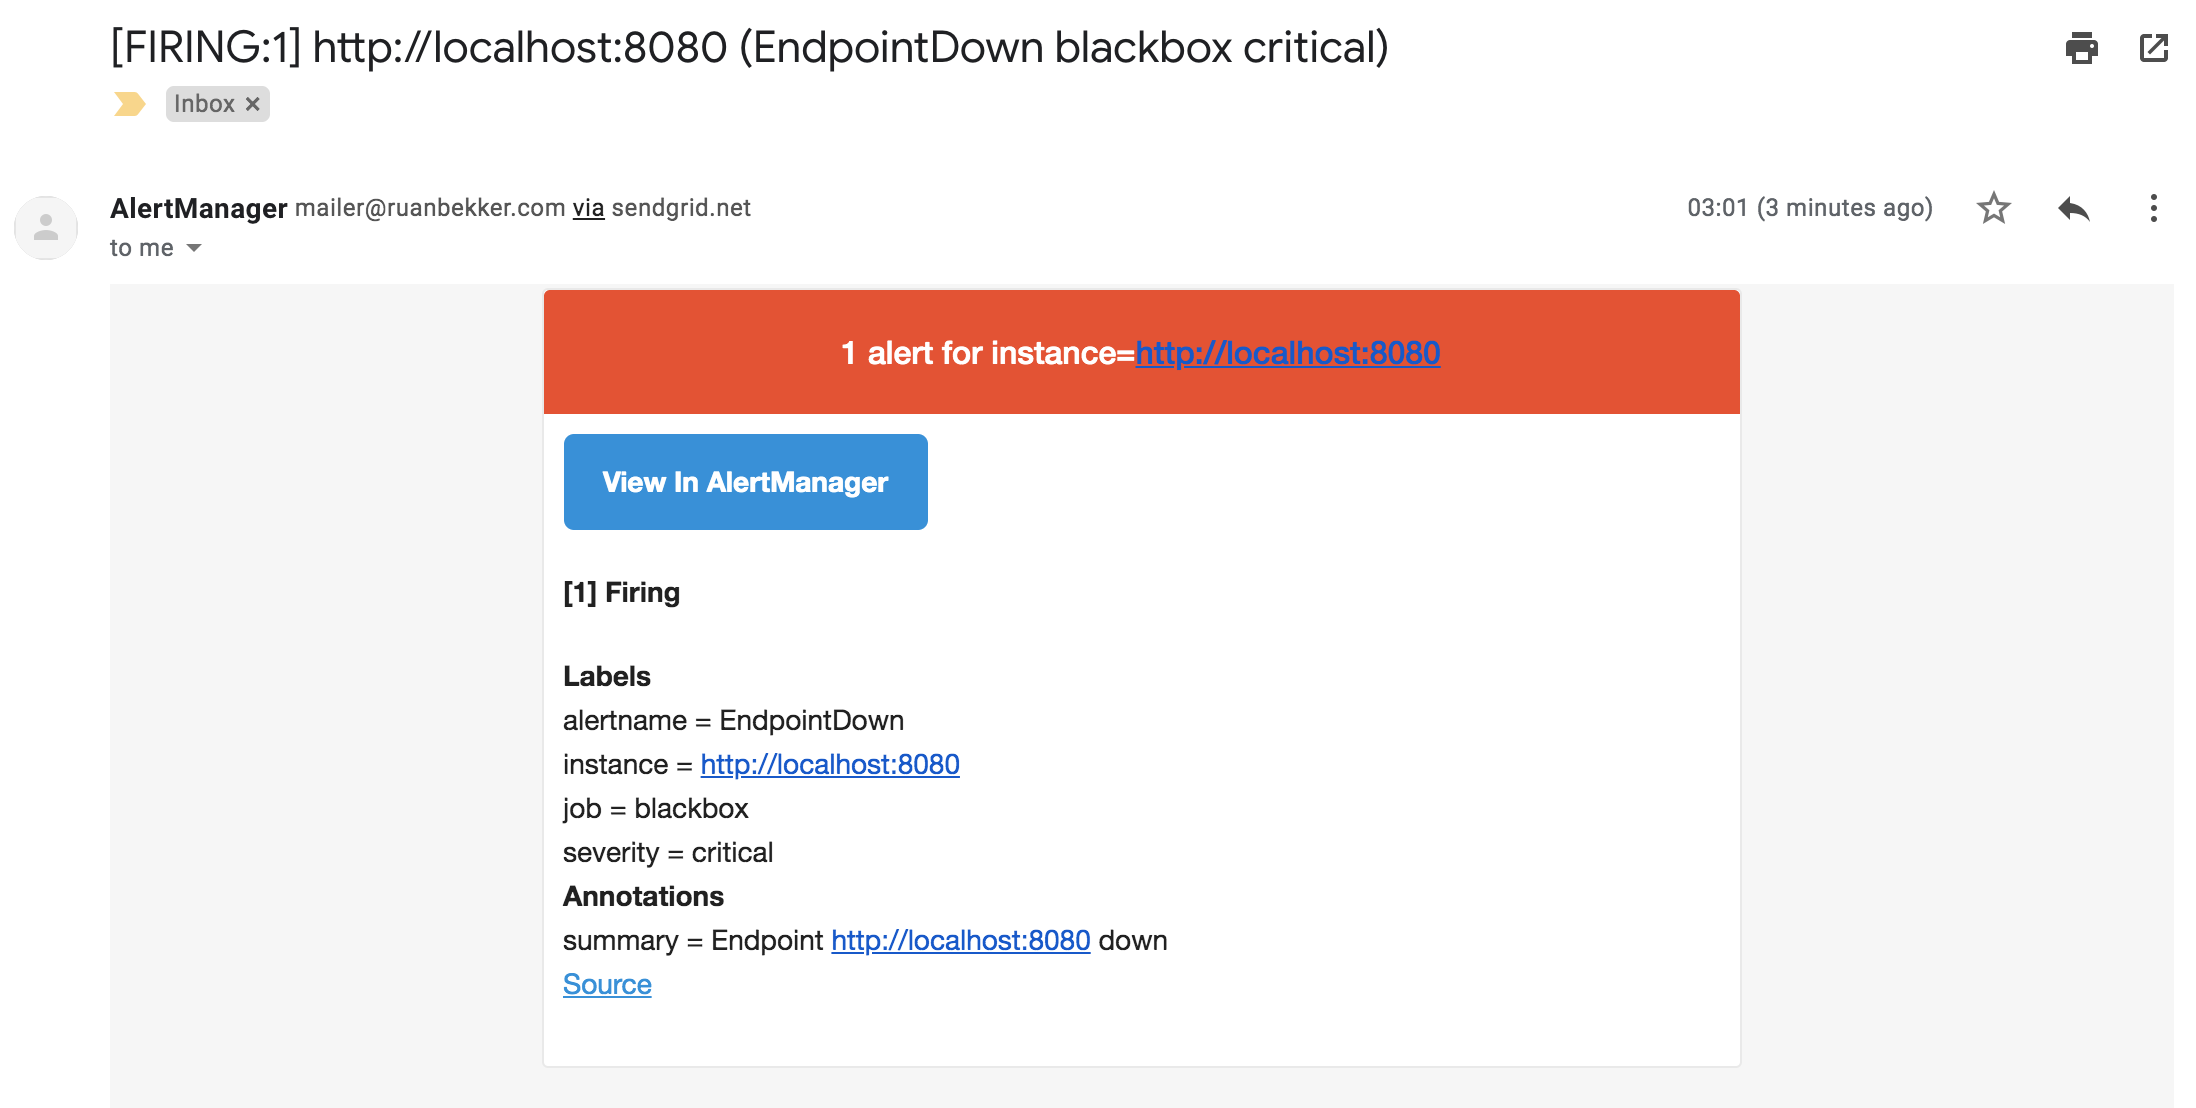
From our previous tutorial we started a local web service on port 8080 that is being monitored by prometheus. Let’s stop that service to test out the alerting. You should get a notification via email:
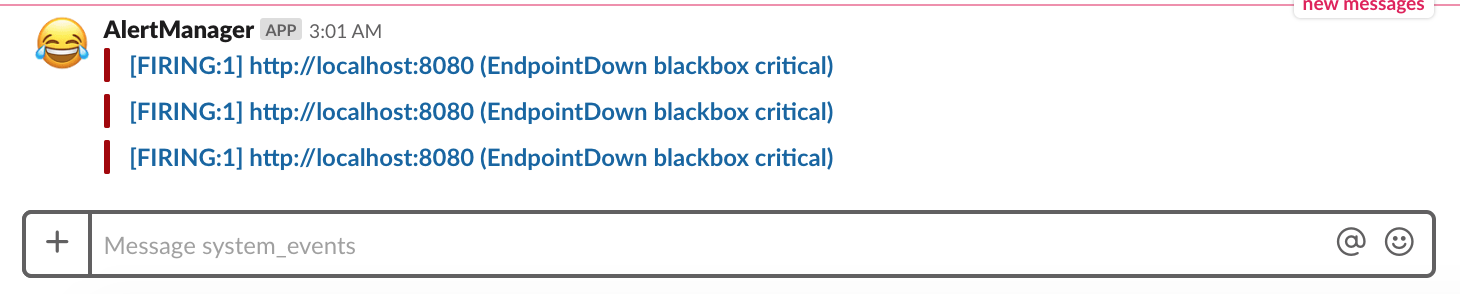
And the notification via slack:
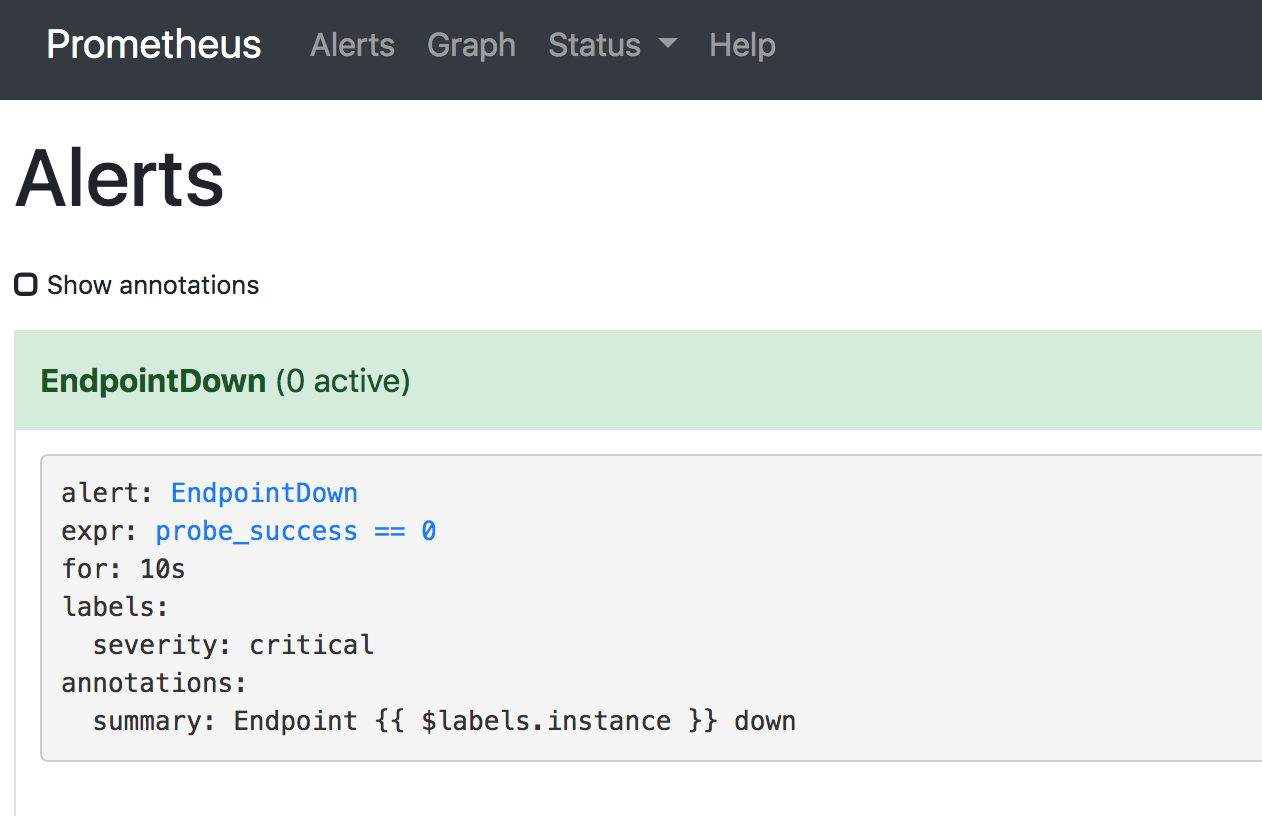
When you start the service again and head over to the prometheus ui under alerts, you will see that the service recovered:
Install Prometheus Alertmanager Plugin
Install the Prometheus Alertmanager Plugin in Grafana. Head to the instance where grafana is installed and install the plugin:
1
| |
Once the plugin is installed, restart grafana:
1
| |
Install the dasboard grafana.com/dashboards/8010. Create a new datasource, select the prometheus-alertmanager datasource, configure and save.
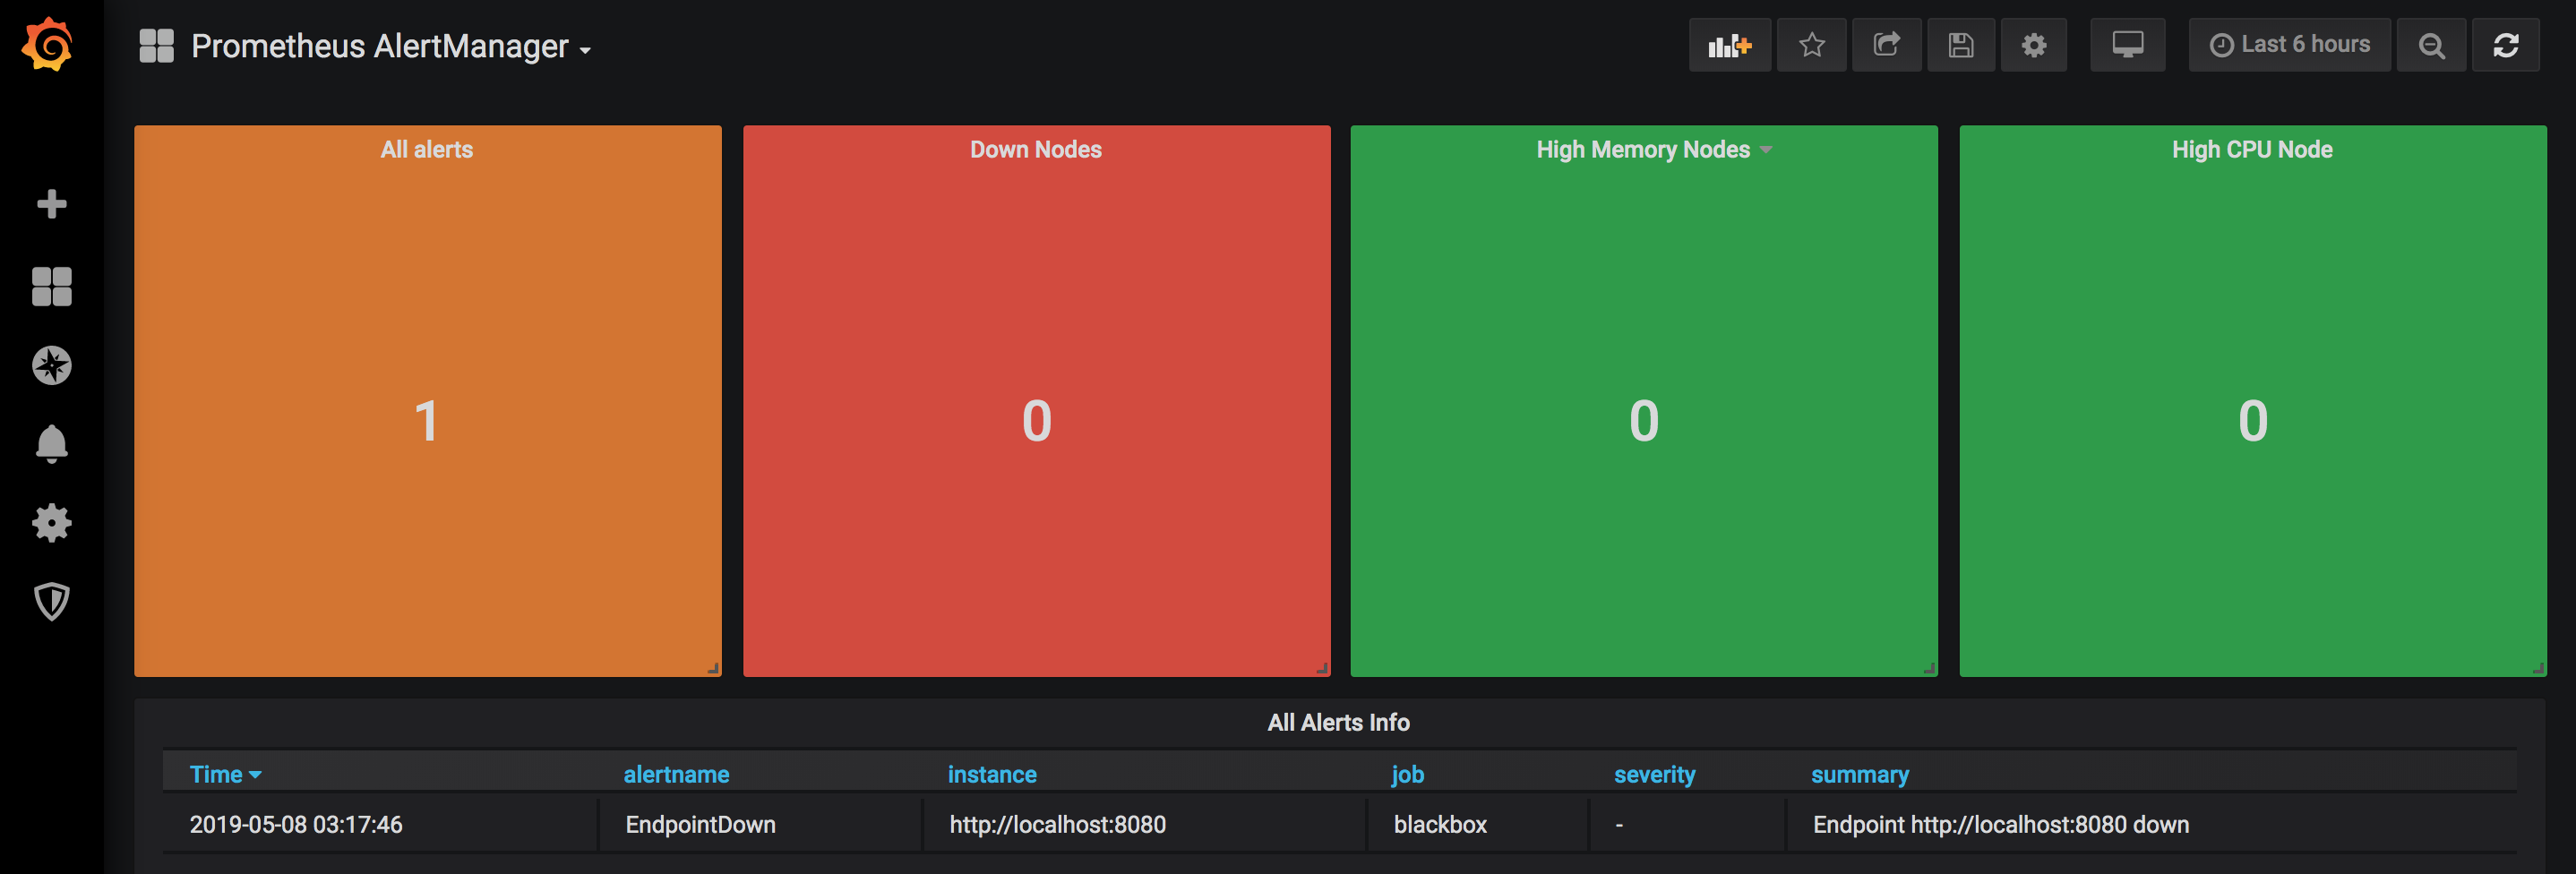
Add a new dasboard, select import and provide the ID 8010, select the prometheus-alertmanager datasource and save. You should see the following (more or less):
Resources
See all #prometheus blogposts