
Filebeat by Elastic is a lightweight log shipper, that ships your logs to Elastic products such as Elasticsearch and Logstash. Filbeat monitors the logfiles from the given configuration and ships the to the locations that is specified.
Filebeat Overview
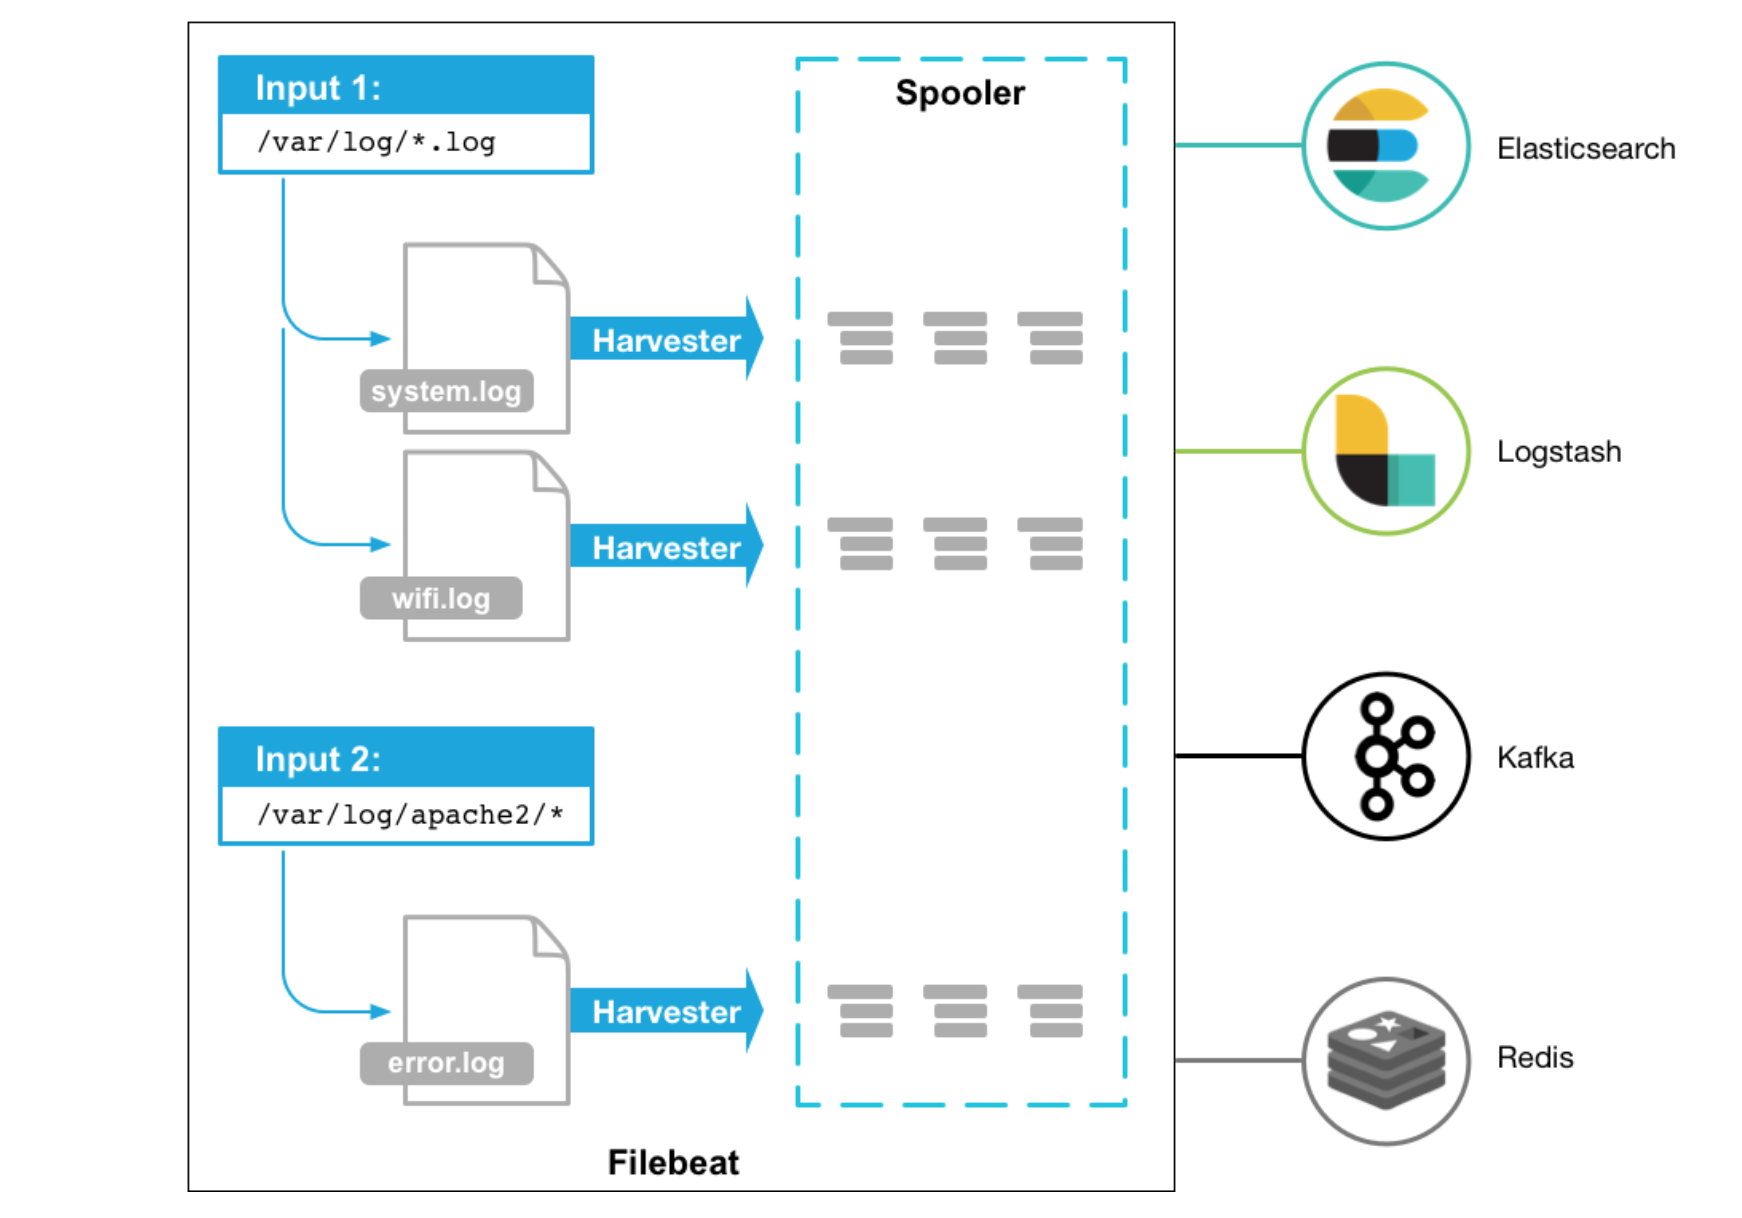
Filebeat runs as agents, monitors your logs and ships them in response of events, or whenever the logfile receives data.
Below is a overview (credit: elastic.co) how Filebeat works
Installing Filebeat
Let’s go ahead and install Filebeat. I will be using version 6.7 as that will be the same version that I am running on my Elasticsearch. To check the version of your elasticsearch cluster:
1
| |
Install the dependencies:
1
| |
Get the public signing key:
1
| |
Get the repository definition:
1
| |
Update the repositories:
1
| |
Install Filebeat and enable the service on boot:
1 2 | |
Configure Filebeat
Let’s configure our main configuration in filebeat, to specify our location where the data should be shipped to (in this case elasticsearch) and I will also like to set some extra fields that will apply to this specific server.
Open up /etc/filebeat/filebeat.yml and edit the following:
1 2 3 4 5 6 7 8 9 10 11 12 13 14 15 16 17 18 19 20 21 22 23 24 25 26 27 28 29 | |
Above, just setting my path to nginx access logs, some extra fields, including that it shoulds seed kibana with example visualizations and the output configuration of elasticsearch.
Filebeat Modules
Filebeat comes with modules that has context on specific applications like nginx, mysql etc. Lets enable system (syslog, auth, etc) and nginx for our web server:
1 2 | |
Example of my /etc/filebeat/modules.d/system.yml configuration:
1 2 3 4 5 6 7 8 | |
Example of my /etc/filebeat/modules.d/nginx.yml configuration:
1 2 3 4 5 6 7 8 | |
Now setup the templates
1
| |
Then restart filebeat:
1
| |
You can have a look at the logs, should you need to debug:
1
| |
Your data should now be shipped to elasticsearch, by default under the filebeat-YYYY.mm.dd index pattern.
1 2 3 | |
Kibana
You can head over to Kibana at http://localhost:5601 (in this case) to visualize the data that is ingested into your filebeat index. I will write a tutorial on how to graph up most common dashboards later this week.
Thats it for now :D