Ruan Bekker's Blog

From a Curious mind to Posts on Github

Graphing Pretty Charts With Python Flask and Chartjs

image

I am a big sucker for Charts and Graphs, and today I found one awesome library called Chart.js, which we will use with Python Flask Web Framework, to graph our data.

As Bitcoin is doing so well, I decided to graph the monthly Bitcoin price from January up until now.

ruanbekker-cheatsheets

Dependencies:

Install Flask:

1
$ pip install flask

Create the files and directories:

1
2
$ touch app.py
$ mkdir templates

We need the Chart.js library, but I will use the CDN version, in my html.

Creating the Flask App:

Our data that we want to graph will be hard-coded in our application, but there are many ways to make this more dynamic, in your app.py:

1
2
3
4
5
6
7
8
9
10
11
12
13
14
15
16
17
18
19
20
21
22
23
24
25
26
27
28
29
30
31
32
33
34
35
36
37
38
39
40
41
from flask import Flask, Markup, render_template

app = Flask(__name__)

labels = [
    'JAN', 'FEB', 'MAR', 'APR',
    'MAY', 'JUN', 'JUL', 'AUG',
    'SEP', 'OCT', 'NOV', 'DEC'
]

values = [
    967.67, 1190.89, 1079.75, 1349.19,
    2328.91, 2504.28, 2873.83, 4764.87,
    4349.29, 6458.30, 9907, 16297
]

colors = [
    "#F7464A", "#46BFBD", "#FDB45C", "#FEDCBA",
    "#ABCDEF", "#DDDDDD", "#ABCABC", "#4169E1",
    "#C71585", "#FF4500", "#FEDCBA", "#46BFBD"]

@app.route('/bar')
def bar():
    bar_labels=labels
    bar_values=values
    return render_template('bar_chart.html', title='Bitcoin Monthly Price in USD', max=17000, labels=bar_labels, values=bar_values)

@app.route('/line')
def line():
    line_labels=labels
    line_values=values
    return render_template('line_chart.html', title='Bitcoin Monthly Price in USD', max=17000, labels=line_labels, values=line_values)

@app.route('/pie')
def pie():
    pie_labels = labels
    pie_values = values
    return render_template('pie_chart.html', title='Bitcoin Monthly Price in USD', max=17000, set=zip(values, labels, colors))

if __name__ == '__main__':
    app.run(host='0.0.0.0', port=8080)

Populating the HTML Static Content:

As we are using render_template we need to populate our html files in our templates/ directory. As you can see we have 3 different html files:

  • templates/bar_chart.html :
  • templates/line_chart.html:
  • templates/pie_chart.html:

Running our Application:

As you can see, we have 3 endpoints, each representing a different chart style:

  • /line
  • /bar
  • /pie

Let’s start our flask application:

1
$ python app.py

When we access our /line endpoint:

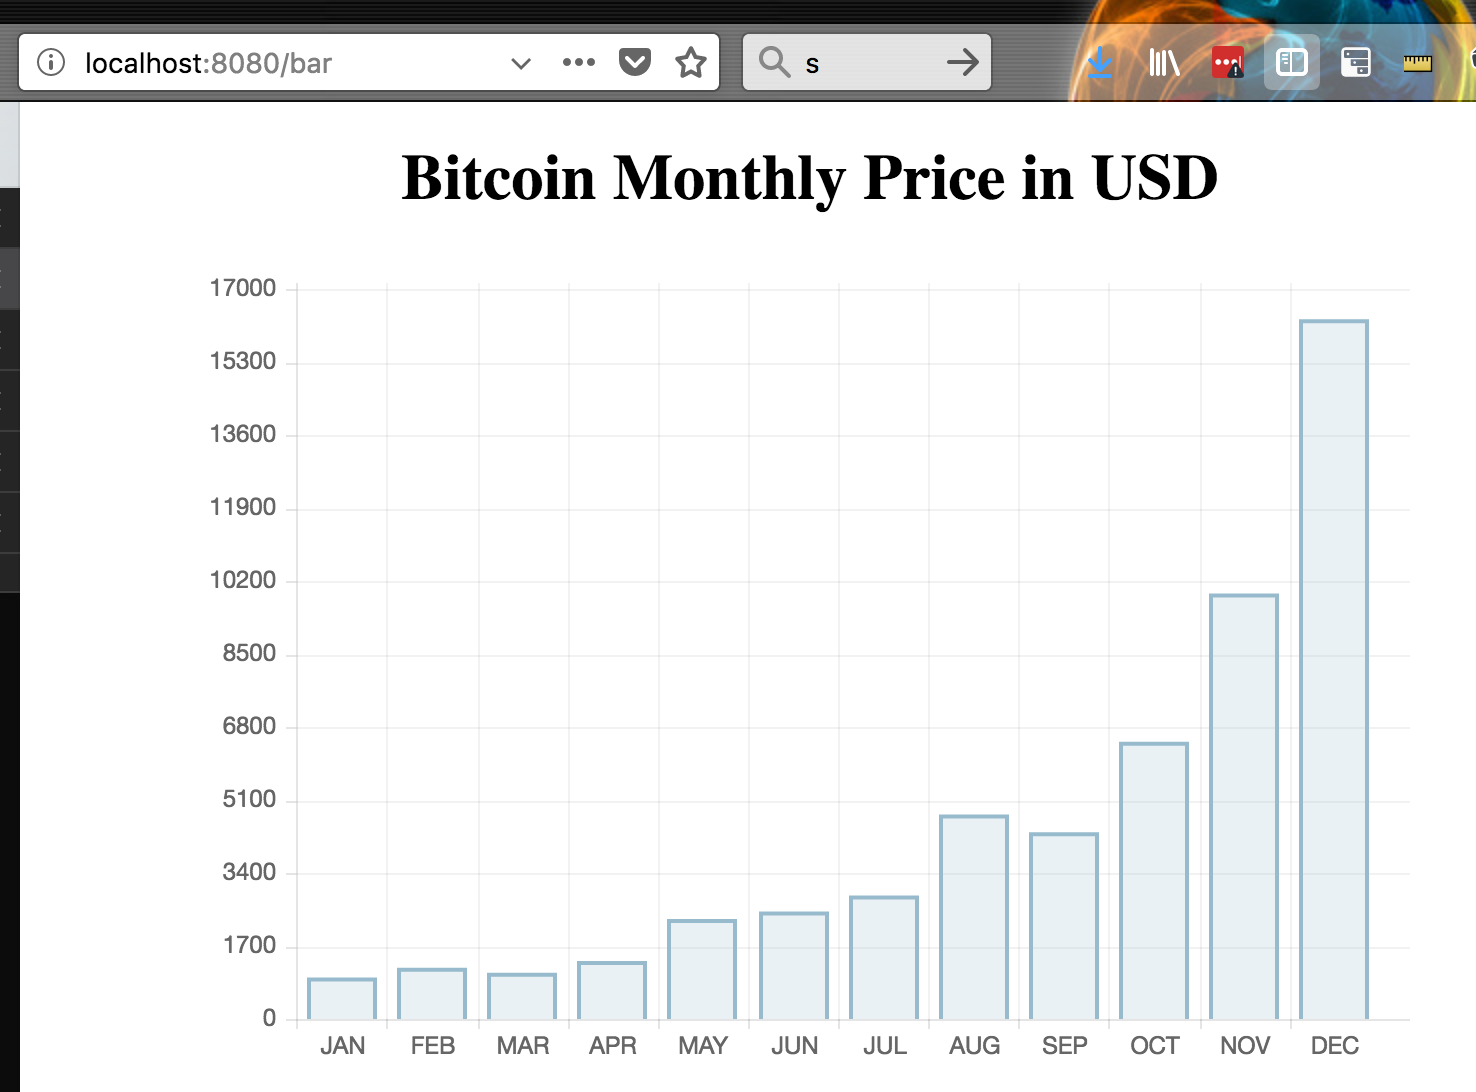
When we access our /bar endpoint:

When we access our /pie endpoint:

Resources: