In this tutorial I will demonstrate how to setup cross account access from S3.
Scenario
We will have 2 AWS Accounts:
a Green AWS Account which will host the IAM Users, this account will only be used for our IAM Accounts.
a Blue AWS Account which will be the account that hosts our AWS Resources, S3 in this scenario.
We will the allow the Green Account to access the Blue Account’s S3 Bucket.
Setup the Blue Account
In the Blue Account, we will setup the S3 Bucket, as well as the Trust Relationship with the Policy, which is where we will define what we want to allow for the Green Account.
Now we need to setup the IAM Role which will allow the Green Account and also define what needs to be allowed.
Go ahead to your IAM Console and create a IAM Policy (just remember to replace the bucket name if you are following along)
In my case I have named my IAM Policy CrossAccountS3Access. After you have created your IAM Policy, go ahead and create a IAM Role. Here we need the source account that we want to allow as a trusted entity, which will be the AWS AccountId of the Green Account:
Associate the IAM Policy that you created earlier:
After you have done that, you should see a summary screen:
Make note of your IAM Role ARN, it will look something like this: arn:aws:iam::xxxxxxxxxxxx:role/CrossAccountS3Access-Role
Setup the Green Account
In the Green Account is where we will create the IAM User and the credentials will be provided to the user which requires to access the S3 Bucket.
Let’s create a IAM Group, I will name mine prod-s3-users. I will just create the group, as I will attach the policy later:
From the IAM Group, select the Permissions tab and create a New Inline Policy:
Select the “STS” service, select the “AssumeRole” action, and provide the Role ARN of the Blue Account that we created earlier:
This will allow the Blue account to assume the credentials from the Green account. And the Blue account will only obtain permissions to access the resources that we have defined in the policy document of the Blue Account. In summary, it should look like this:
Select the Users tab on the left hand side, create a New IAM User (I will name mine s3-prod-user) and select the “Programmatic Access” check box as we need API keys as we will be using the CLI to access S3:
Then from the next window, add the user to the group that we have created earlier:
Test Cross Account Access
Let’s configure our AWS CLI with the API Keys that we received. Our credential provider will consist with 2 profiles, the Green Profile which holds the API Keys of the Green Account:
12345
$ aws configure --profile green
AWS Access Key ID [None]: AKIATPRT2G4SAHA7ZQU2
AWS Secret Access Key [None]: x
Default region name [None]: eu-west-1
Default output format [None]: json
And configure the Blue profile that will reference the Green account as a source profile and also specify the IAM Role ARN of the Blue Account:
In this tutorial I will demonstrate how to create a VPC Peering Connection between Two AWS Accounts and how to route traffic between them and then show you how we create Two EC2 Instances and demonstrate how to SSH to each other via it’s Private IP Address.
Scenario Information
We will have Two AWS Accounts in this demonstration, a “Green AWS Account” and a “Blue AWS Account”.
In this scenario, we will have two teams, both teams manage their own account and in this scenario the two teams need to be able to communicate to each other. To keep it simple, each team has a EC2 instance and the two EC2 instances need to be able to communicate with each other.
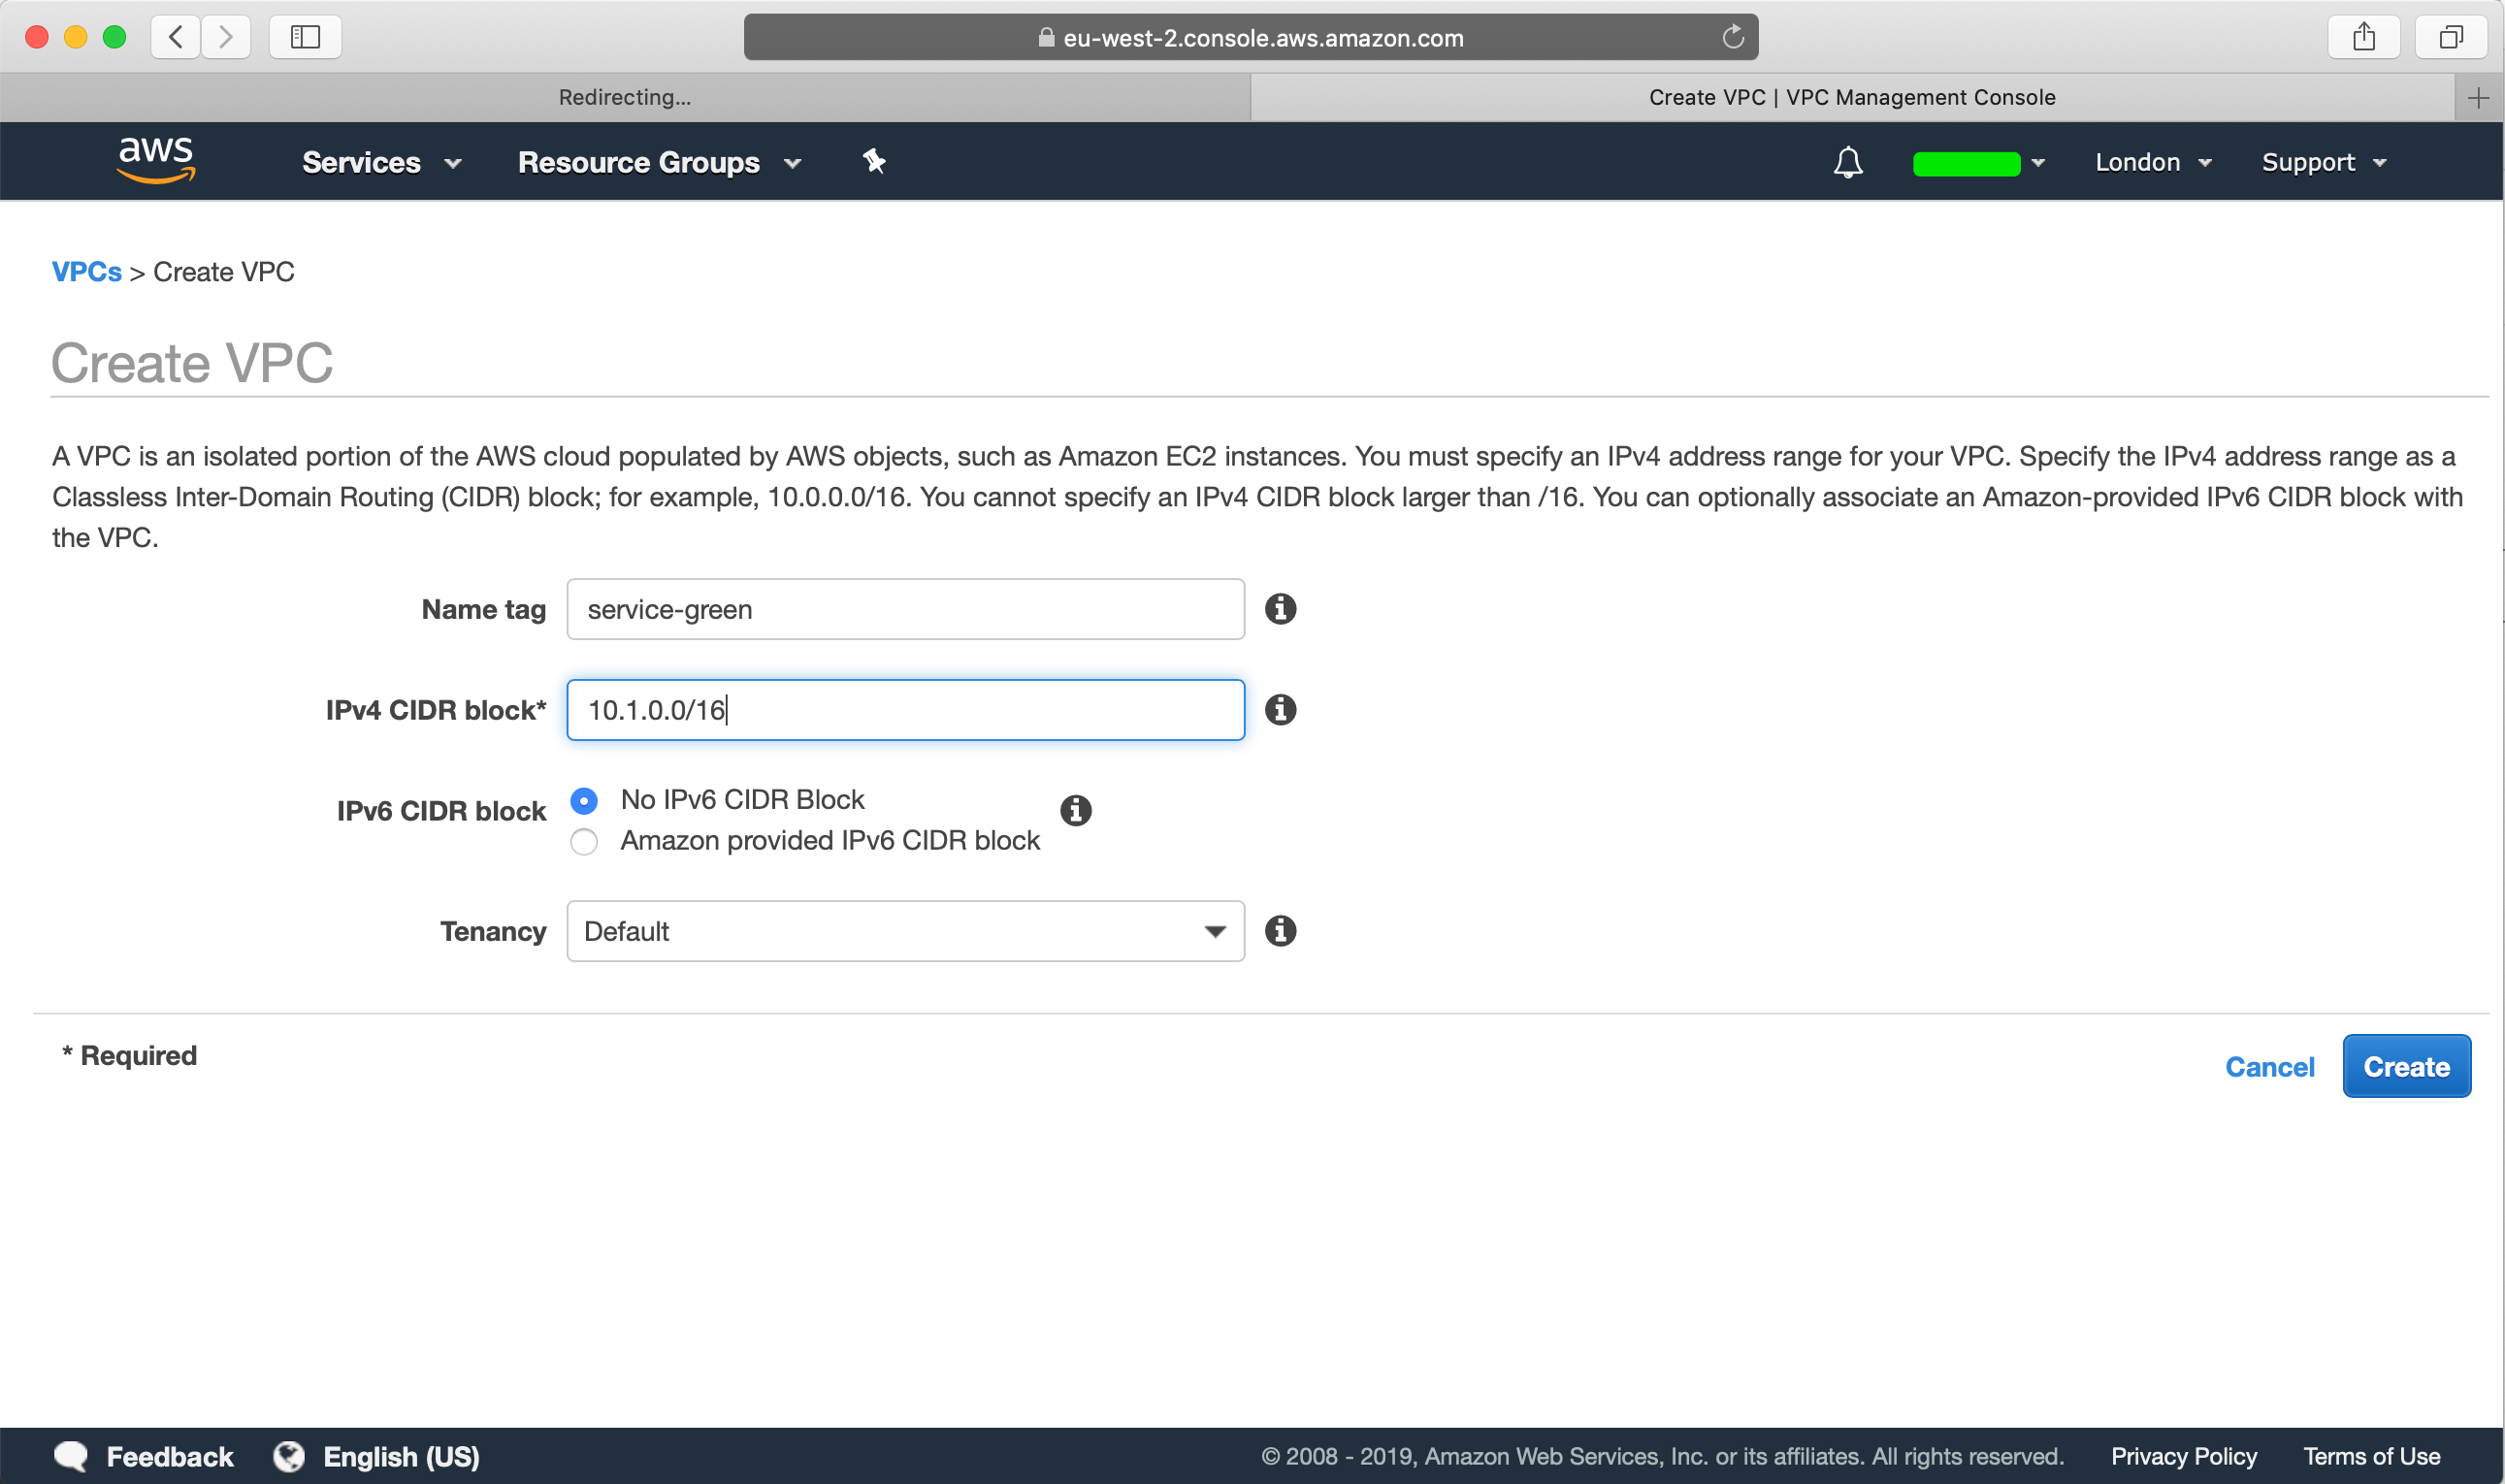
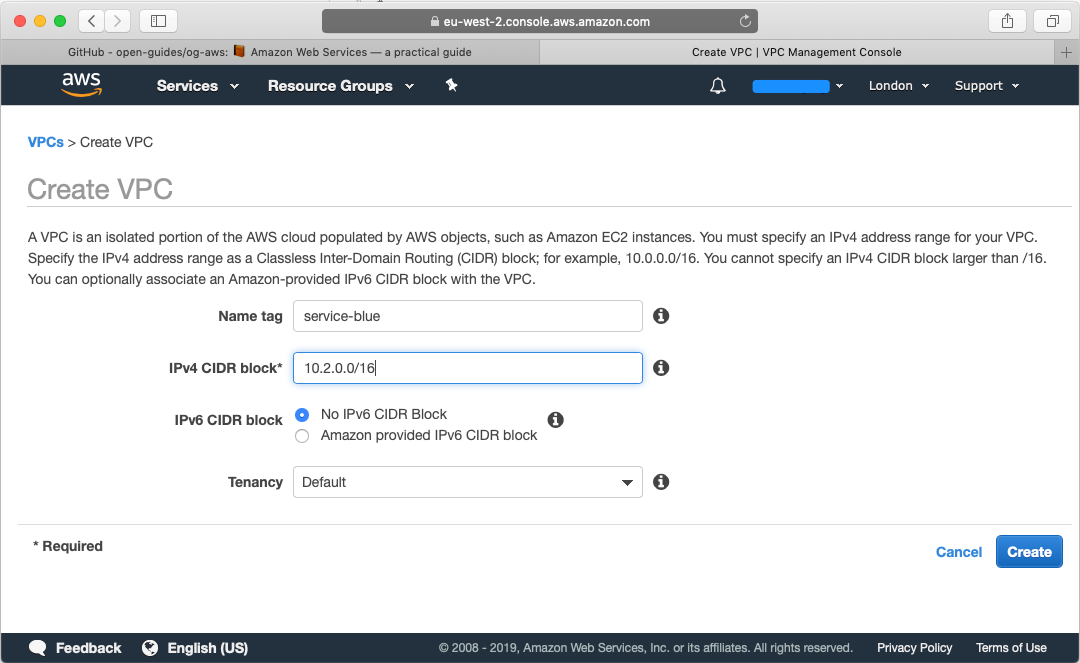
Therefore we will setup a VPC Peering Connection between the two accounts. Both accounts will be operating in the eu-west-2 (London) region.
Now we need to create subnets for the VPC’s that we created. We will create the following subnets in our VPC, each subnet in its own availability zone:
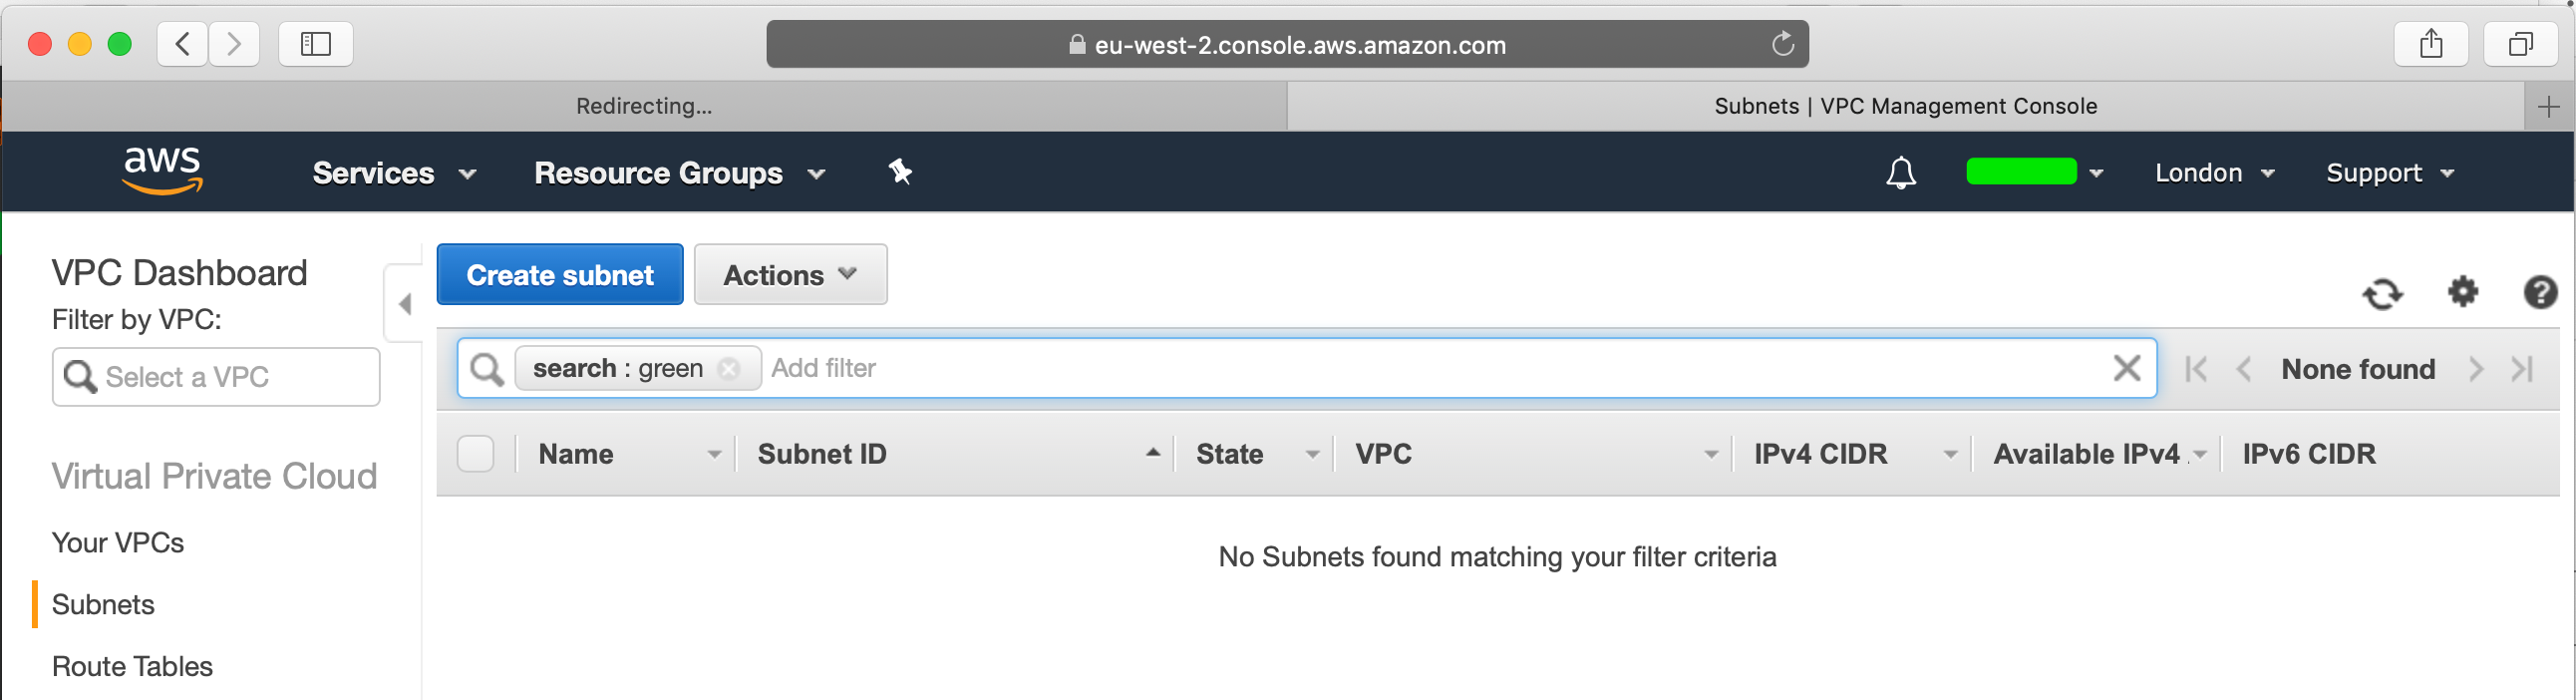
Let’s go ahead and do this, head over to your green account, from the VPC section select “Subnets”:
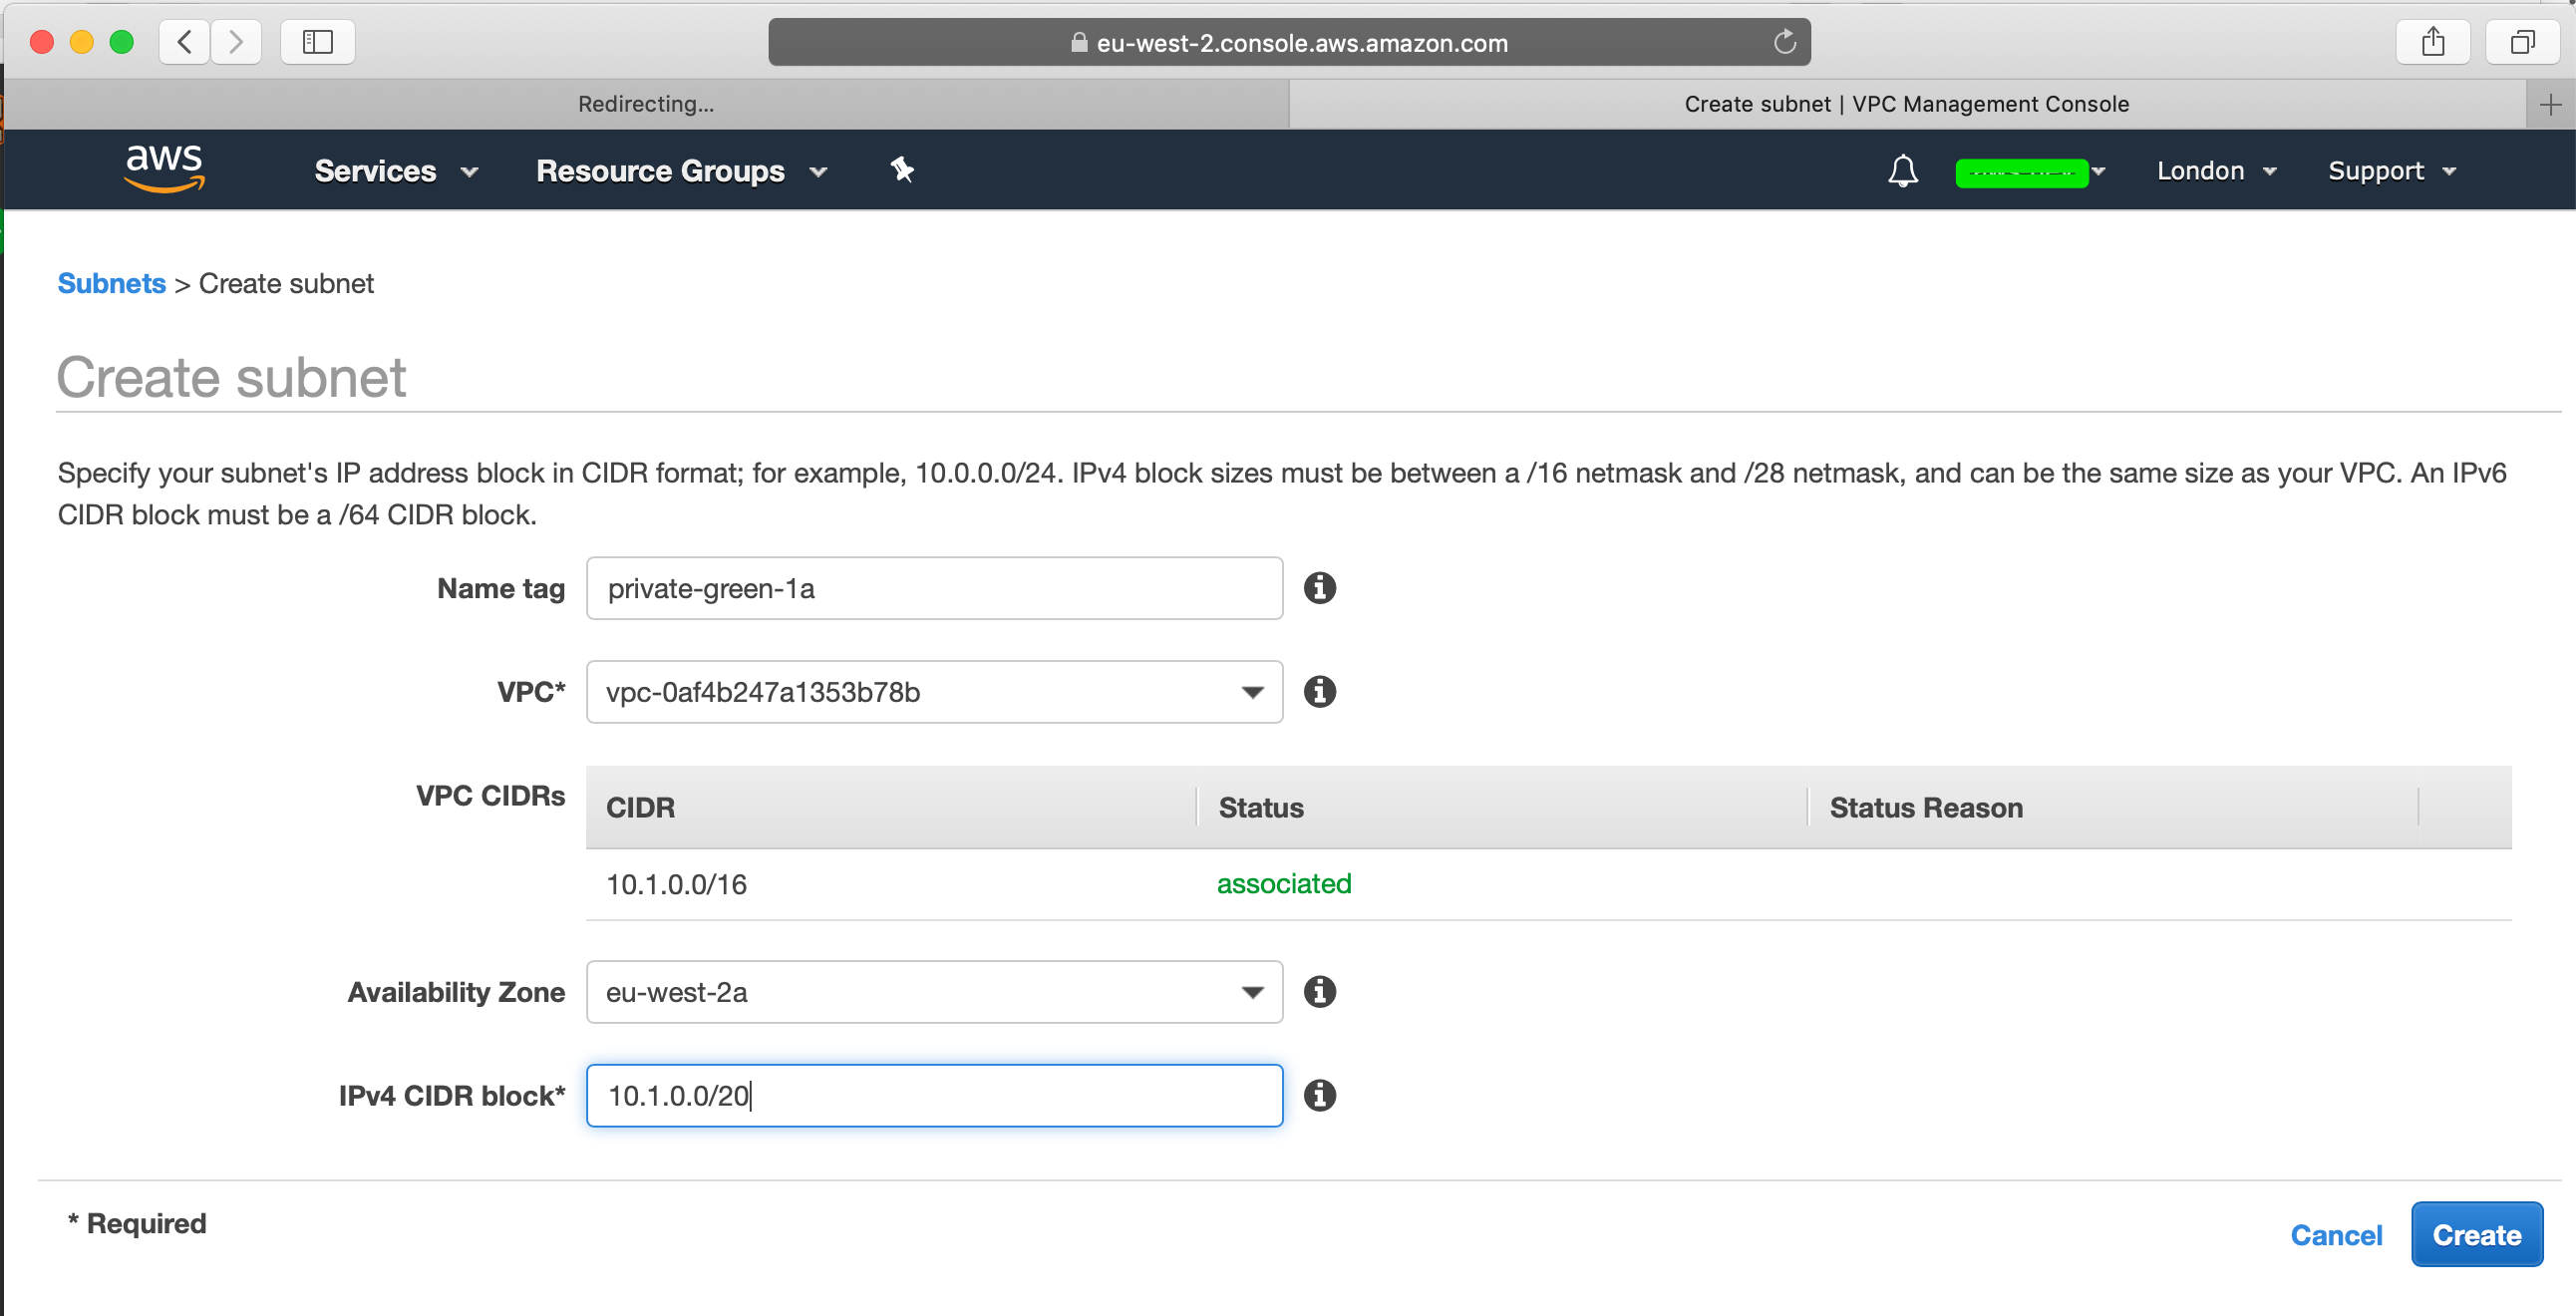
Go ahead and create a subnet where you will need to specify the VPC that you created, slect the first CIDR block, in my case 10.1.0.0/20 and select the first AZ:
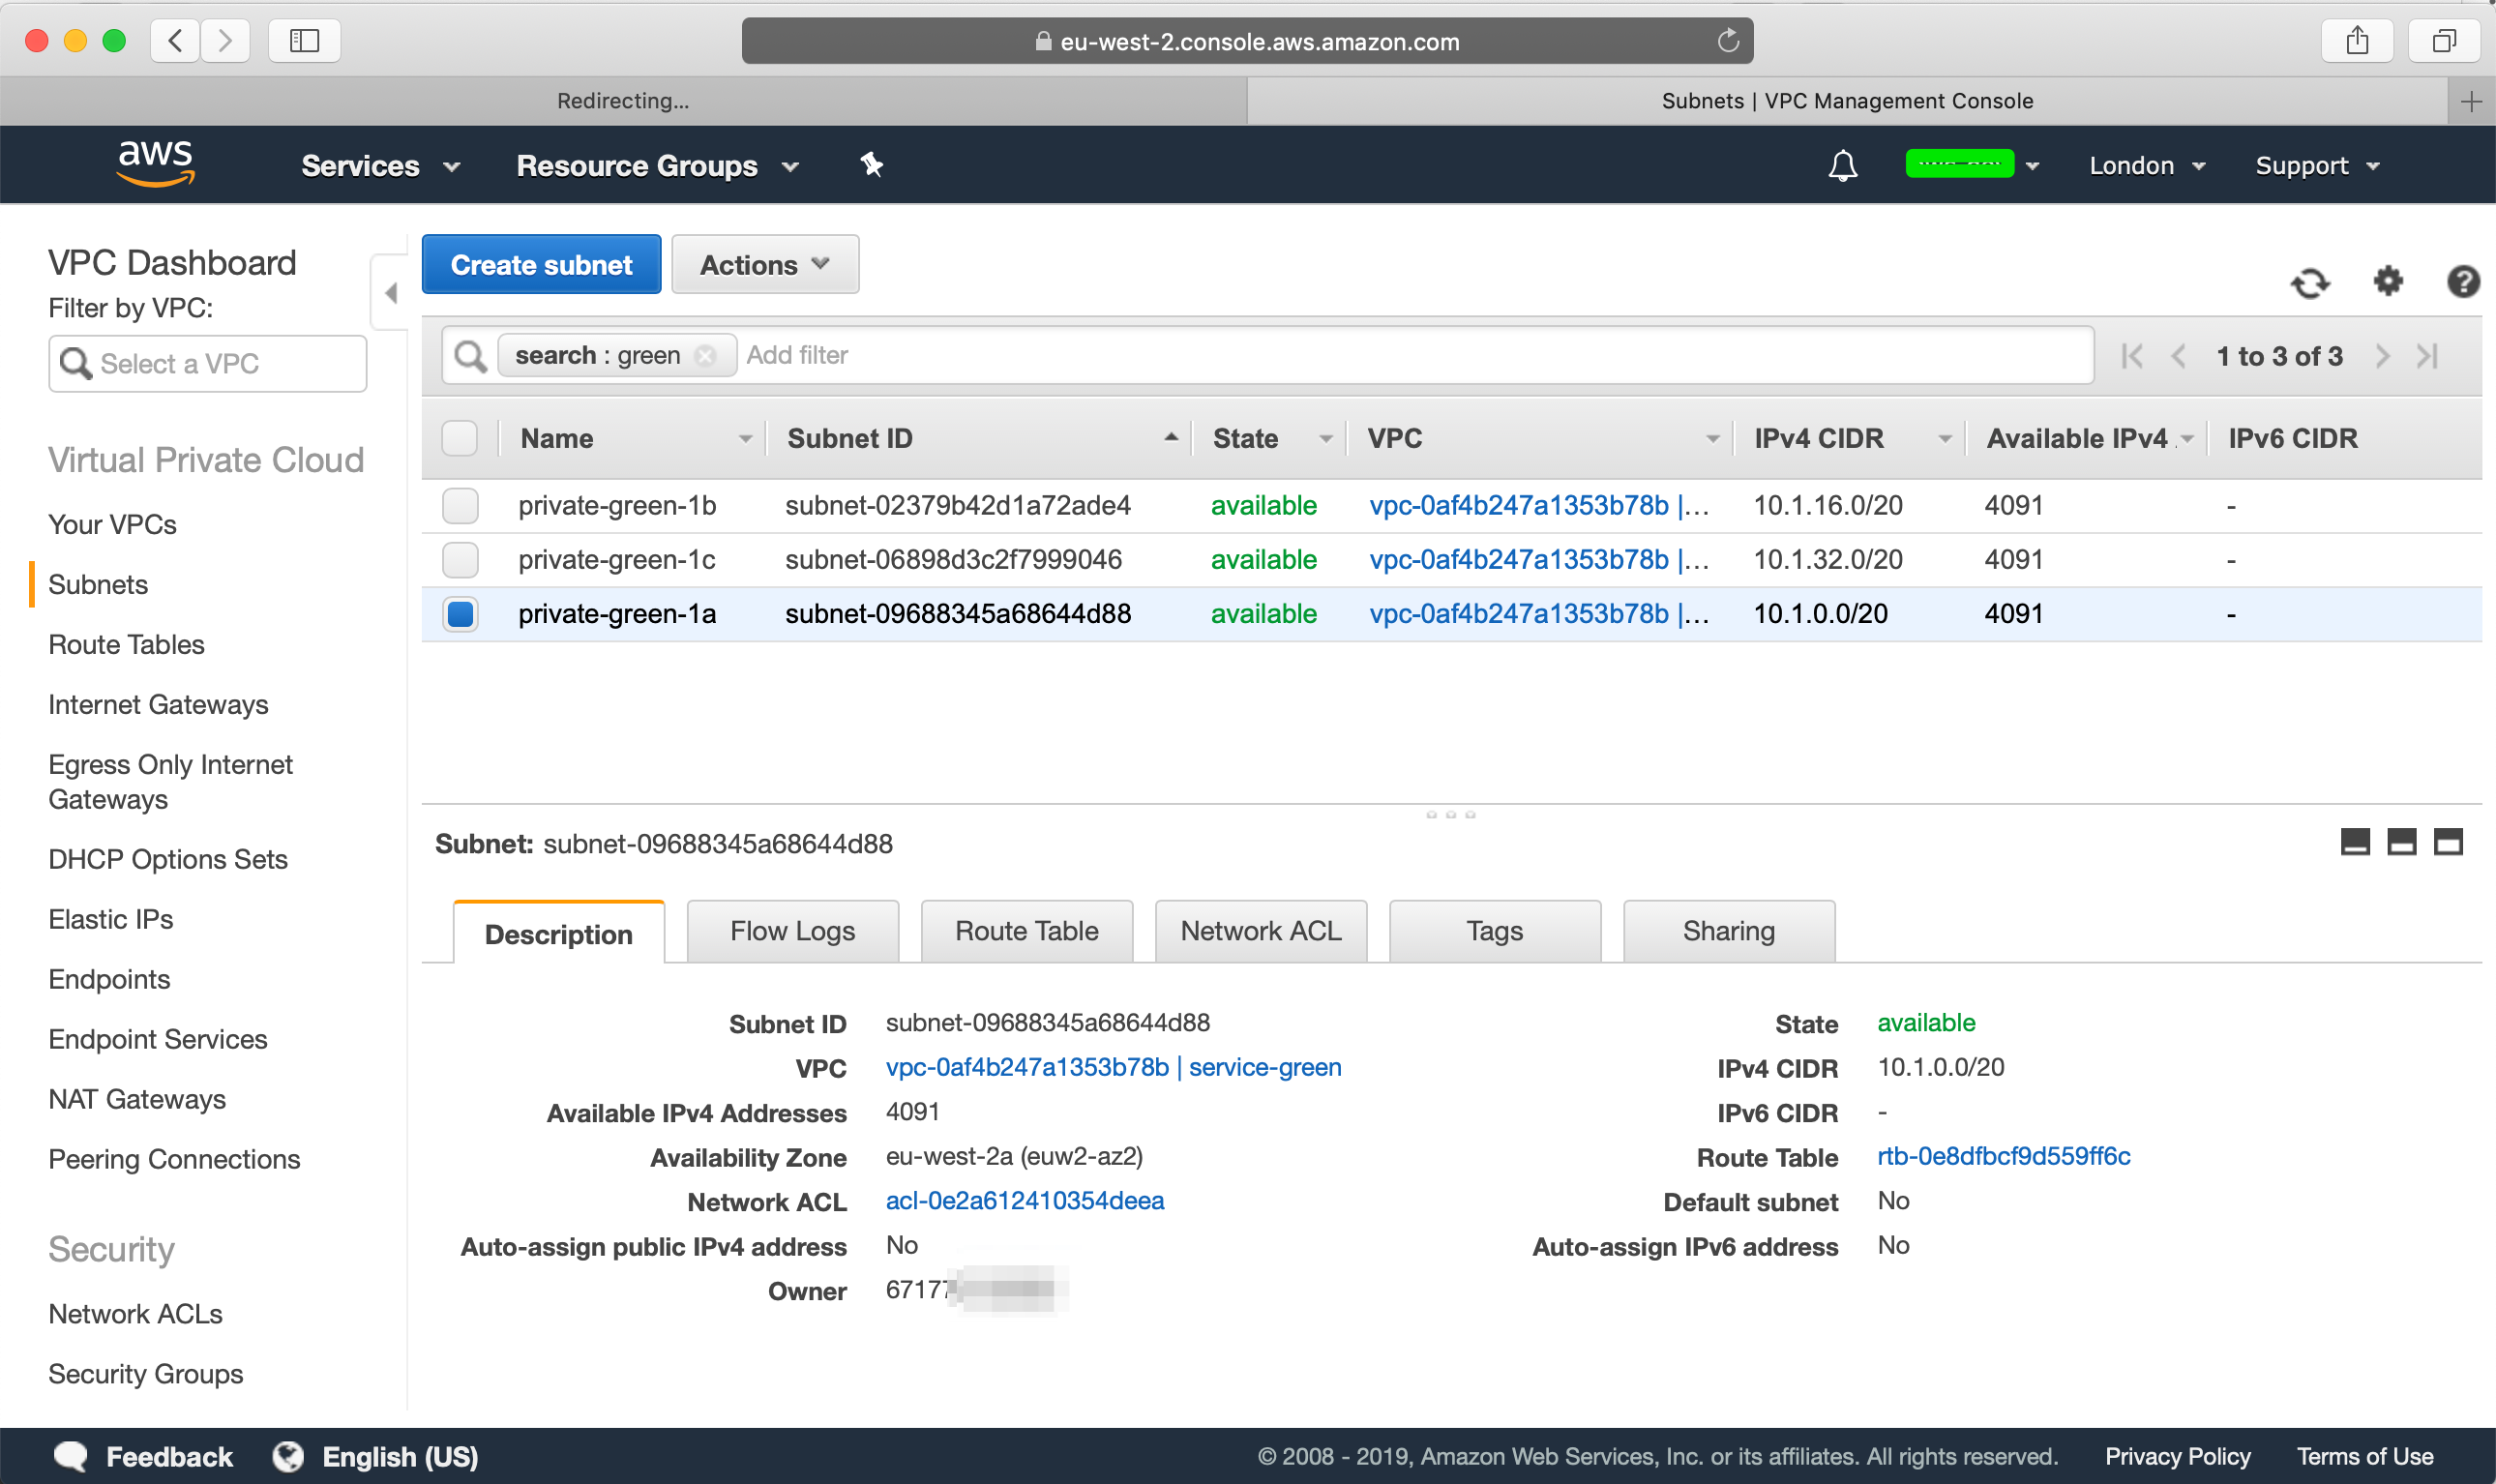
Do this for the other two subnets as well and then when you are done, it may look more or less like this:
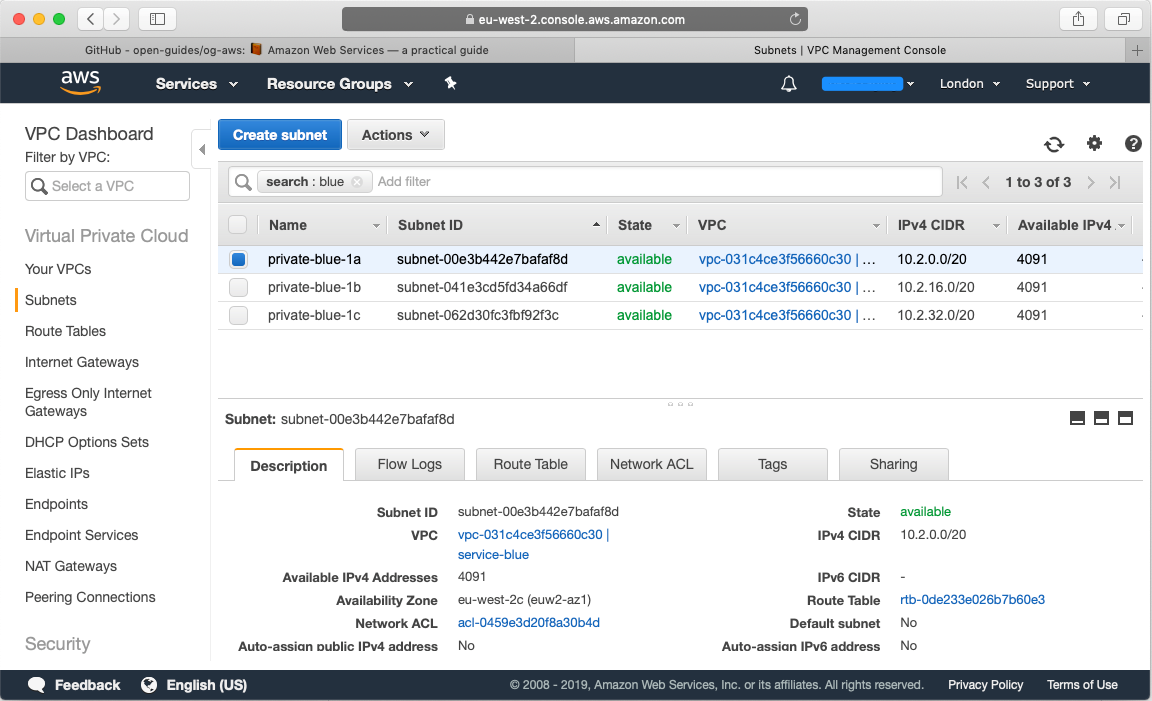
Repeat this process that you have three subnets for your blue account as well:
Setup VPC Peering Connection
Now that we’ve created our VPC’s and subnets for each VPC we want to peer our two VPC’s with each other so that we have a direct connection between our VPC’s so that our EC2 instances from our green account is able to connect with our EC2 instances in our blue account.
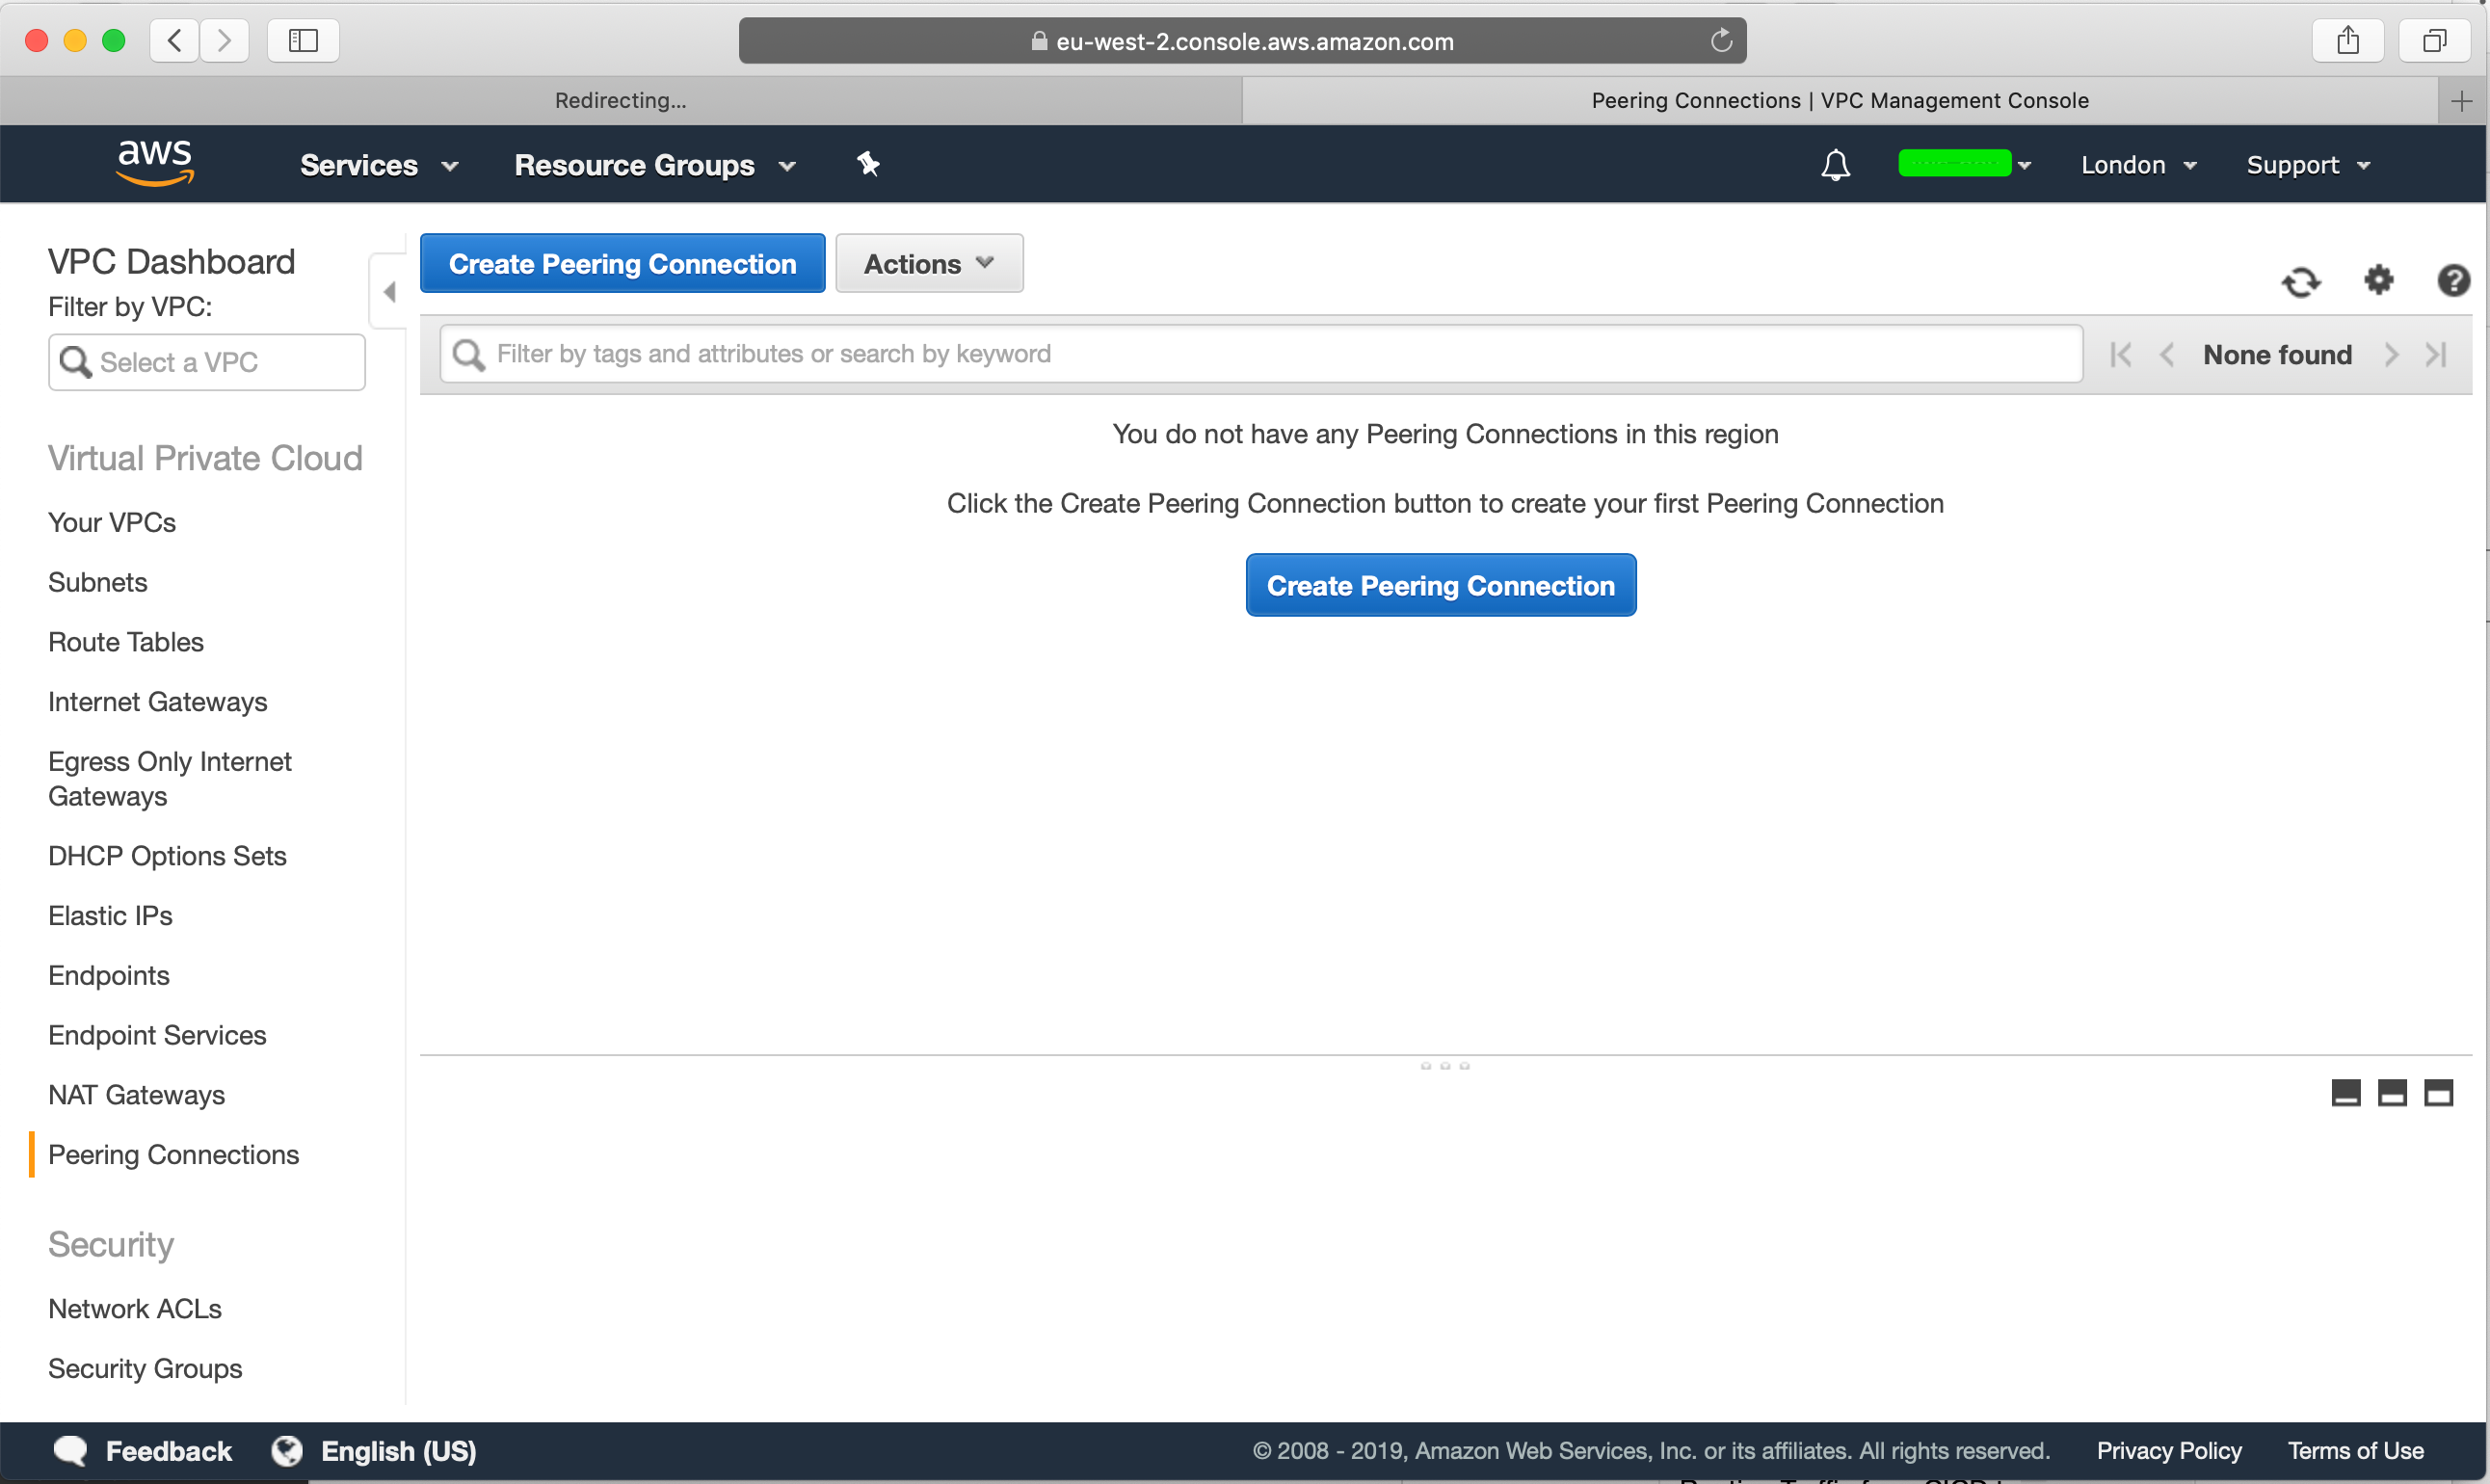
Head over to your green account’s VPC section and select “Peering Connections”:
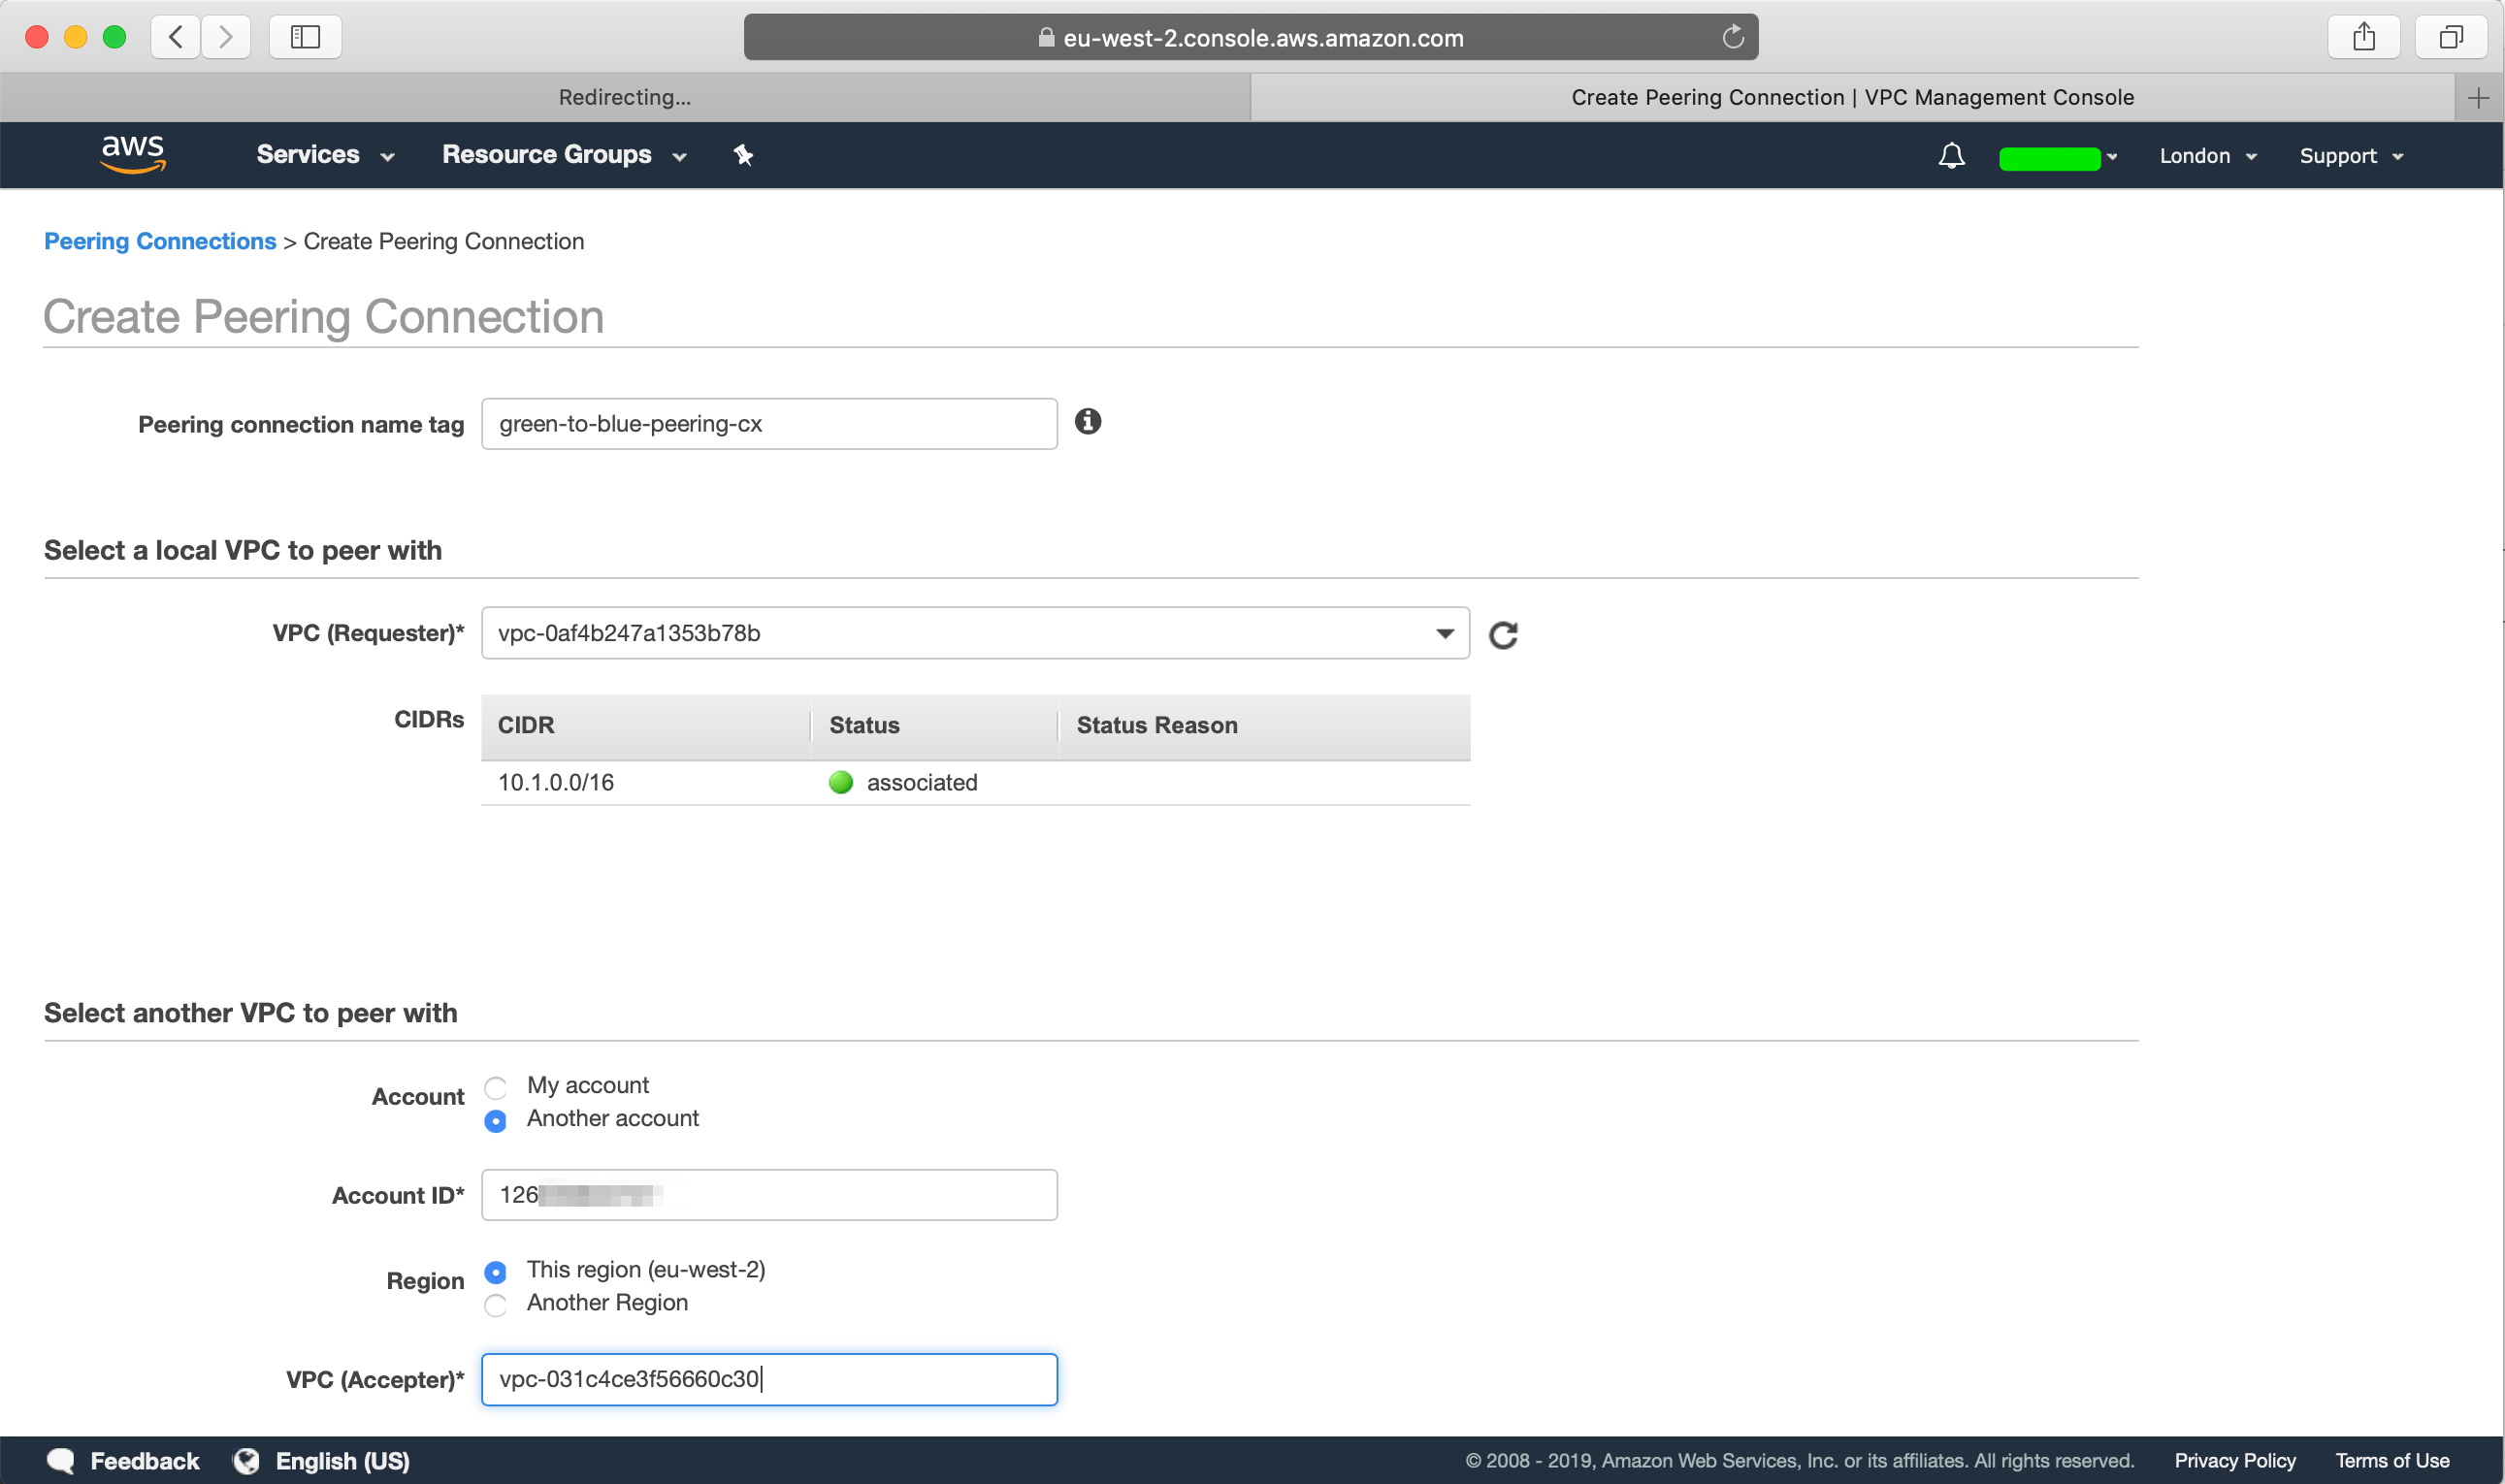
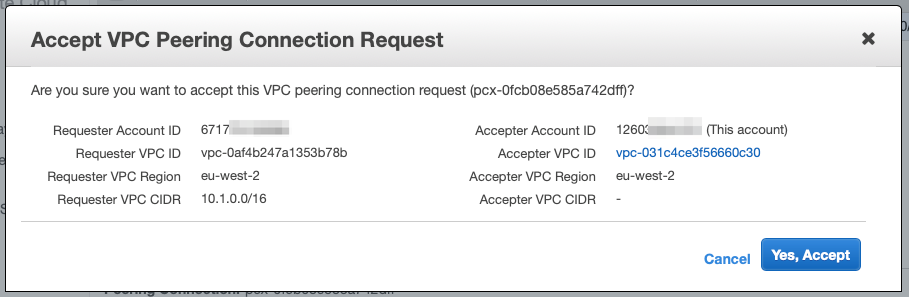
Create a new peering connection, we will first need to name our peering connection, select the source VPC which will be our green account’s VPC, since the VPC that we want to peer with is in another account, get the AWS Account ID from the blue account, and select “Another account” and provide the account id that we want to peer with, select the AWS Region and provide the VPC ID of the blue account:
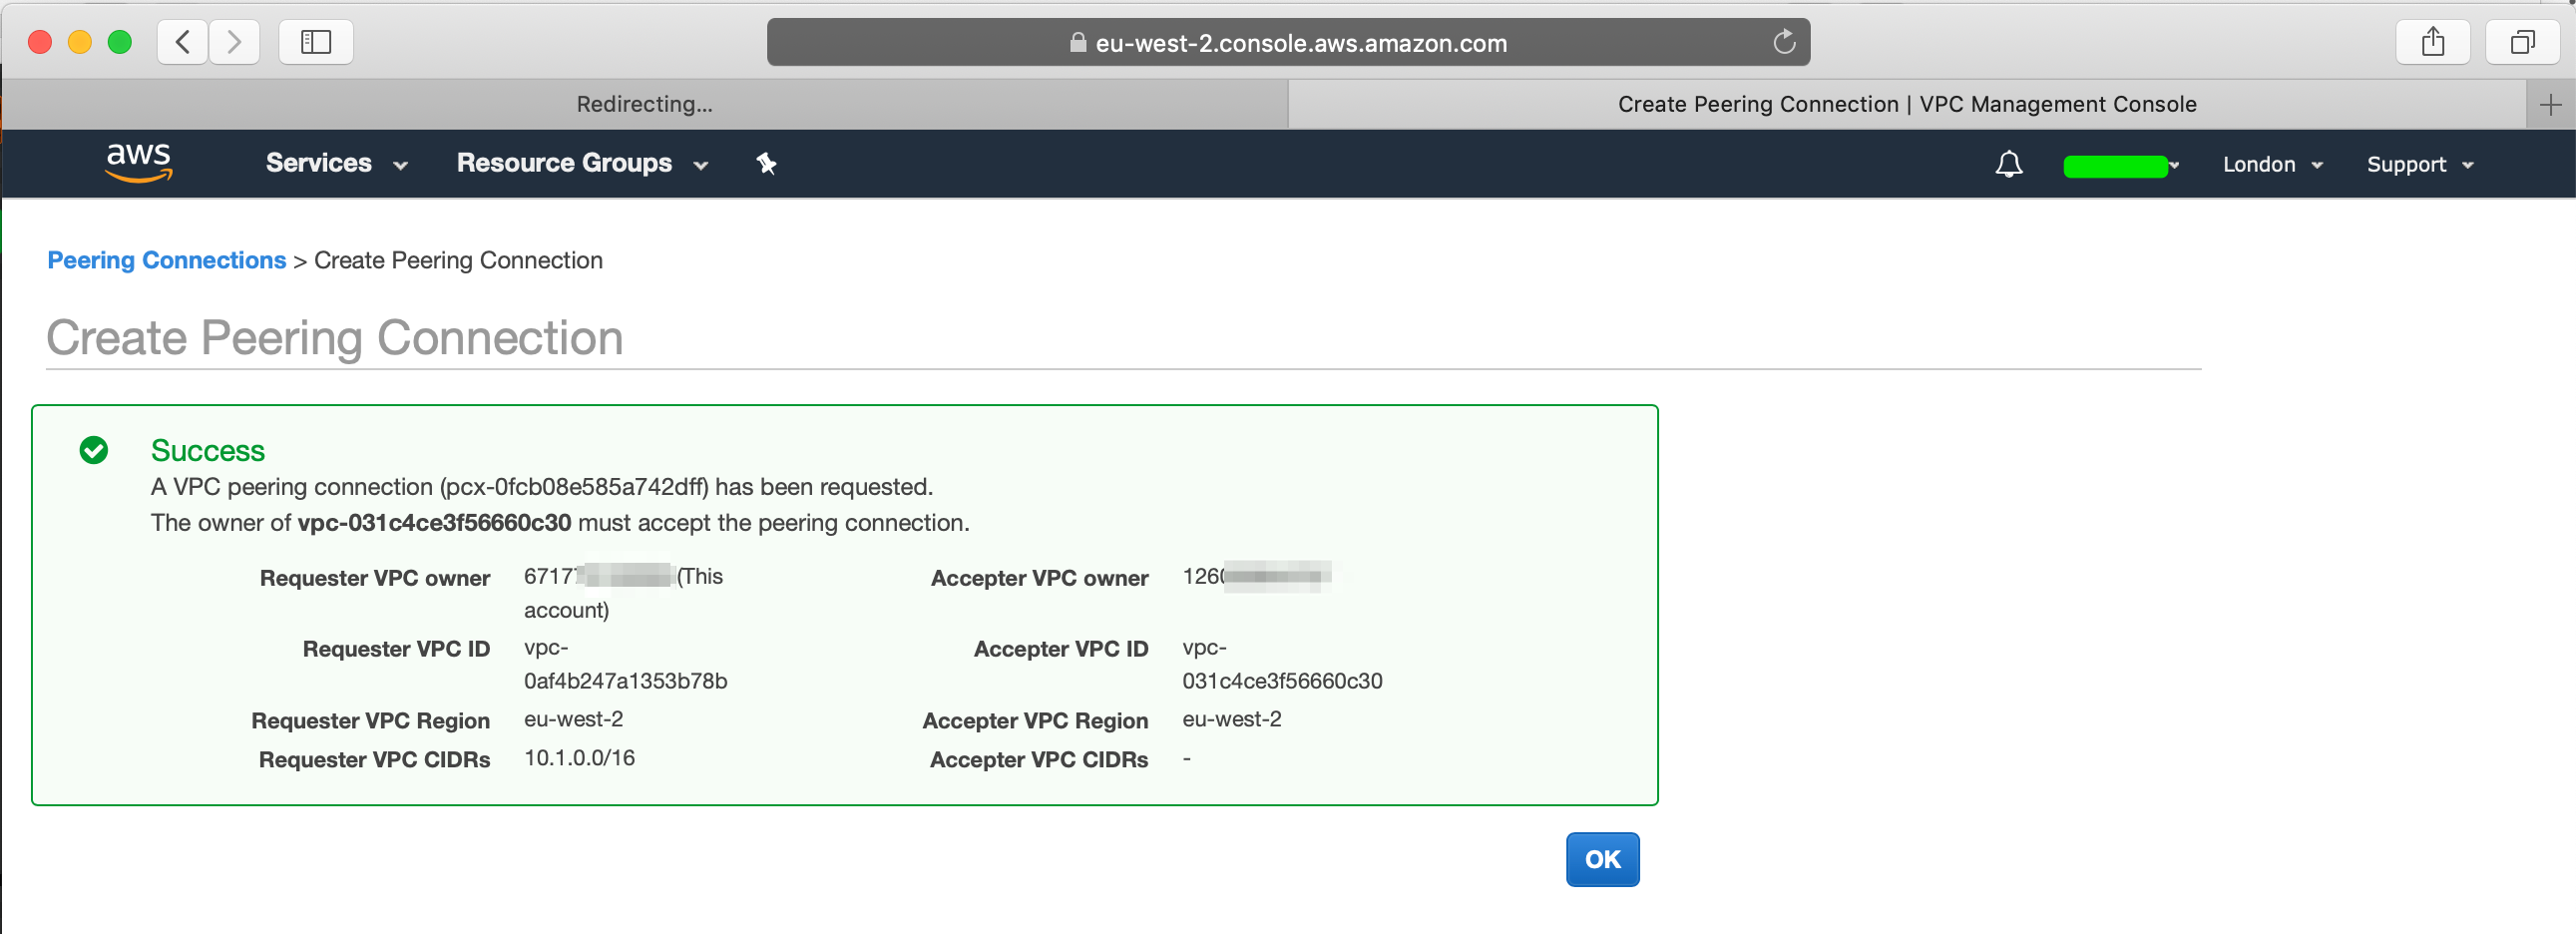
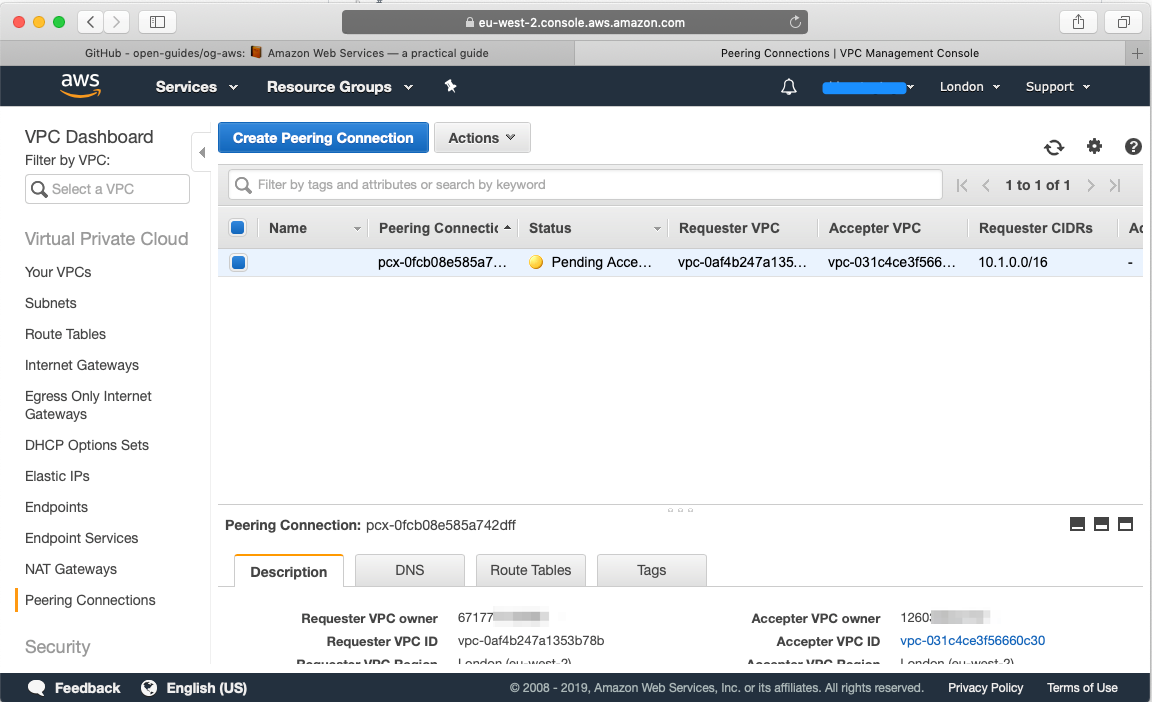
Once you create the peering connection, you will find the peering request details:
Now let’s head over to our blue Account, head over to VPC, select Peering connections and you will find the peering request from our green account:
From the top, hit “Actions” and accept the request:
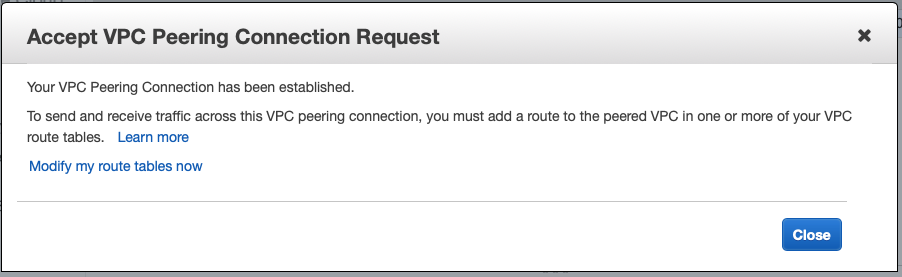
You should see that the VPC Peering connection has been established:
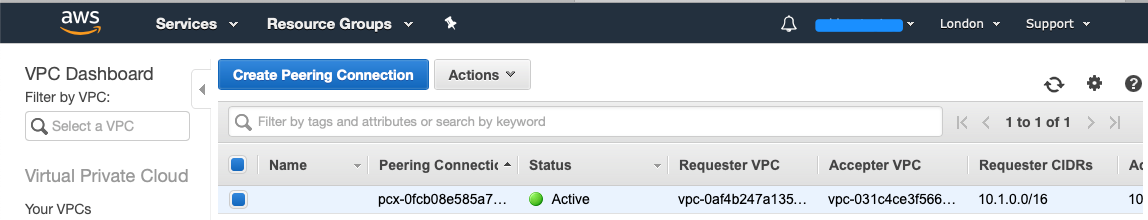
From the blue account you should see that the VPC Peering Connection is active:
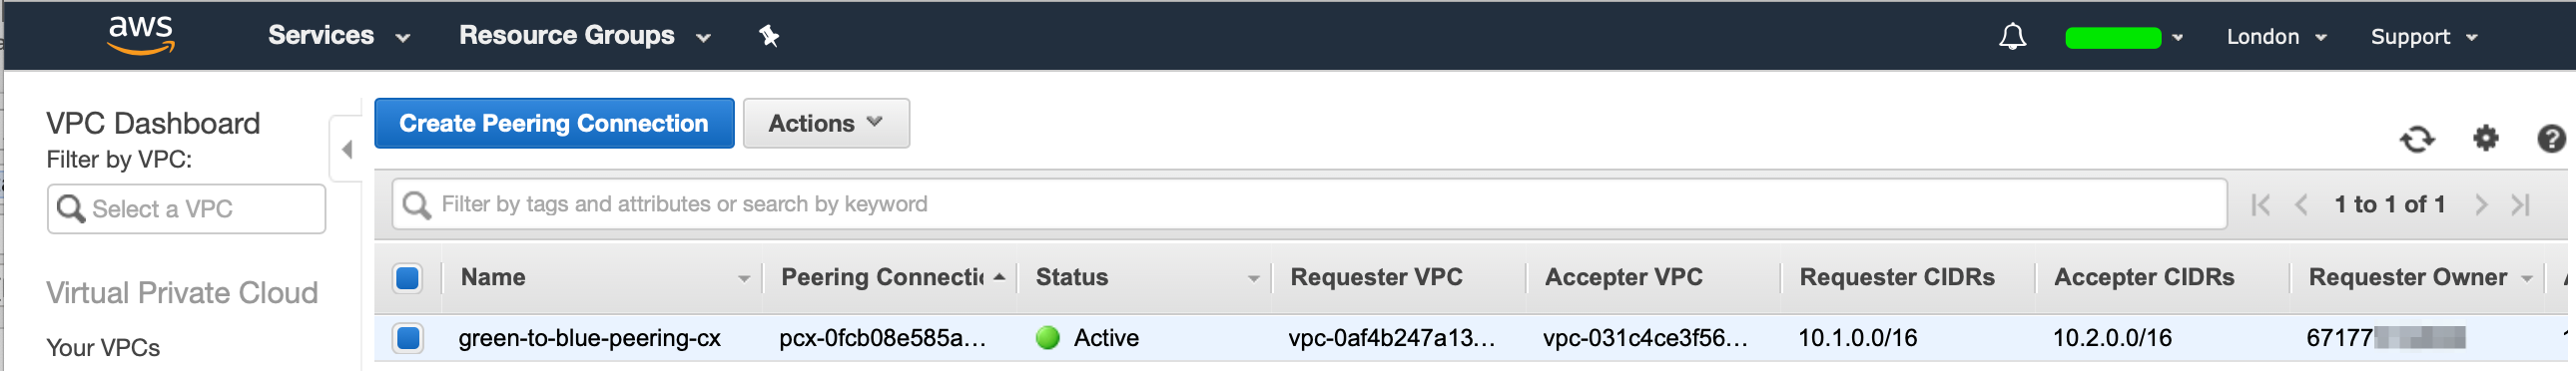
If you head back to the green account, you will see under Peering Connections that the connection has been established:
We have now successfully created our VPC peering connection and the two VPC’s from different accounts has been peered. Now we would like to launch our EC2 instances in our VPC, we will connect to our EC2 instance in our green account via the internet and then SSH to our EC2 instance in our blue account via the VPC peering connection via the Private IP Address.
Setup Internet Gateway
In order to connect to a Public Elastic IP, we first need to create a Internet Gateway on our VPC and add a route to route all public traffic via our Internet Gateway. This allows our resources in that VPC to be able to connect to the Internet.
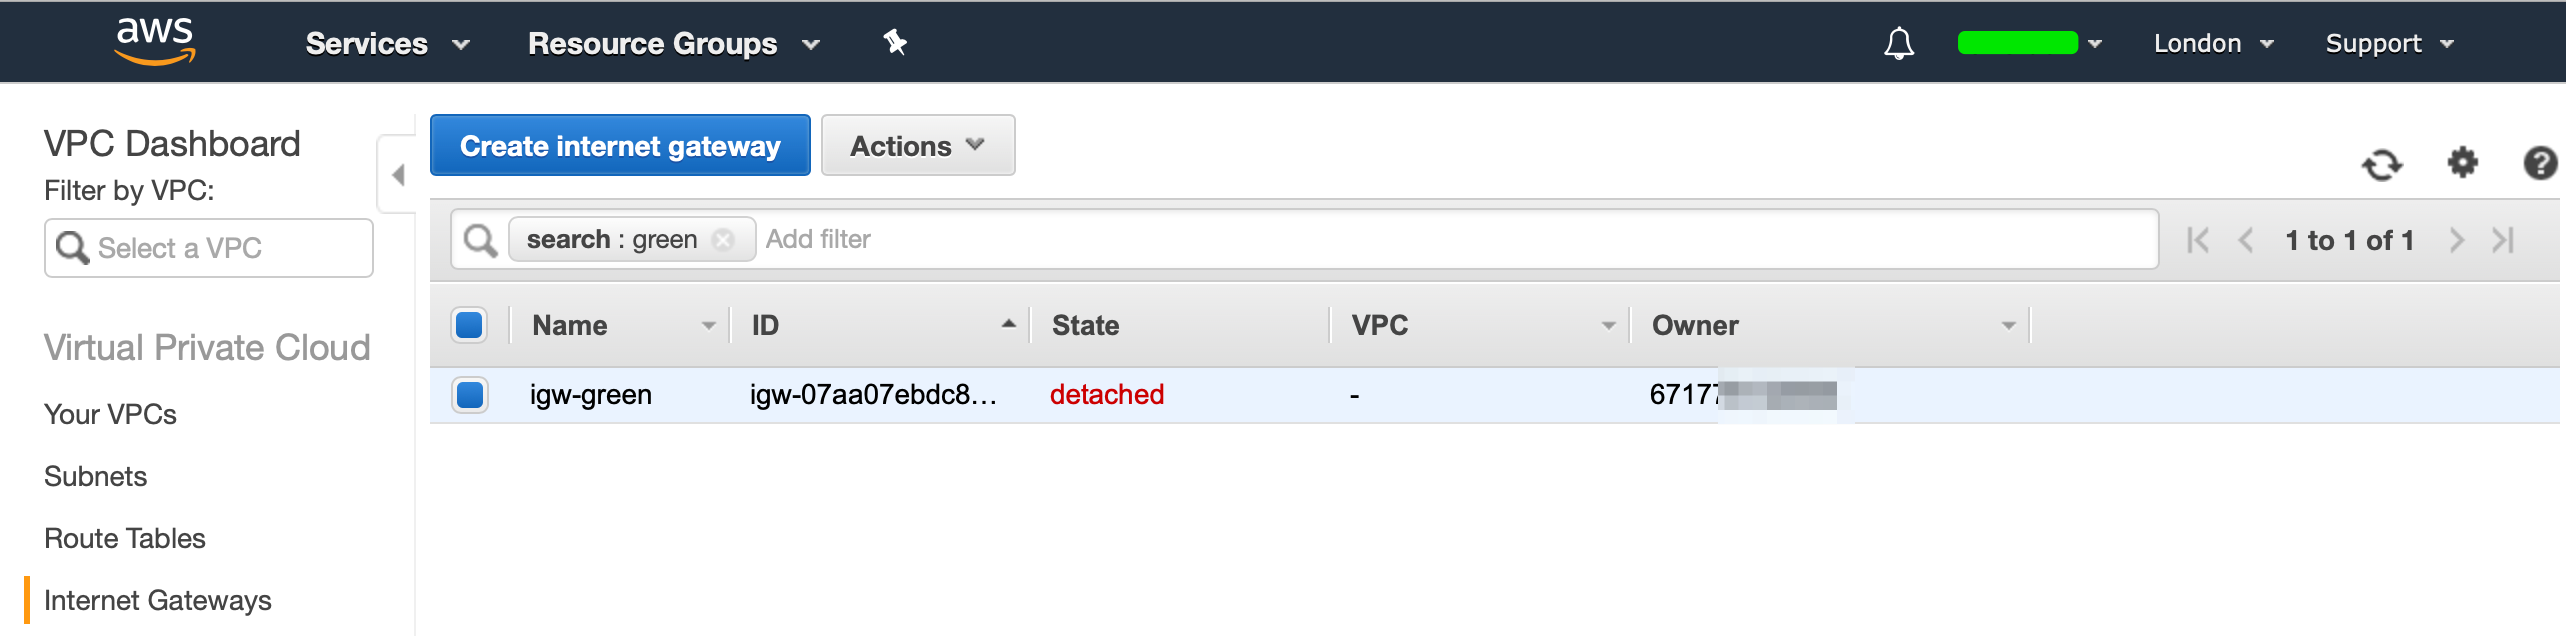
Head over to “Internet Gateways”, and create a new Internet Gateway:
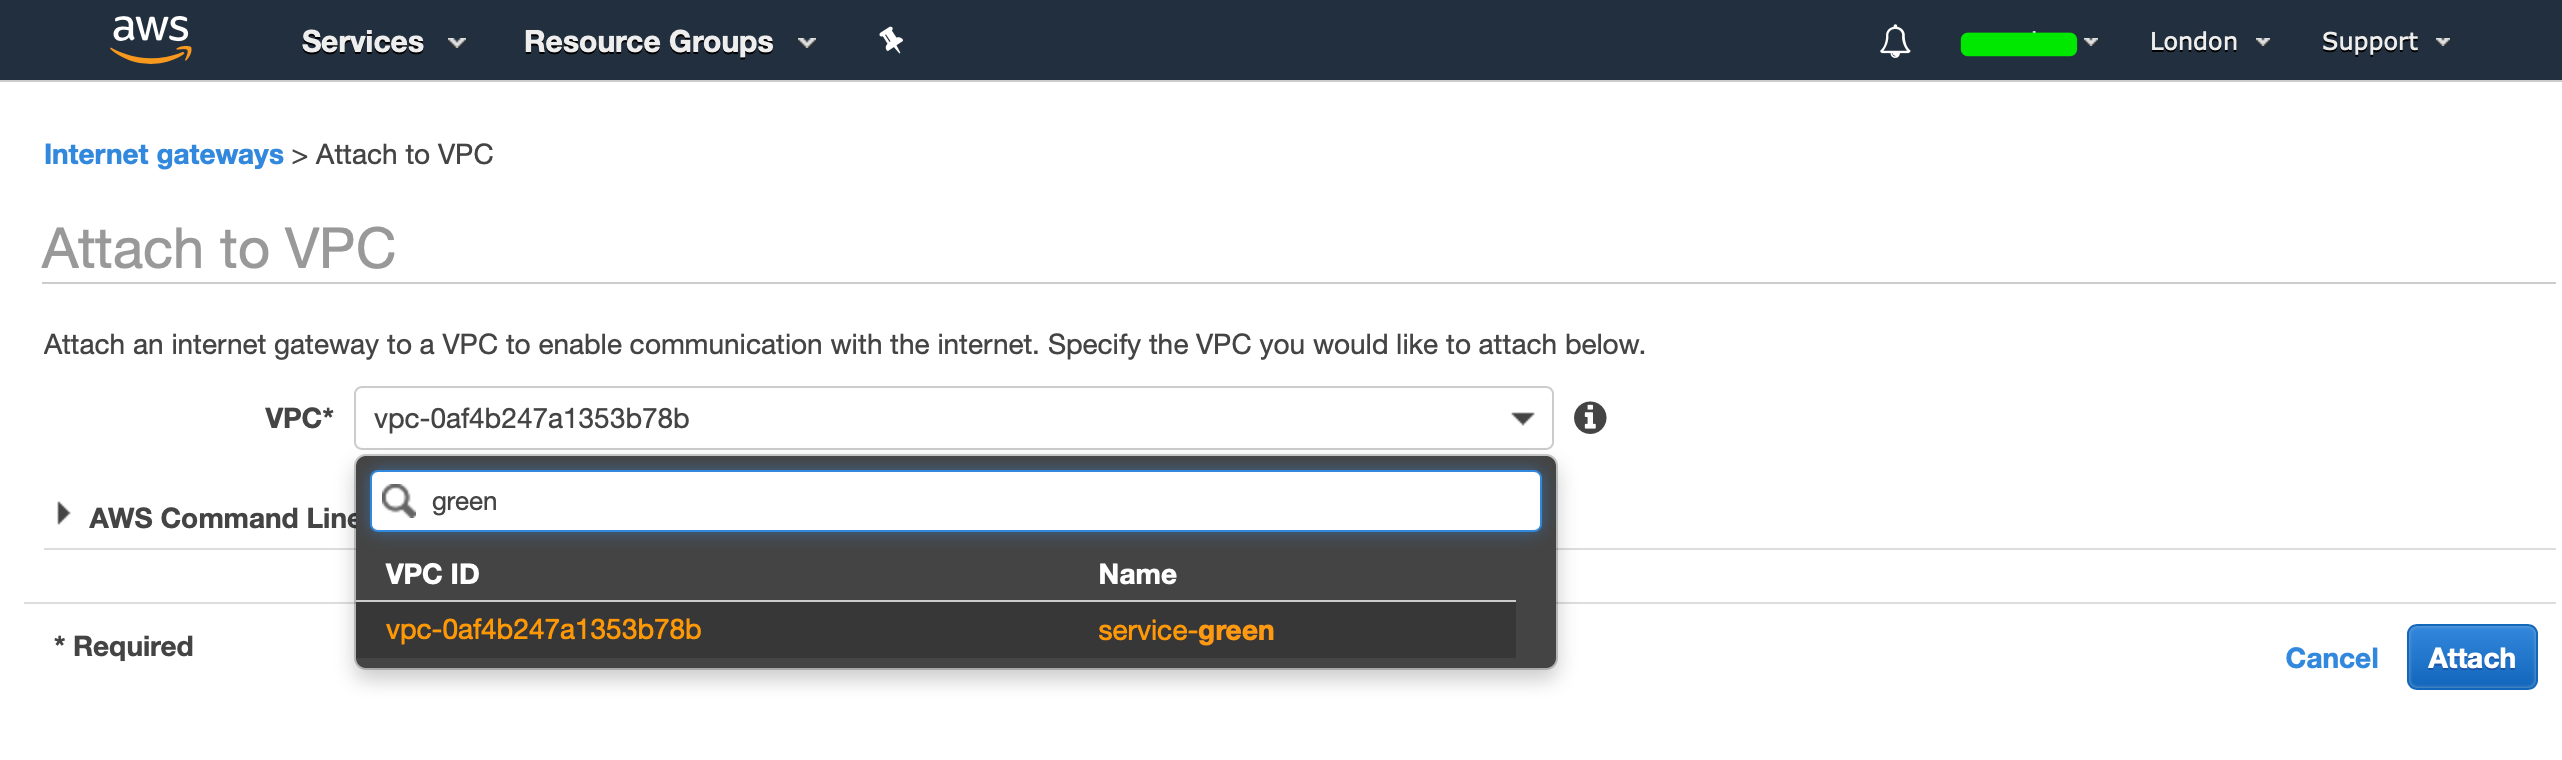
Our IGW (Internet Gateway) will now be in a detached state, we now need to attach our IGW to our VPC. Hit “Actions”, then select “Attach to VPC”, and select your VPC:
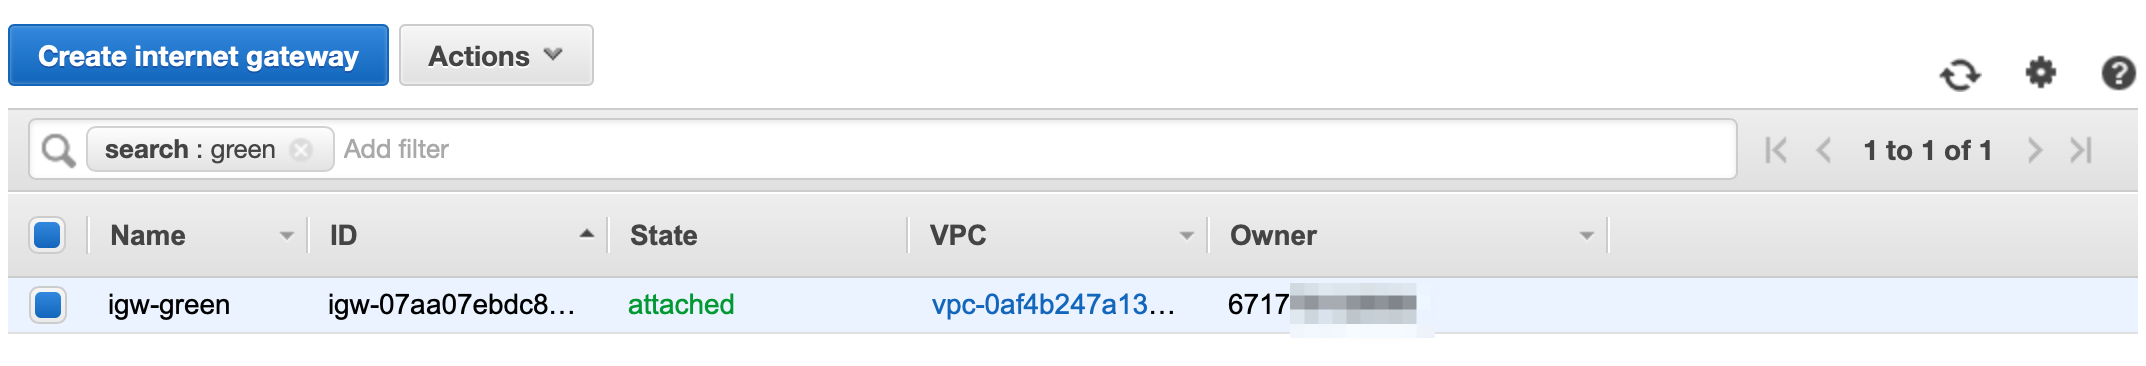
You should now see that your IGW has been attached to your VPC:
Now that we have created an IGW and associated it to our VPC, we now need to configure our routing table so that it knows how to route non-local traffic via the IGW.
Configure Routing Table
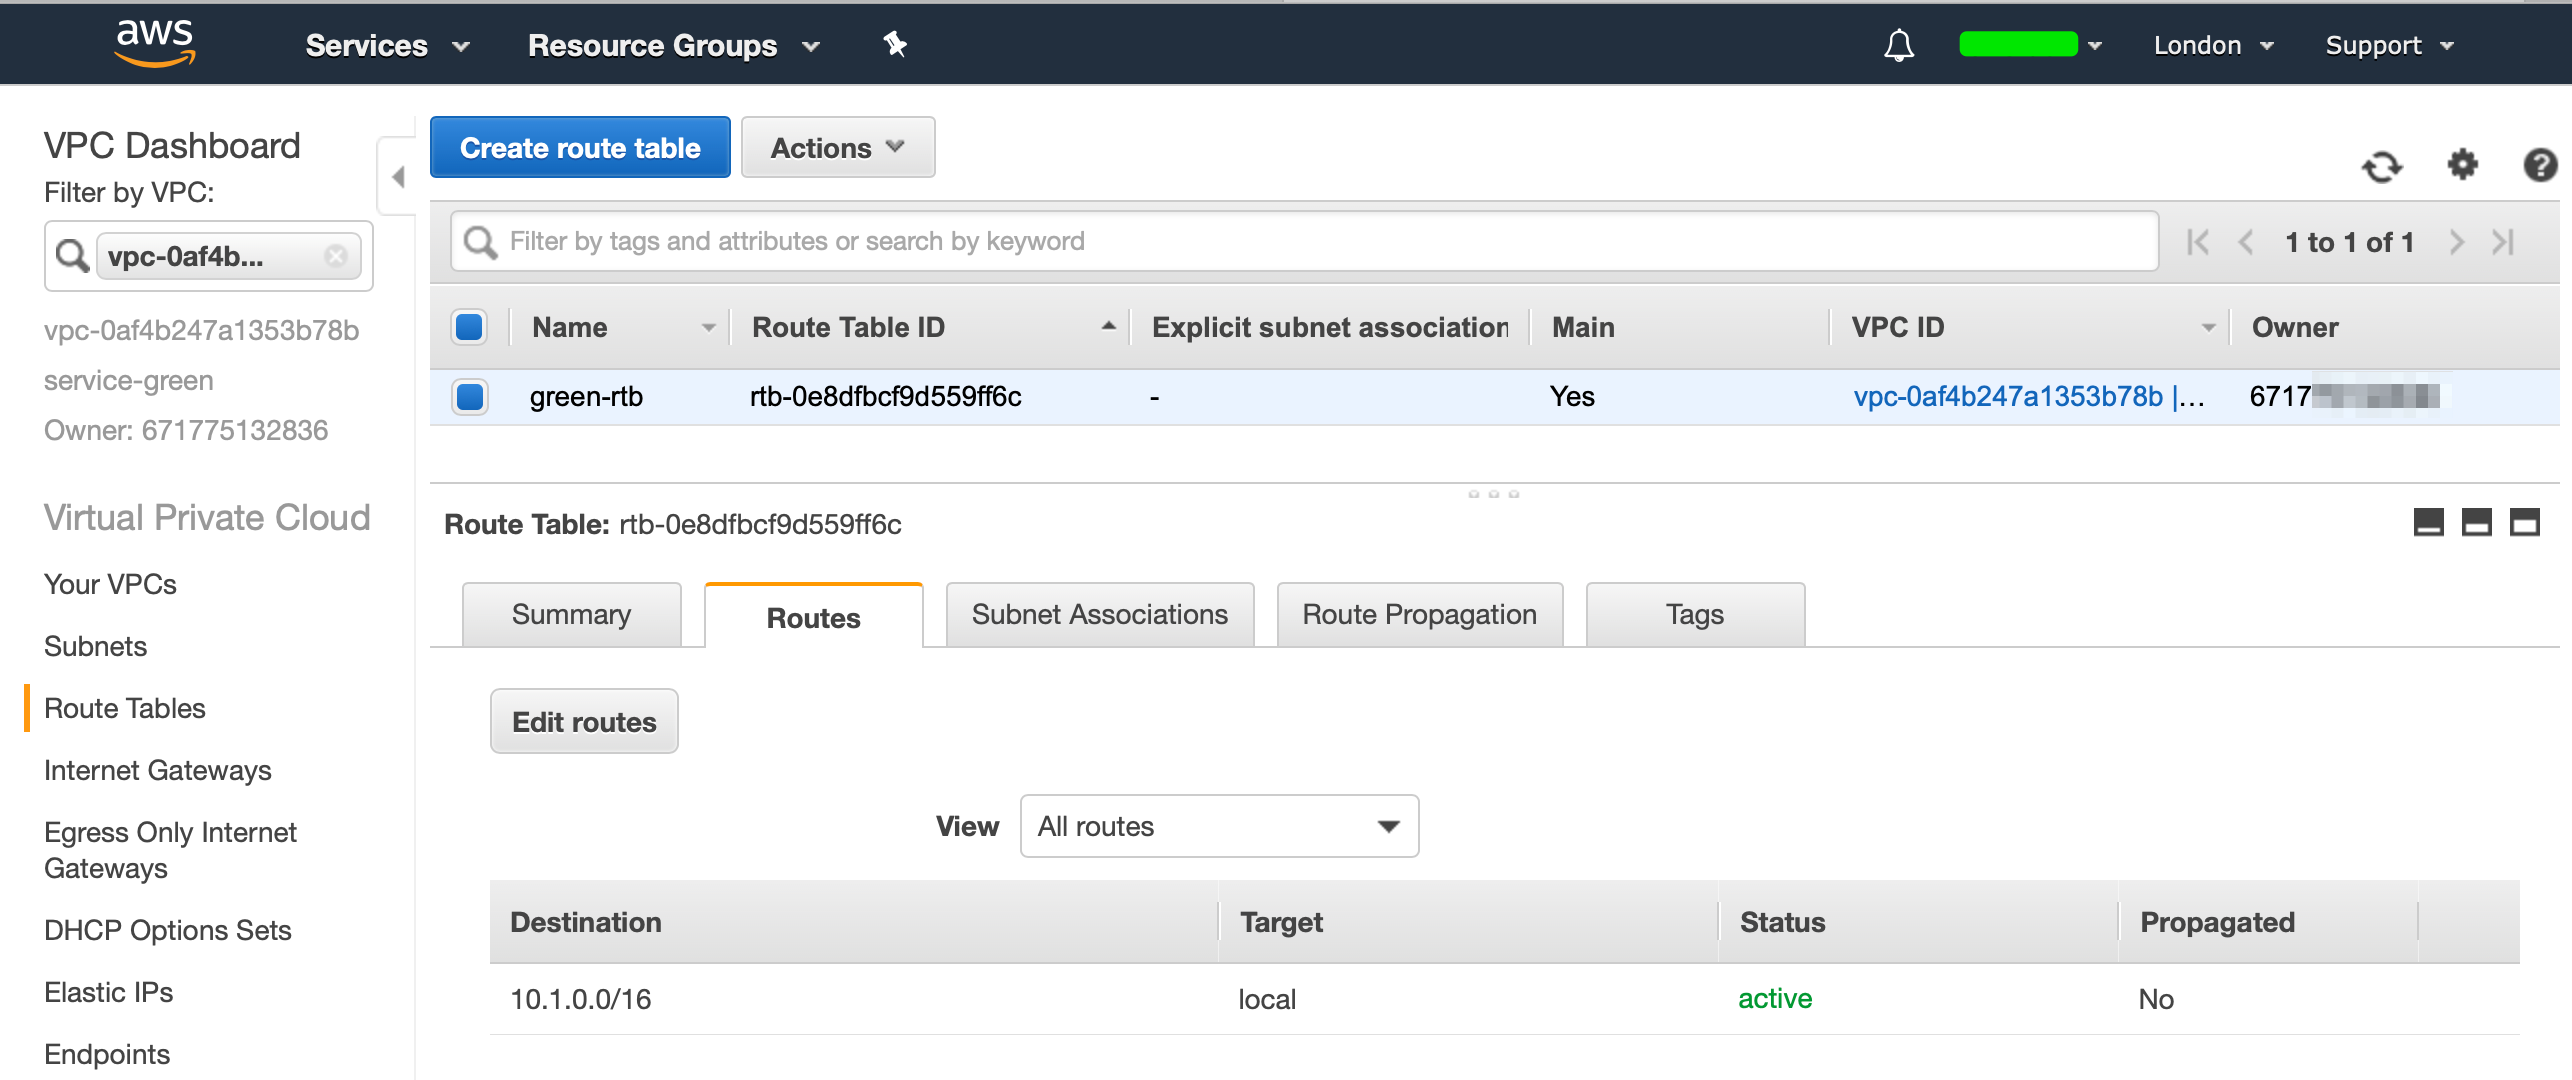
Head over to VPC, select your VPC, select the “Route Tables” section from the left and you should see the following when you select the “Routes” section:
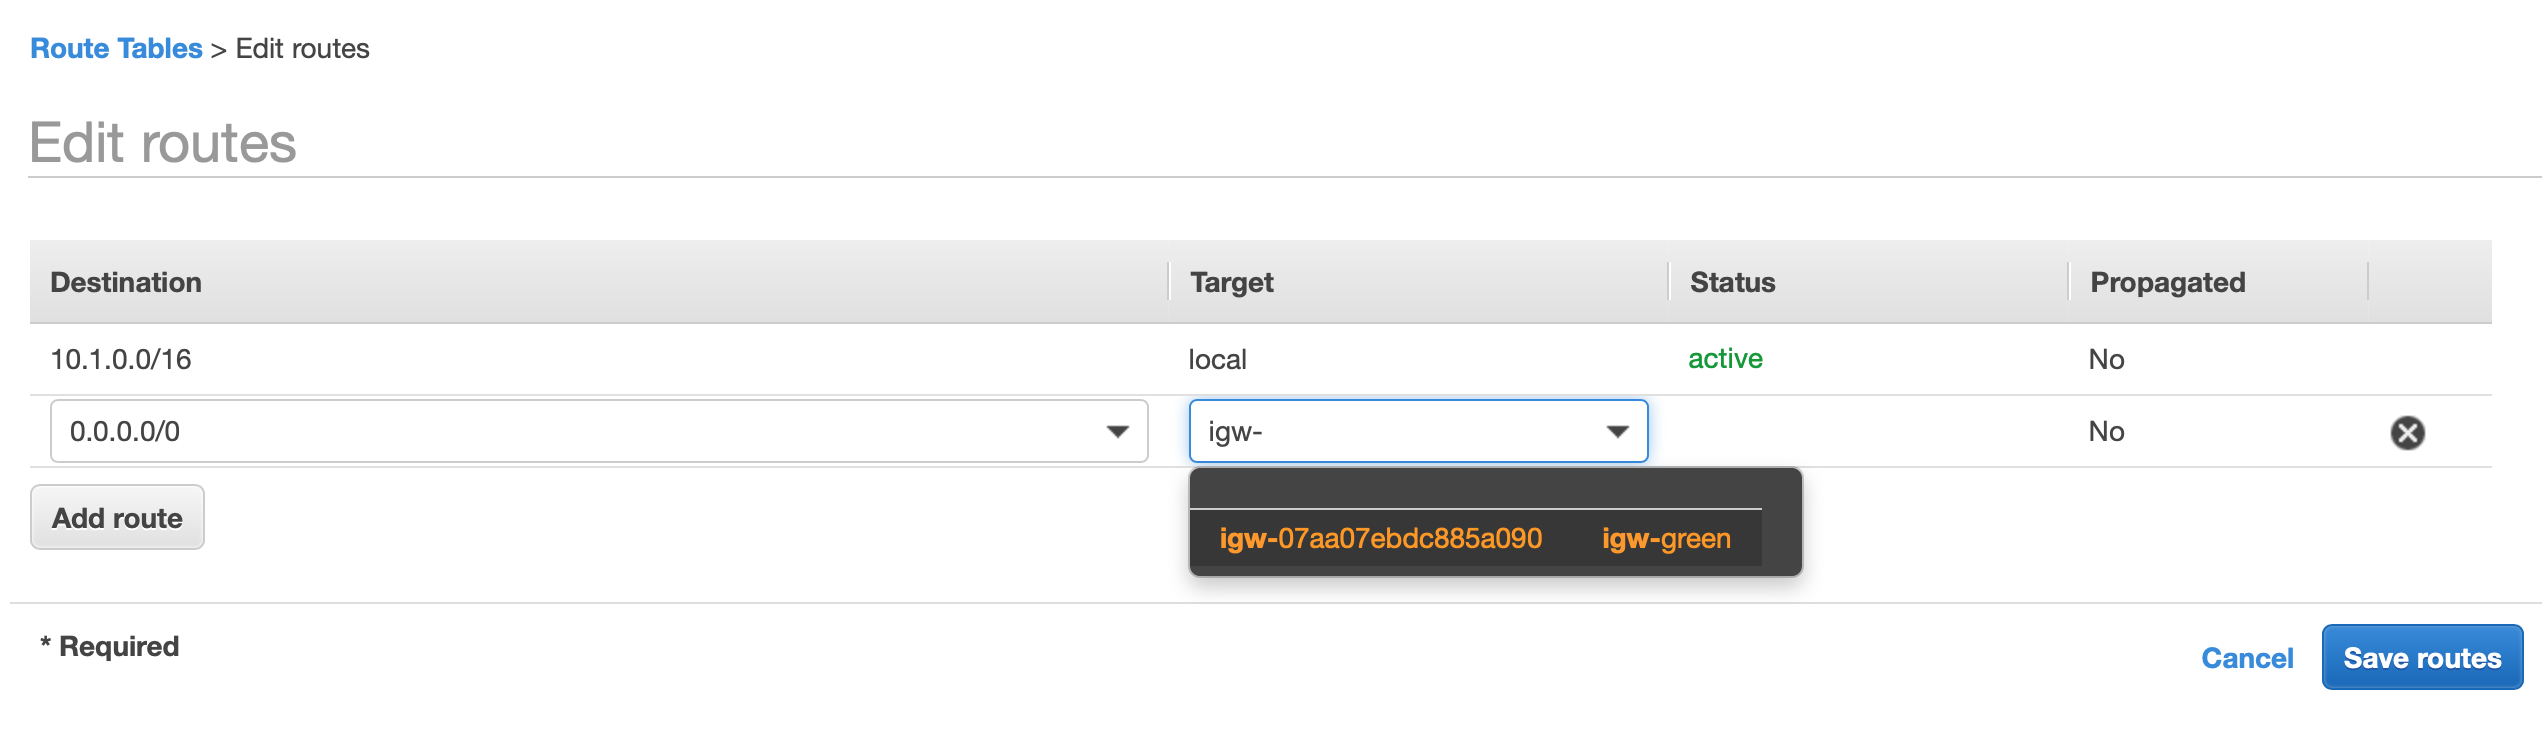
Select “Edit Routes” and add a route with the destination 0.0.0.0/0 select the Internet Gateway as a target and it will filter through your available IGW’s and select the IGW that you created earlier, then select save. (If your blue account needs internet access, repeat these steps on the blue account as well.)
While we are at our routing tables configuration, we should also inform our VPC how to reach the subnet from the VPC from the other account. So that our Green App (10.1.0.0/16) can reach our blue app (10.2.0.0/16) via the Peering Connection.
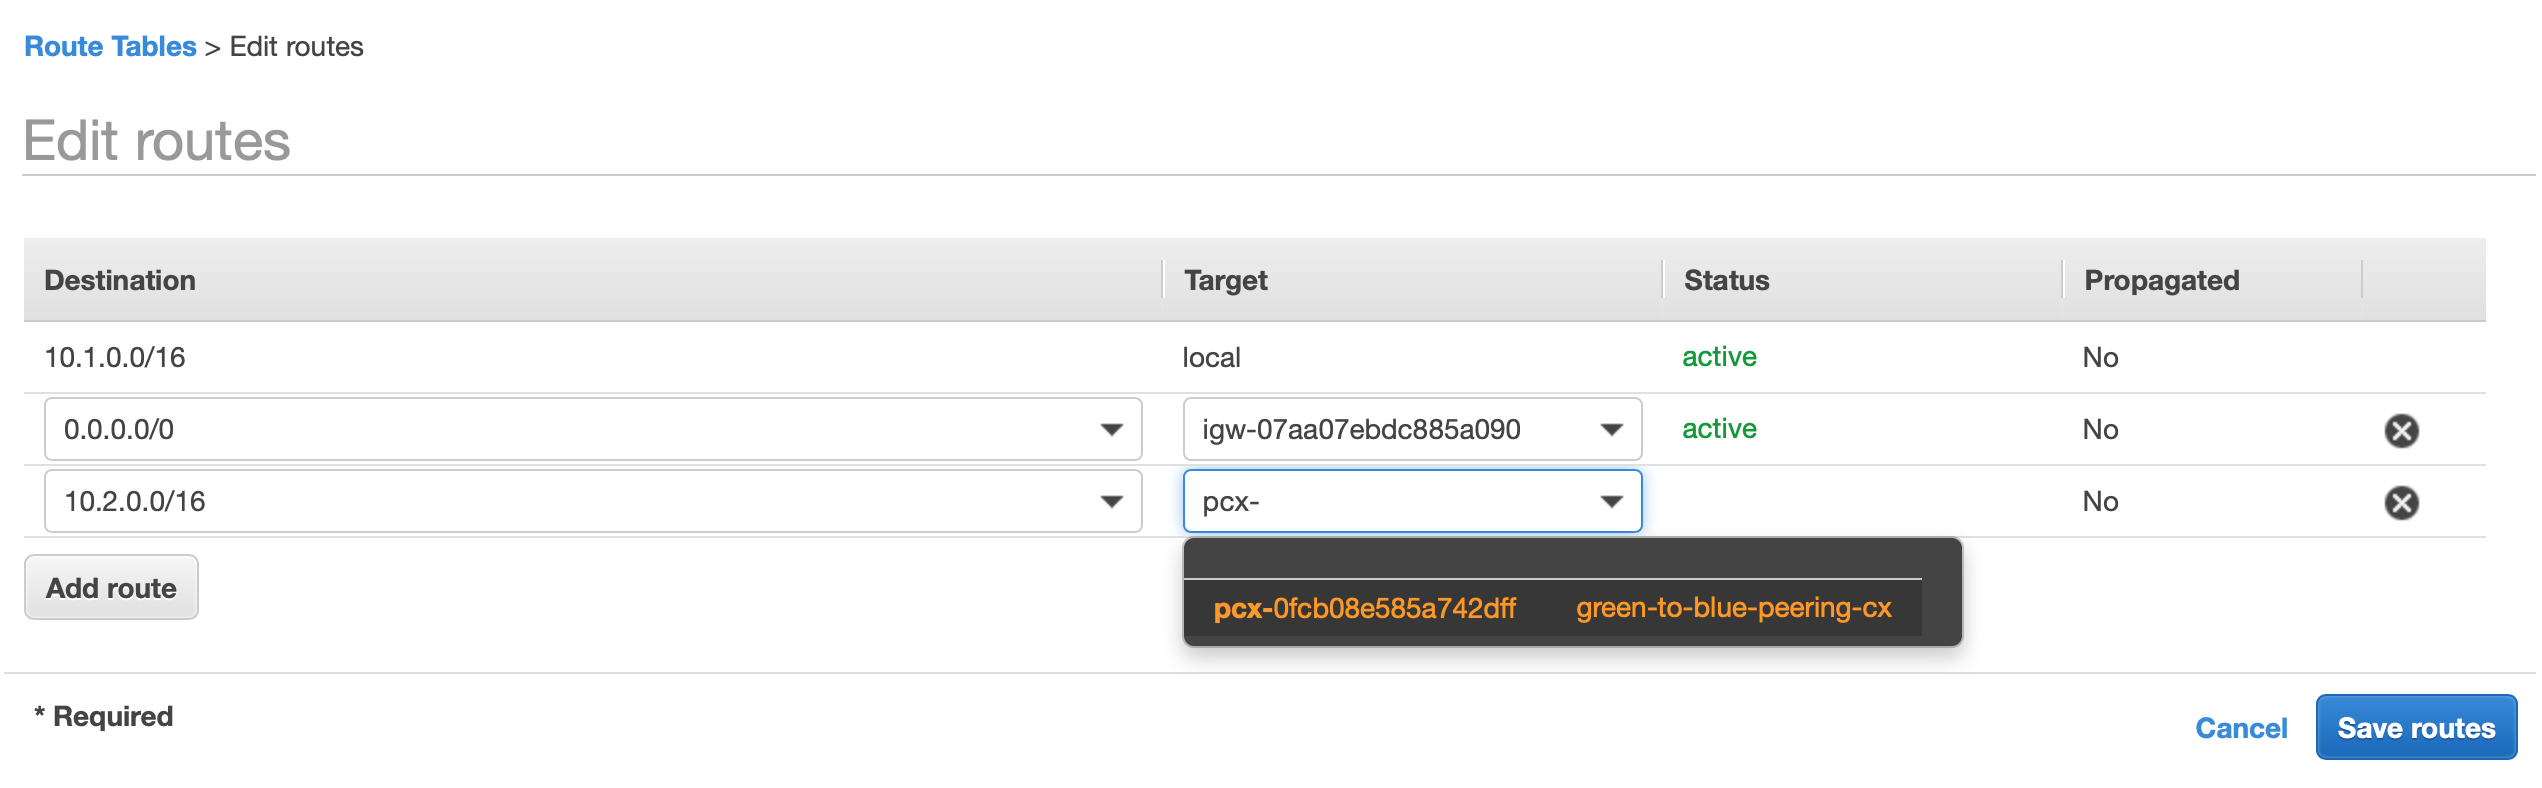
We do this by adding a route to our routing table. From the green account’s VPC’s routing table add a new route with the destination of 10.2.0.0/16, select “Peering Connection” as the target and it should resolve to the peering connection resource that we created, then select save:
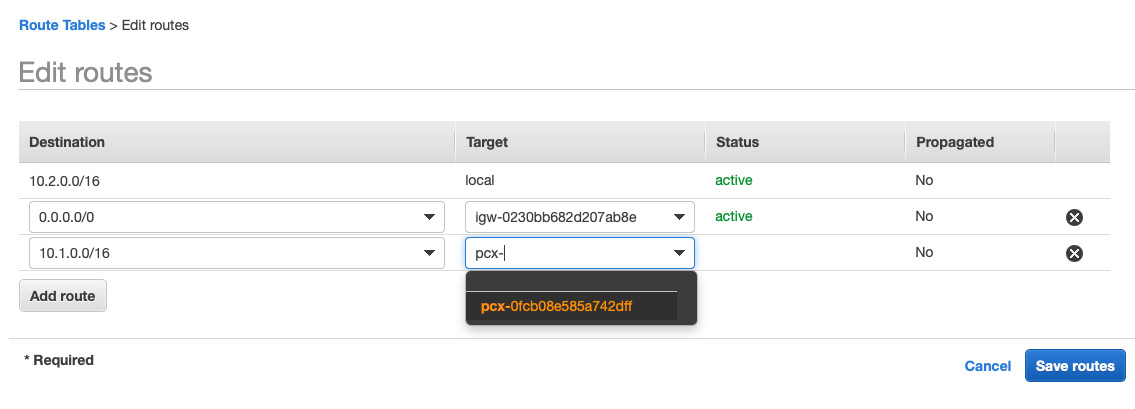
Now our green Account knows how to route traffic to our blue account and also knows which network traffic to route. But we also need to route traffic back. Head over to your blue Account and add a route 10.1.0.0/16 to the peering connection so that we can route traffic back to our green Account:
Launch EC2 Instances
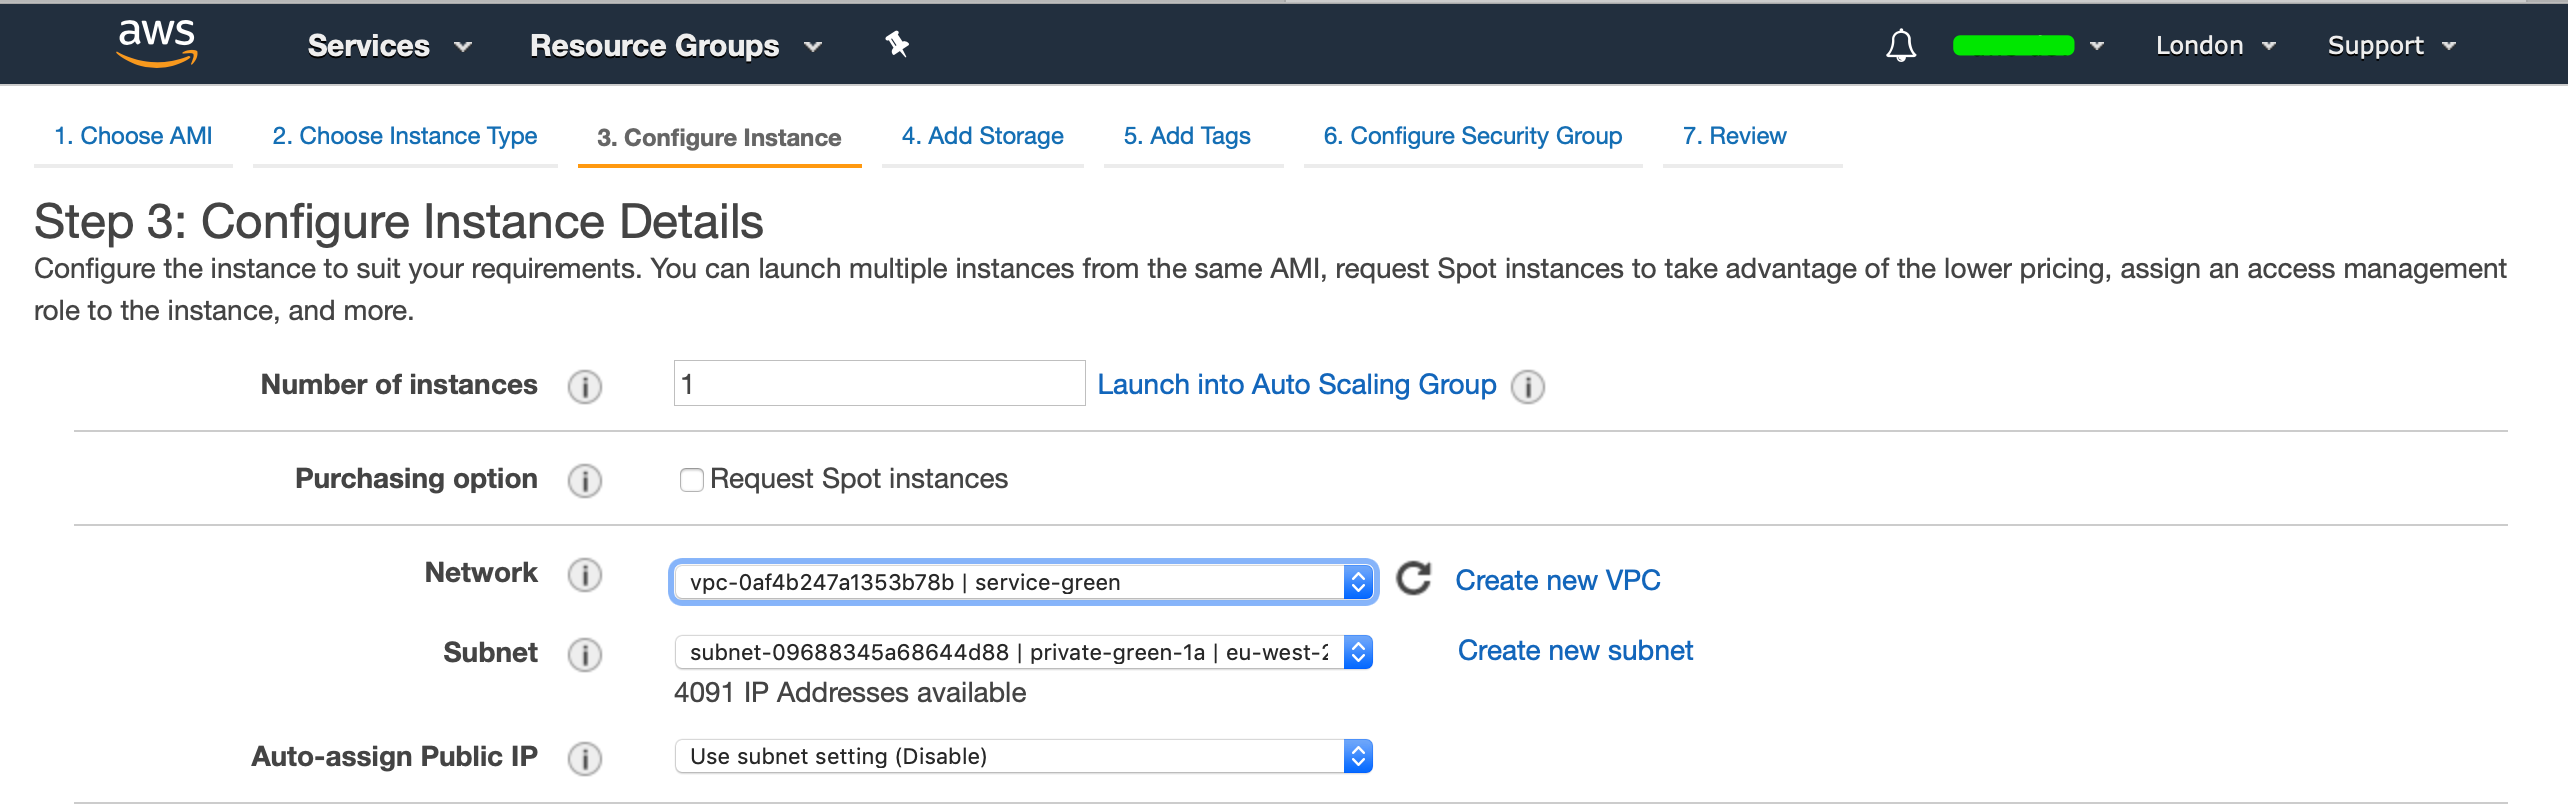
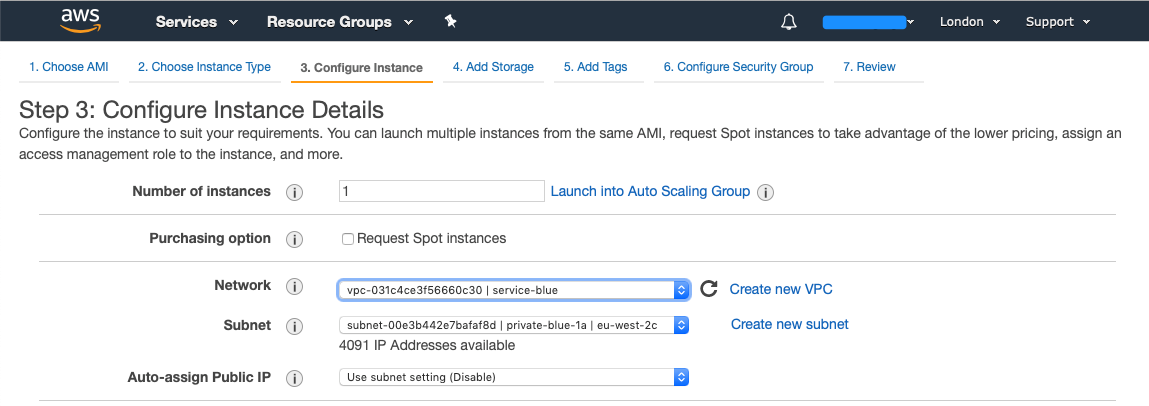
Now we want to launch a EC2 instance in each account and ensure to launch them into the VPC’s that we created, I will also be creating two new SSH keys (blue-keypair + green-keypair) And I have created a Security Group that allows ICMP and SSH from anywhere, this is purely for demonstration (always review the sources that you want to allow).
For our green account:
For our blue account:
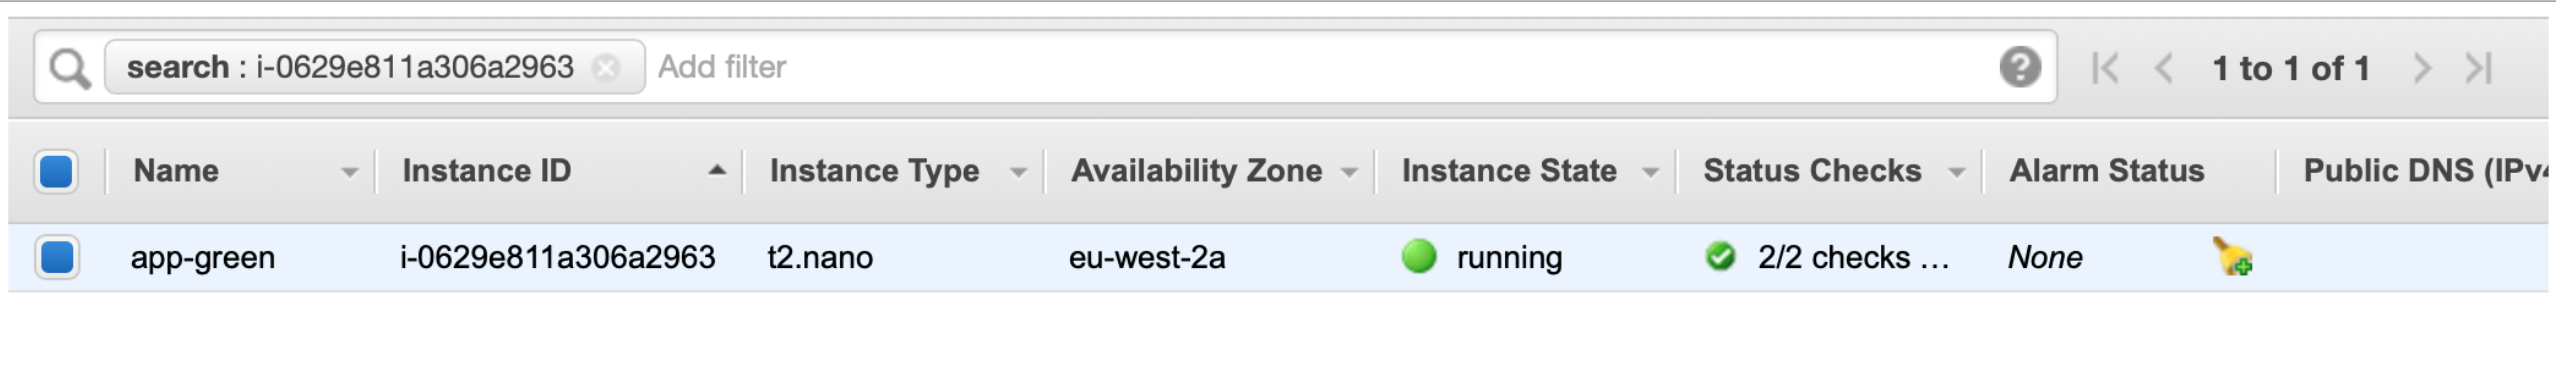
Once the EC2 instances are deployed, you should see something like this. For my green account:
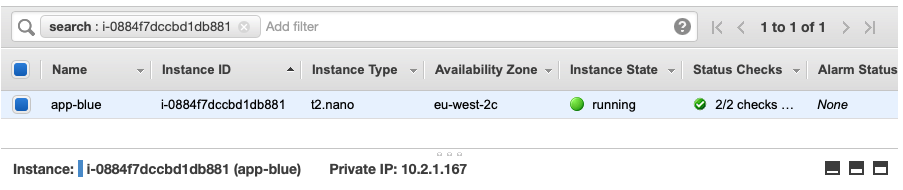
And for my blue account:
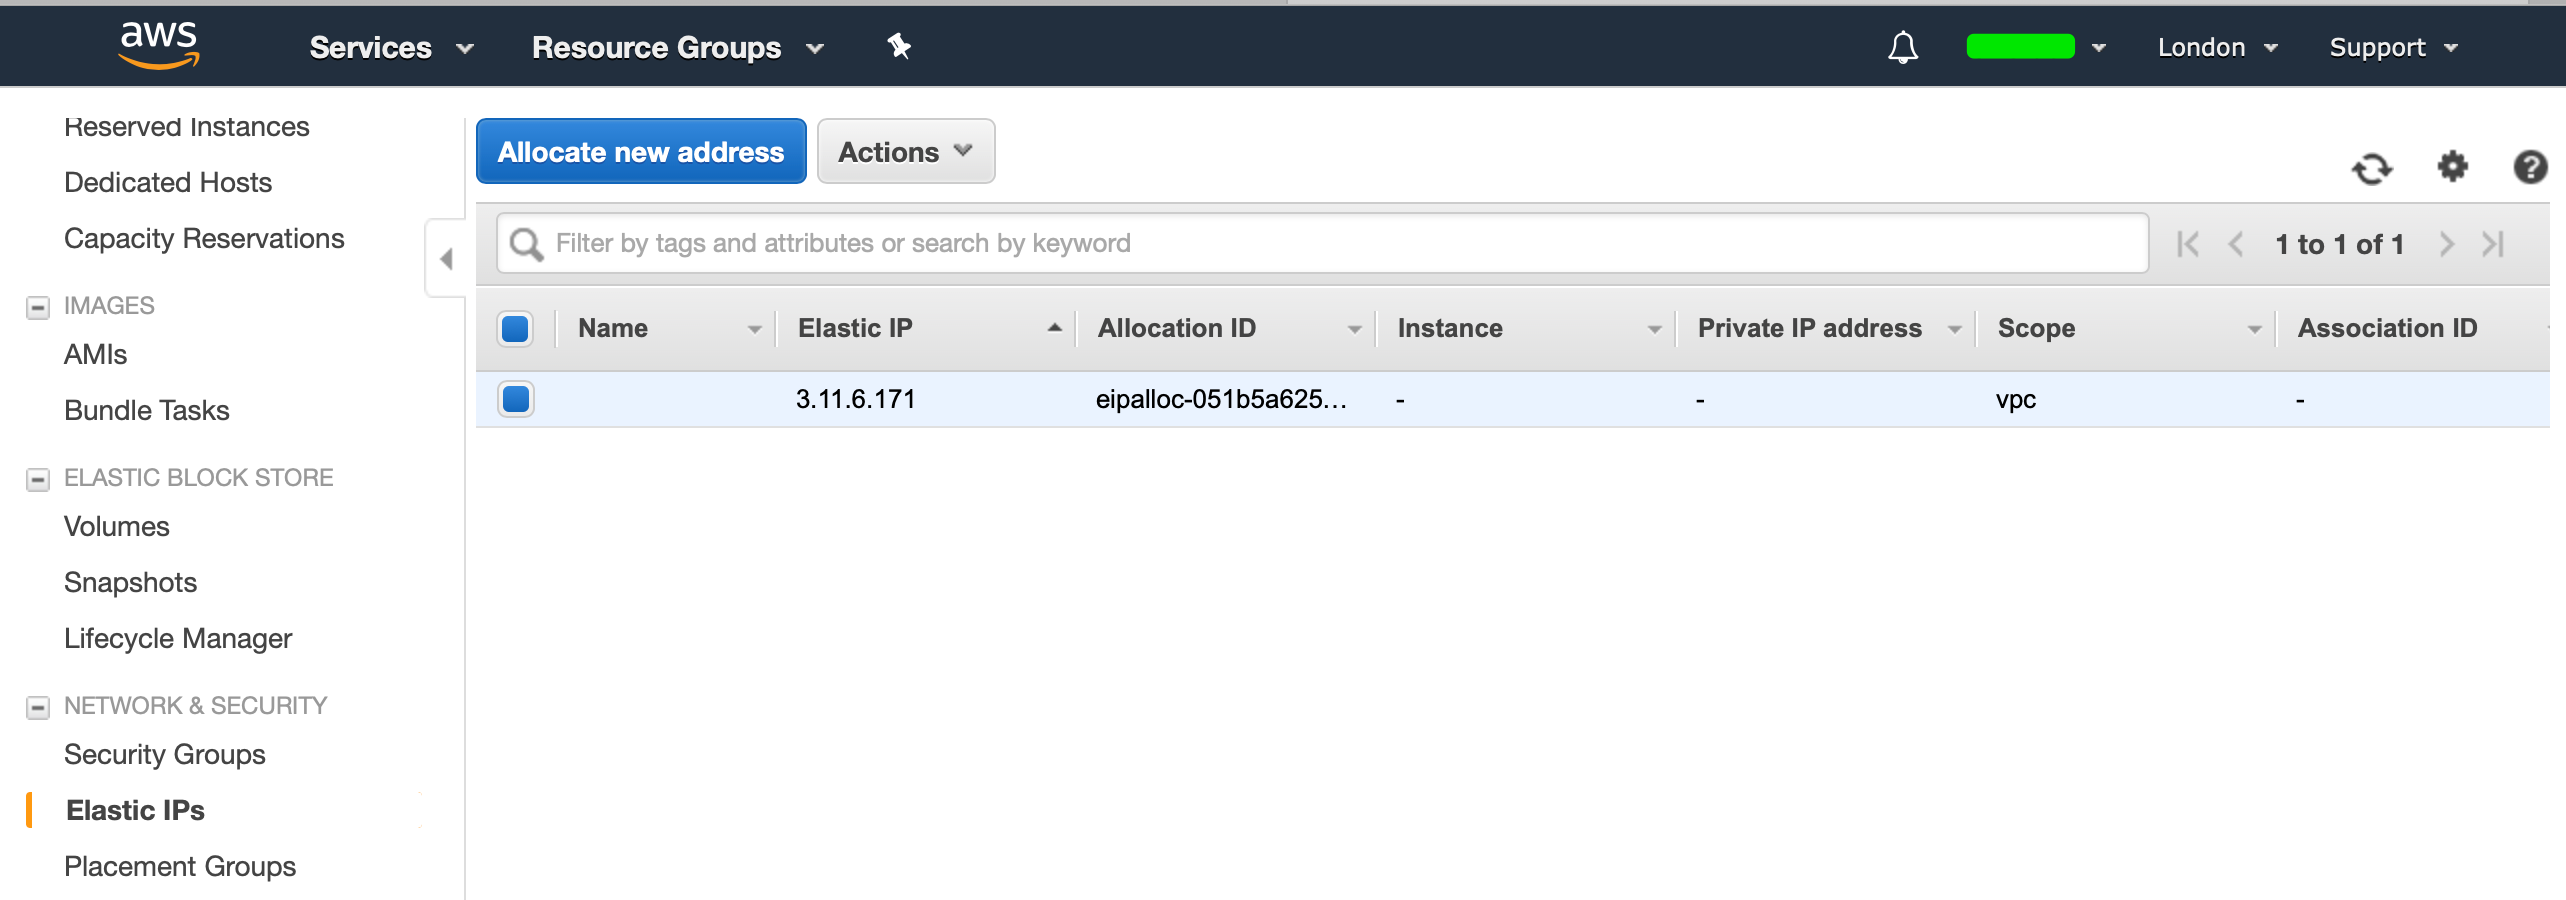
Public IP Addressing
Now that our EC2 instances are provisioned, we will be connecting to our green EC2 instances using a Public IP, therefore we need to create a Elastic IP. From EC2, select Elastic IPs and allocate a New Address:
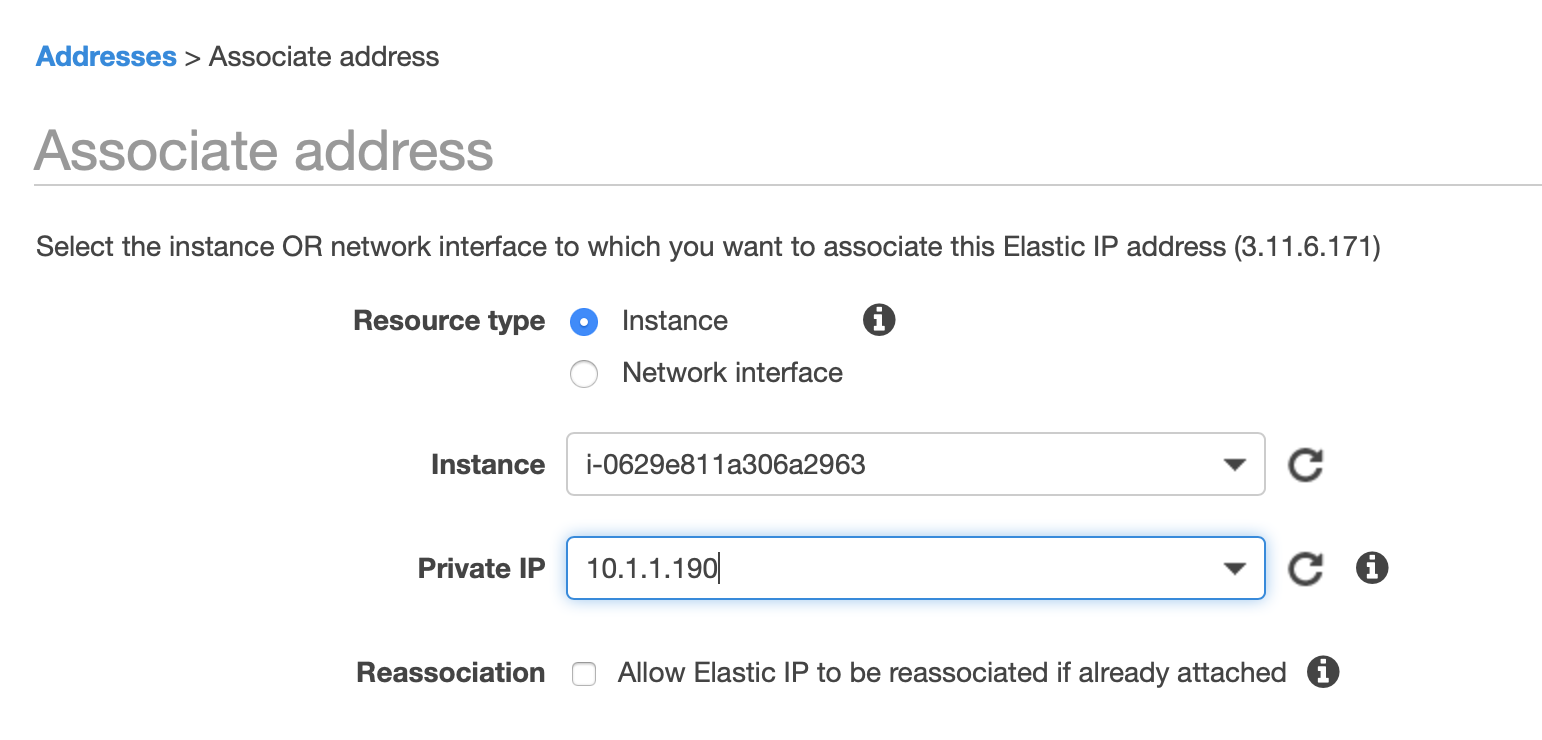
Select the IP, hit “Actions” and select “Associate Address”, then select the EC2 instance to which you want to associate the Elastic IP to:
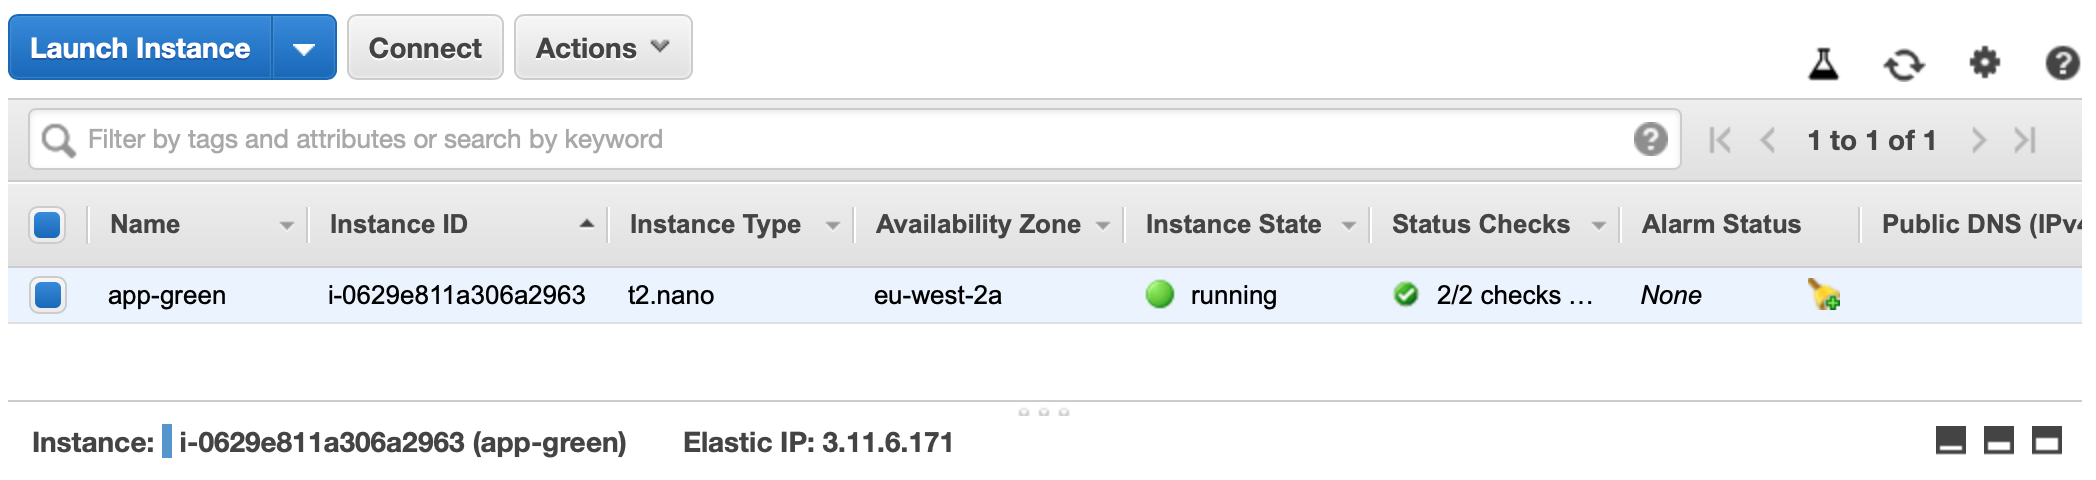
You should know see that the EC2 instance has a Public IP assigned to it:
Test Network Connectivity
From the downloaded SSH keypairs:
123
$ ls | grep keyp
blue-keypair.pem.txt
green-keypair.pem.txt
Apply the correct permissions to our keypairs so that we can use them to SSH:
$ ssh -A ec2-user@3.11.6.171

       __|  __|_  )
       _|  (     /   Amazon Linux 2 AMI
      ___|\___|___|

https://aws.amazon.com/amazon-linux-2/
[ec2-user@ip-10-1-1-190 ~]$
Now lets ping our Blue EC2 Instance which will be accessible via our VPC Peering Connection:
1234
[ec2-user@ip-10-1-1-190 ~]$ ping 10.2.1.167
PING 10.2.1.167 (10.2.1.167) 56(84) bytes of data.
64 bytes from 10.2.1.167: icmp_seq=1 ttl=255 time=0.754 ms
64 bytes from 10.2.1.167: icmp_seq=2 ttl=255 time=0.854 ms
And since we’ve allowed SSH traffic, we should be able to SSH to our instance via its Private IP Address:
12345678
[ec2-user@ip-10-1-1-190 ~]$ ssh 10.2.1.167

       __|  __|_  )
       _|  (     /   Amazon Linux 2 AMI
      ___|\___|___|

https://aws.amazon.com/amazon-linux-2/
[ec2-user@ip-10-2-1-167 ~]$
Now we have successfully created a VPC Peering Connection between Two AWS Accounts and demonstrated how to communicate to and from resources in those VPC’s.
Thank You
Let me know what you think. If you liked my content, feel free to checkout my content on ruan.dev or follow me on twitter at @ruanbekker
In this post, we will deploy a sample web application to EKS and access our application using a ELB that EKS provides us.
Deployment Manifests
We will have two manifests that we will deploy to Kubernetes, a deployment manifest that will hold the information about our application and a service manifest that will hold the information about the service load balancer.
The deployment manifest, you will notice that we are specifying that we want 3 containers, we are using labels so that our service and deployment can find each other and we are using a basic http web application that will listen on port 8000 inside the container:
The service manifest, you will notice that we are specifying type: LoadBalancer in our service manifest, this will tell EKS to provision a ELB for your application so that we can access our application from the internet.
You will see that the selector is specifying my-app which we also provided in our deployment.yml so that our service know where to find our backend application. We are also stating that the service is listening on port 80, and will forward its traffic to our deployment on port 8000:
$ kubectl apply -f deployment.yml
deployment.apps/my-hostname-app created
Deploy our service:
12
$ kubectl apply -f service.yml
service/my-hostname-app-service created
Now when we look at our deployment, we should see that 3 replicas of our application is running:
123
$ kubectl get deployments
NAME READY UP-TO-DATE AVAILABLE AGE
my-hostname-app 3/3 33 4m38s
To see the pods of that deployment, look at the pods:
12345
$ kubectl get pods
NAME                               READY   STATUS    RESTARTS   AGE
my-hostname-app-5dcd48dfc5-2j8zm   1/1     Running   0          24s
my-hostname-app-5dcd48dfc5-58vkc   1/1     Running   0          24s
my-hostname-app-5dcd48dfc5-cmjwj   1/1     Running   0          24s
As we have more than one service in our EKS cluster, we can specify the labels that we have applied on our manifests to filter what we want to see (app: my-app):
123
$ kubectl get service --selector app=my-app
NAME                      TYPE           CLUSTER-IP       EXTERNAL-IP                                                              PORT(S)        AGE
my-hostname-app-service   LoadBalancer   10.100.114.166   a460661ce089b11ea97cd06dd7513db6-669054126.eu-west-1.elb.amazonaws.com   80:30648/TCP   2m29s
As we can see EKS provisioned a ELB for us, and we can access the application by making a HTTP request:
1234567
$ curl -i http://a460661ce089b11ea97cd06dd7513db6-669054126.eu-west-1.elb.amazonaws.com
HTTP/1.1 200 OK
Date: Sat, 16 Nov 2019 18:05:27 GMT
Content-Length: 43
Content-Type: text/plain;charset=utf-8
Hostname: my-hostname-app-5dcd48dfc5-2j8zm
This will be a tutorial split up in two posts, where I will show you how to provision a EKS Cluster (Elastic Kubernetes Service) on AWS and in the next post, how to deploy a web application to your cluster (Part2 - Deploy a Web App to EKS.)
And then came EKS
As some of you may know, I’m a massive AWS fan boy, and since AWS released their managed Kubernetes service, I was quite excited to test it out. A couple of months passed and I got the opportunity to test out on-the-job as we moved to Kubernetes.
A couple of moths has passed, and serving multiple production workloads on EKS, and I am really impressed with the service.
Amazon provides a vanilla Kubernetes version, they manage the master nodes and they have a extra component called the cloud controller that runs on the master nodes, which is the aws native component that talks to other aws services (as far as I can recall)
What are we doing today
We will cover this in this post:
Topic
Deploy a EKS Cluster
View the resources to see what was provisioned on AWS
Interact with Kubernetes using kubectl
Terminate a Node and verify that the ASG replaces the node
Scale down your worker nodes
Run a pod on your cluster
In the next post we will deploy a web service to our EKS cluster.
Install Pre-Requirements
We require awscli, eksctl and kubectl before we continue. I will be installing this on MacOS, but you can have a look at the following links if you are using a different operating system:
Now we need to import our public key to EC2, note that I am referencing --profile dev which is my dev AWS profile. If you only have one default profile, you can use --profile default:
$ eksctl --profile dev --region eu-west-1 create cluster --name my-eks-cluster --version 1.14 --nodes 3 --node-type t2.small --ssh-public-key eks
[ℹ] eksctl version 0.9.0
[ℹ] using region eu-west-1
[ℹ] setting availability zones to [eu-west-1a eu-west-1b eu-west-1c][ℹ] subnets for eu-west-1a - public:192.168.0.0/19 private:192.168.96.0/19
[ℹ] subnets for eu-west-1b - public:192.168.32.0/19 private:192.168.128.0/19
[ℹ] subnets for eu-west-1c - public:192.168.64.0/19 private:192.168.160.0/19
[ℹ] nodegroup "ng-f27f560e" will use "ami-059c6874350e63ca9"[AmazonLinux2/1.14][ℹ] using Kubernetes version 1.14
[ℹ] creating EKS cluster "my-eks-cluster" in "eu-west-1" region
[ℹ] will create 2 separate CloudFormation stacks for cluster itself and the initial nodegroup
[ℹ]if you encounter any issues, check CloudFormation console or try 'eksctl utils describe-stacks --region=eu-west-1 --cluster=my-eks-cluster'[ℹ] CloudWatch logging will not be enabled for cluster "my-eks-cluster" in "eu-west-1"[ℹ] you can enable it with 'eksctl utils update-cluster-logging --region=eu-west-1 --cluster=my-eks-cluster'[ℹ] Kubernetes API endpoint access will use default of {publicAccess=true, privateAccess=false}for cluster "my-eks-cluster" in "eu-west-1"[ℹ]2 sequential tasks: { create cluster control plane "my-eks-cluster", create nodegroup "ng-f27f560e"}[ℹ] building cluster stack "eksctl-my-eks-cluster-cluster"[ℹ] deploying stack "eksctl-my-eks-cluster-cluster"[ℹ] building nodegroup stack "eksctl-my-eks-cluster-nodegroup-ng-f27f560e"[ℹ] --nodes-min=3 was set automatically for nodegroup ng-f27f560e
[ℹ] --nodes-max=3 was set automatically for nodegroup ng-f27f560e
[ℹ] deploying stack "eksctl-my-eks-cluster-nodegroup-ng-f27f560e"[+] all EKS cluster resources for"my-eks-cluster" have been created
[+] saved kubeconfig as "/Users/ruan/.kube/config"[ℹ] adding identity "arn:aws:iam::000000000000:role/eksctl-my-eks-cluster-nodegroup-n-NodeInstanceRole-SNVIW5C3J3SM" to auth ConfigMap
[ℹ] nodegroup "ng-f27f560e" has 0 node(s)[ℹ] waiting for at least 3 node(s) to become ready in "ng-f27f560e"[ℹ] nodegroup "ng-f27f560e" has 3 node(s)[ℹ] node "ip-192-168-42-186.eu-west-1.compute.internal" is ready
[ℹ] node "ip-192-168-75-87.eu-west-1.compute.internal" is ready
[ℹ] node "ip-192-168-8-167.eu-west-1.compute.internal" is ready
[ℹ] kubectl command should work with "/Users/ruan/.kube/config", try 'kubectl get nodes'[+] EKS cluster "my-eks-cluster" in "eu-west-1" region is ready
Now that our EKS cluster has been provisioned, let’s browse through our AWS Management Console to understand what was provisioned.
View the Provisioned Resources
If we have a look at the Cloudformation stacks, we can see the two stacks that I mentioned previously:
Navigating to our EC2 Instances dashboard, we can see the three worker nodes that we provisioned. Remember that AWS manages the master nodes and we cant see them.
We have a ASG (Auto Scaling Group) associated with our worker nodes, nodegroup. We can make use of autoscaling and also have desired state, so we will test this out later where we will delete a worker node and verify if it gets replaced:
Navigate using Kubectl:
Eksctl already applied the kubeconfig to ~/.kube/config, so we can start using kubectl. Let’s start by viewing the nodes:
12345
$ kubectl get nodes
NAME                                           STATUS   ROLES    AGE     VERSION
ip-192-168-42-186.eu-west-1.compute.internal   Ready    <none>   8m50s   v1.14.7-eks-1861c5
ip-192-168-75-87.eu-west-1.compute.internal    Ready    <none>   8m55s   v1.14.7-eks-1861c5
ip-192-168-8-167.eu-west-1.compute.internal    Ready    <none>   8m54s   v1.14.7-eks-1861c5
Viewing our pods from our kube-system namespace (we dont have any pods in our default namespace at the moment):
$ kubectl get services --all-namespaces
NAMESPACE     NAME         TYPE        CLUSTER-IP    EXTERNAL-IP   PORT(S)         AGE
default       kubernetes   ClusterIP   10.100.0.1    <none>        443/TCP         19m
kube-system   kube-dns     ClusterIP   10.100.0.10   <none>        53/UDP,53/TCP   19m
Testing the ASG
Let’s view our current nodes in our cluster, then select the first node, delete it and verify if the ASG replaces that node.
First, view the nodes and select one node’s address:
12345
$ kubectl get nodes
NAME                                           STATUS   ROLES    AGE   VERSION
ip-192-168-42-186.eu-west-1.compute.internal   Ready    <none>   37m   v1.14.7-eks-1861c5
ip-192-168-75-87.eu-west-1.compute.internal    Ready    <none>   37m   v1.14.7-eks-1861c5
ip-192-168-8-167.eu-west-1.compute.internal    Ready    <none>   37m   v1.14.7-eks-1861c5
Use the awscli to lookup the EC2 instance id, as we will need this id to delete the node:
12
$ aws --profile dev ec2 describe-instances --query 'Reservations[*].Instances[?PrivateDnsName==`ip-192-168-42-186.eu-west-1.compute.internal`].[InstanceId][]' --output text
i-0d016de17a46d5178
Now that we have the EC2 instance id, delete the node:
Now that we have deleted the EC2 instance, view the nodes and you will see the node has been terminated:
1234
$ kubectl get nodes
NAME                                          STATUS   ROLES    AGE   VERSION
ip-192-168-75-87.eu-west-1.compute.internal   Ready    <none>   41m   v1.14.7-eks-1861c5
ip-192-168-8-167.eu-west-1.compute.internal   Ready    <none>   41m   v1.14.7-eks-1861c5
Allow about a minute so that the ASG can replace the node, and when you list again you will see that the ASG replaced the node :
12345
$ kubectl get nodes
NAME                                          STATUS   ROLES    AGE   VERSION
ip-192-168-42-61.eu-west-1.compute.internal   Ready    <none>   50s   v1.14.7-eks-1861c5
ip-192-168-75-87.eu-west-1.compute.internal   Ready    <none>   42m   v1.14.7-eks-1861c5
ip-192-168-8-167.eu-west-1.compute.internal   Ready    <none>   42m   v1.14.7-eks-1861c5
/ # exitSession ended, resume using 'kubectl attach my-busybox-pod -c my-busybox-pod -i -t'command when the pod is running
pod "my-busybox-pod" deleted
Scaling Nodes
While I will not be covering auto-scaling in this post, we can manually scale the worker node count. Let’s scale it down to 1 node.
First we need to get the EKS cluster name:
123
$ eksctl --profile dev --region eu-west-1 get clusters
NAME      REGION
my-eks-cluster    eu-west-1
Then we need the node group id:
123
$ eksctl --profile dev --region eu-west-1 get nodegroup --cluster my-eks-cluster
CLUSTER       NODEGROUP   CREATED         MIN SIZE    MAX SIZE    DESIRED CAPACITY    INSTANCE TYPE   IMAGE ID
my-eks-cluster    ng-f27f560e 2019-11-16T16:55:41Z    3       3       3           t2.small    ami-059c6874350e63ca9
Now that we have the node group id, we can scale the node count:
1234
$ eksctl --profile dev --region eu-west-1 scale nodegroup --cluster my-eks-cluster --nodes 1 ng-f27f560e

[ℹ]  scaling nodegroup stack "eksctl-my-eks-cluster-nodegroup-ng-f27f560e" in cluster eksctl-my-eks-cluster-cluster
[ℹ]  scaling nodegroup, desired capacity from 3 to 1, min size from 3 to 1
Now when we use kubectl to view the nodes, we will see we only have 1 worker node:
123
$ kubectl get nodes
NAME                                          STATUS   ROLES    AGE   VERSION
ip-192-168-8-167.eu-west-1.compute.internal   Ready    <none>   73m   v1.14.7-eks-1861c5
Clean Up
If you want to follow along deploying a web application to your EKS cluster before we terminate the cluster, have a look at Part 2 - EKS Tutorial before continuing.
Once you are ready to terminate your EKS cluster, you can go ahead and terminate the cluster:
123456789101112
$ eksctl --profile dev --region eu-west-1 delete cluster --name my-eks-cluster
[ℹ] eksctl version 0.9.0
[ℹ] using region eu-west-1
[ℹ] deleting EKS cluster "my-eks-cluster"[+] kubeconfig has been updated
[ℹ] cleaning up LoadBalancer services
[ℹ]2 sequential tasks: { delete nodegroup "ng-f27f560e", delete cluster control plane "my-eks-cluster"[async]}[ℹ] will delete stack "eksctl-my-eks-cluster-nodegroup-ng-f27f560e"[ℹ] waiting for stack "eksctl-my-eks-cluster-nodegroup-ng-f27f560e" to get deleted
[ℹ] will delete stack "eksctl-my-eks-cluster-cluster"[+] all cluster resources were deleted
Further Reading on Kubernetes
This is one amazing resource that covers a lot of kubernetes topics and will help you throughout your EKS journey:
- EKSWorkshop
Thank You
Let me know what you think. If you liked my content, feel free to checkout my content on ruan.dev or follow me on twitter at @ruanbekker
I discovered a Docker image called LambCi that allows you to test lambda functions locally on docker and wanted to share with you how it works.
Python Lambda Function
We will create a basic lambda function to demonstrate how it works.
1234567891011121314151617
$ mkdir task
$ cat > task/lambda_function.py << EOF
import json

def lambda_handler(event, context):
    if event:

        try:
            event['name']
            name = event['name']
            output_string = 'My name is {}'.format(name.capitalize())

        except KeyError:
            output_string = 'A name was not defined in the event payload'

    return output_string
EOF
Now that we’ve created the function, run the docker container with the parameters of the functions handler method and the event parameters:
12345
$ docker run --rm -v "$PWD/task":/var/task lambci/lambda:python3.7 lambda_function.lambda_handler '{"name": "ruan"}'
START RequestId: 70025895-1233-1362-8006-c2784b5d80b6 Version: $LATEST
END RequestId: 70025895-1233-1362-8006-c2784b5d80b6
REPORT RequestId: 70025895-1233-1362-8006-c2784b5d80b6    Duration: 7.51 ms   Billed Duration: 100 ms Memory Size: 1536 MB    Max Memory Used: 23 MB
"My name is Ruan"
And another call:
12345
$ docker run --rm -v "$PWD/task":/var/task lambci/lambda:python3.7 lambda_function.lambda_handler '{"nam": "ruan"}'
START RequestId: f7ab2e97-05db-1184-a009-11b92638534f Version: $LATEST
END RequestId: f7ab2e97-05db-1184-a009-11b92638534f
REPORT RequestId: f7ab2e97-05db-1184-a009-11b92638534f    Duration: 5.32 ms   Billed Duration: 100 ms Memory Size: 1536 MB    Max Memory Used: 23 MB
"A name was not defined in the event payload"
This means that you can secure your Traefik backend services by using Google for authentication to access your backends. Authorizing who can logon, get’s managed on the forward proxy.
If you have not worked with Traefik, Traefik is one amazing dynamic and modern reverse proxy / load balancer built for micro services.
What are we doing today
In this demonstration we will setup a new google application, setup the forward-auth proxy and spin up a service that we will use google to authenticate against to access our application on Docker Swarm.
Step by step tutorial has been published on my sysadmins blog, read more here
Thank You
Let me know what you think. If you liked my content, feel free to checkout my content on ruan.dev or follow me on twitter at @ruanbekker
The password that you require on login will be prompted in the output:
1234567891011
INFO  code-server v1.1156-vsc1.33.1
INFO  Additional documentation: http://github.com/cdr/code-server
INFO  Initializing {"data-dir":"/data","extensions-dir":"/data/extensions","working-dir":"/code","log-dir":"/root/.cache/code-server/logs/20190914105631217"}
INFO  Starting shared process [1/5]...
INFO  Starting webserver... {"host":"0.0.0.0","port":8443}
INFO
INFO  Password: 4b050c4fa0ef109d53c10d9f
INFO
INFO  Started (click the link below to open):
INFO  https://localhost:8443/
INFO  Connected to shared process
Access vscode on https://localhost:8443/ and after you accepted the self-signed certificate warning, you will be presented with the login page:
After you have logged a example of creating a python file will look like this:
Currently I have only python available on docker hub with the requests and flask packages available. But you can fork the repository and add the upstream or packages of your choice.
In AWS S3 you can make use of lifecycle policies to manage the lifetime of your objects stored in S3.
In this tutorial, I will show you how to delete objects automatically from S3 after 30 days.
Navigate to your Bucket
Head over to your AWS S3 bucket where you want to delete objects after they have been stored for 30 days:
Lifecycle Policies
Select “Management” and click on “Add lifecycle rule”:
Set a rule name of choice and you have the option to provide a prefix if you want to delete objects based on a specific prefix. I will leave this blank as I want to delete objects in the root level of the bucket. Head to next on the following section:
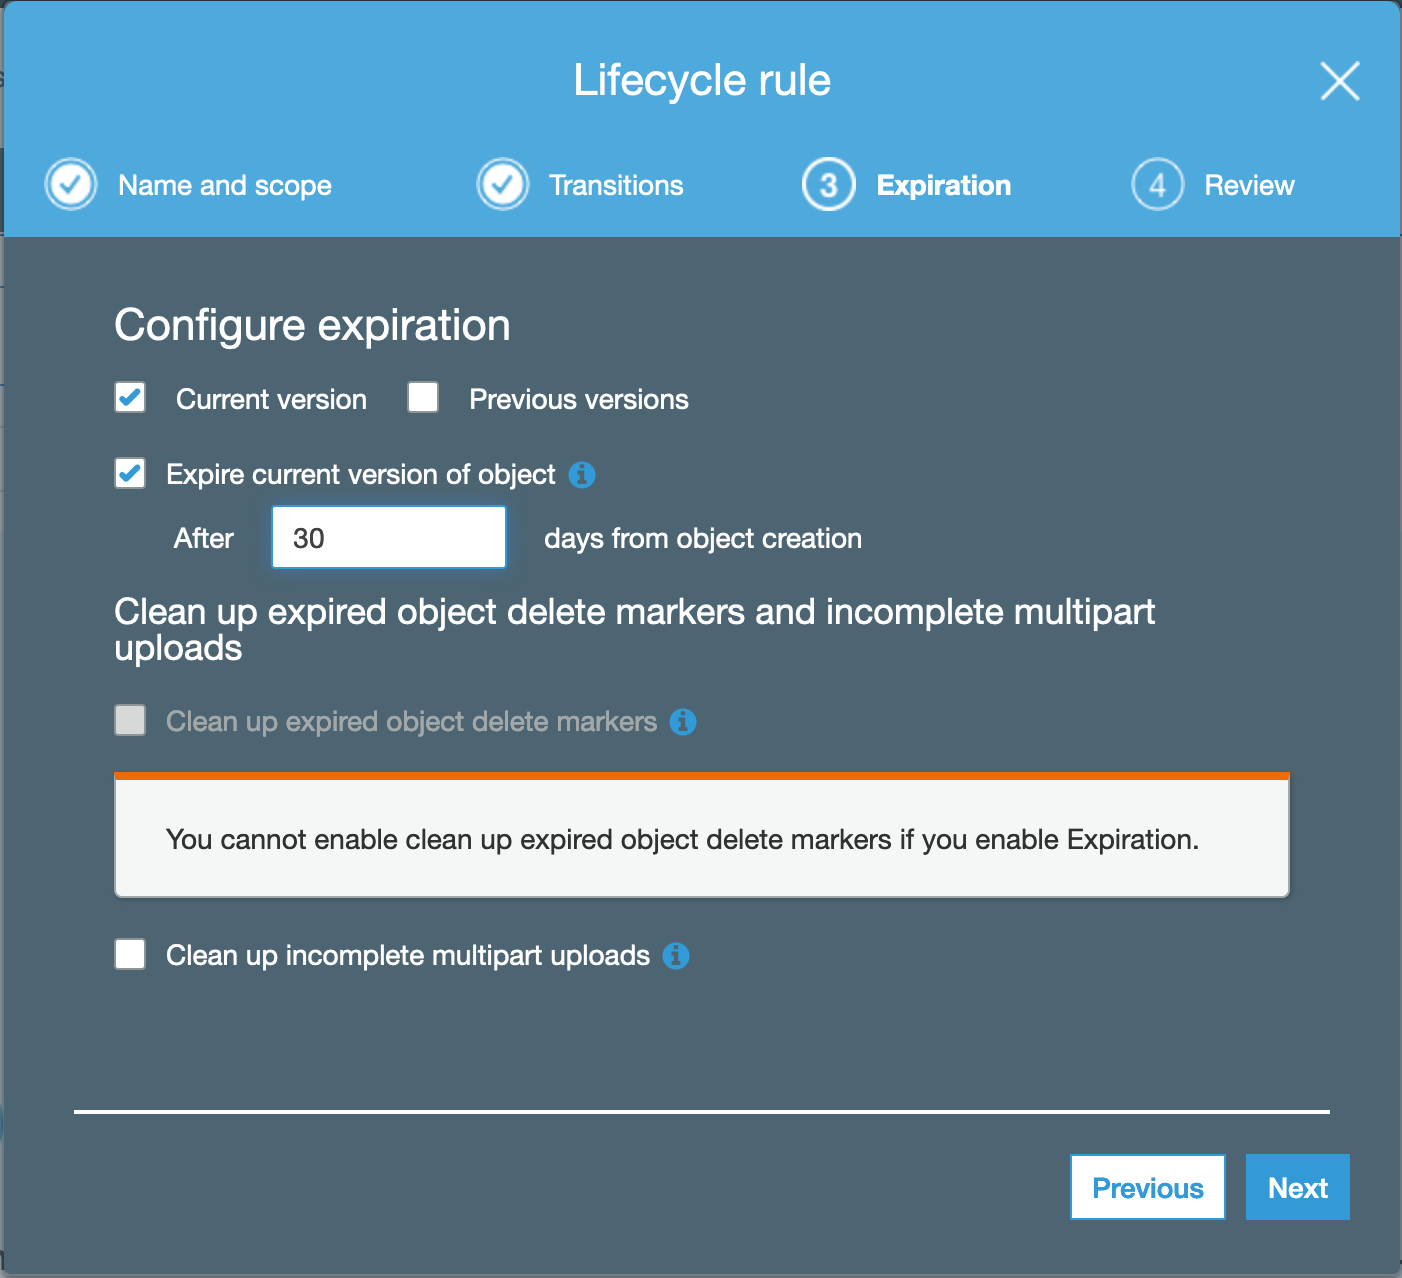
From the “Transitions” section, configure the transition section, by selecting to expire the current version of the object after 30 days:
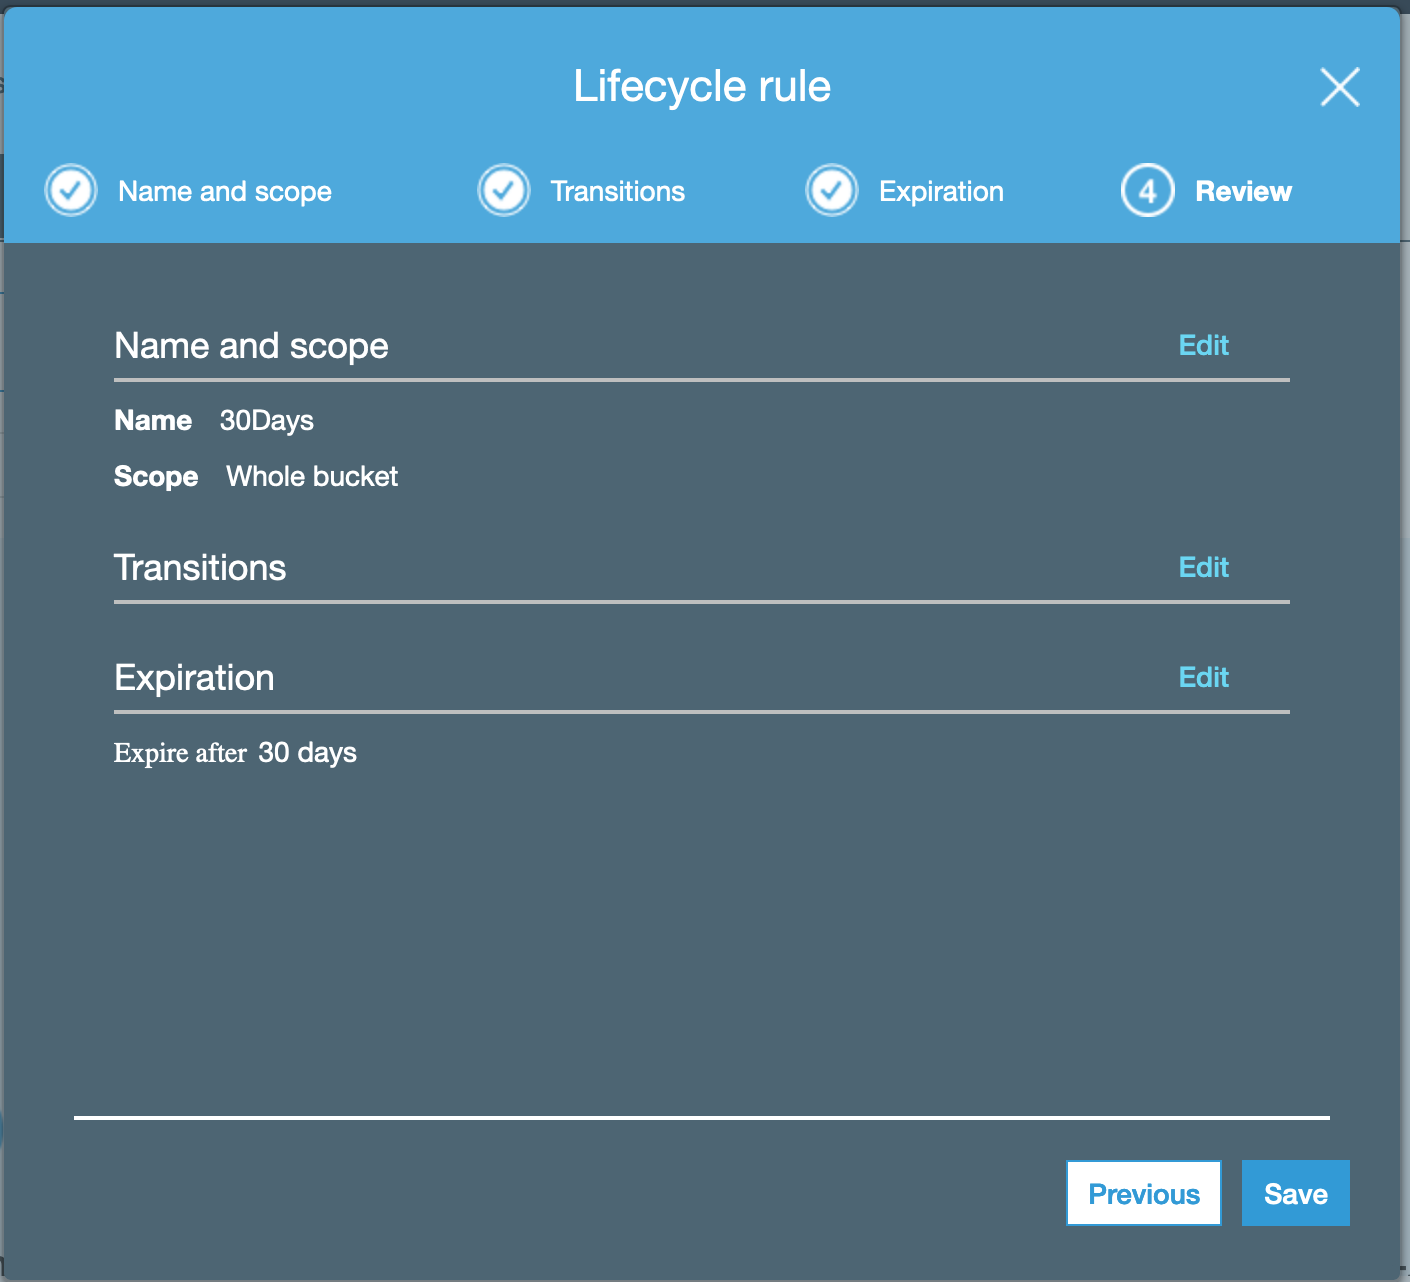
Review the configuration:
When you select “Save”, you should be returned to the following section:
Housecleaning on your S3 Bucket
Now 30 days after you created objects on AWS S3, they will be deleted.
In this tutorial I will show you how to reindex daily indices to a monthly index on Elasticsearch using Logstash
Use Case
In this scenario we have filebeat indices which have a low document count and would like to aggregate the daily indices into a bigger index, which will be a monthly index. So reindexing from "filebeat-2019.08.*" to "filebeat-monthly-2019.08".
Overview of our Setup
Here we can see all the indices that we would like to read from"
1234567
$ curl 10.37.117.130:9200/_cat/indices/filebeat-2019.08.*?v
health status index               uuid                   pri rep docs.count docs.deleted store.size pri.store.size
green  open   filebeat-2019.08.28 qoKiHUjQT5eNVF_wjLi9fA   5   1         17            0    295.4kb        147.7kb
green  open   filebeat-2019.08.27 8PWngqFdRPKLEnrCCiw6xA   5   1        301            0    900.9kb          424kb
green  open   filebeat-2019.08.29 PiG2ma8zSbSt6sSg7soYPA   5   1         24            0    400.2kb          196kb
green  open   filebeat-2019.08.31 XSWZvqQDR0CugD23y6_iaA   5   1         27            0    451.5kb        222.1kb
green  open   filebeat-2019.08.30 u_Hr9fA5RtOtpabNGUmSpw   5   1         18            0    326.1kb          163kb
As elasticsearch create 5 primary shards by default, I want to override this behavior to creating 3 primary shards. I will be using a template, so whenever a index get created with the index pattern `“-monthly-”, it will apply the settings to create 3 primary shards and 1 replica shards:
Our logstash configuration which we will use, will read from elasticsearch and the index pattern which we want to read from. Then our ouput configuration instructs where to write the data to:
$ curl 10.37.117.130:9200/_cat/indices/*filebeat-*08*?v
health status index                    uuid                   pri rep docs.count docs.deleted store.size pri.store.size
green  open   filebeat-2019.08.28      qoKiHUjQT5eNVF_wjLi9fA   5   1         17            0    295.4kb        147.7kb
green  open   filebeat-2019.08.29      PiG2ma8zSbSt6sSg7soYPA   5   1         24            0    400.2kb          196kb
green  open   filebeat-2019.08.30      u_Hr9fA5RtOtpabNGUmSpw   5   1         18            0    326.1kb          163kb
green  open   filebeat-2019.08.27      8PWngqFdRPKLEnrCCiw6xA   5   1        301            0    900.9kb          424kb
green  open   filebeat-2019.08.31      XSWZvqQDR0CugD23y6_iaA   5   1         27            0    451.5kb        222.1kb
green  open   filebeat-monthly-2019.08 VZD8iDjfTfeyP-SWB9l2Pg   3   1        387            0    577.8kb        274.7kb
Once we are happy with what we are seeing, we can delete the source data:
If you want to deploy the stack with no pre-configured dashboards, you would need to use ./docker-compose.html, but in this case we will deploy the stack with pre-configured dashboards.
Set the domain and deploy the stack:
1234567891011121314151617
$ docker stack deploy -c alt_versions/docker-compose_http_with_dashboards.yml mon

Creating network private
Creating config mon_grafana_config_datasource
Creating config mon_grafana_dashboard_prometheus
Creating config mon_grafana_dashboard_docker
Creating config mon_grafana_dashboard_nodes
Creating config mon_grafana_dashboard_blackbox
Creating config mon_alertmanager_config
Creating config mon_prometheus_config
Creating config mon_prometheus_rules
Creating service mon_blackbox-exporter
Creating service mon_alertmanager
Creating service mon_prometheus
Creating service mon_grafana
Creating service mon_cadvisor
Creating service mon_node-exporter
The endpoints is configured as ${service_name}.${DOMAIN} so you will be able to access grafana on http://grafana.localhost as showed in my use-case.
Use docker stack services mon to see if all the tasks has checked into its desired count then access grafana on http://grafana.${DOMAIN}
Accessing Grafana
Access Grafana on http://grafana.${DOMAIN} and logon with the user admin and the password admin:
You will be asked to reset the password:
You will then be directed to the ui:
From the top, when you list dashboards, you will see the 3 dashboards that was pre-configured:
When looking at the Swarm Nodes Dashboard:
The Swarm Services Dashboard:
Exploring Metrics in Prometheus
Access prometheus on http://prometheus.${DOMAIN} and from the search input, you can start exploring though all the metrics that is available in prometheus:
If we search for node_load15 and select graph, we can have a quick look on how the 15 minute load average looks like for the node where the stack is running on: