In this tutorial we will setup a basic pipeline in drone to make use of service containers, we will provision localstack so that we can provision AWS mock services.
We will create a kinesis stream on localstack, when the service is up, we will create a stream, put 100 records in the stream, read them from the stream and delete the kinesis stream.
Gitea and Drone Stack
If you don’t have the stack setup, have a look at this post where I go into detail on how to get that setup.
Create the Drone Config
In gitea, I have created a new git repository and created my drone config as .drone.yml with this pipeline config:
To explain what we are doing, we are bringing up localstack as a service container, then using the aws cli tools we point to the localstack kinesis endpoint, creating a kinesis stream, put 100 records to the stream, then we read from the stream and delete thereafter.
Trigger the Pipeline
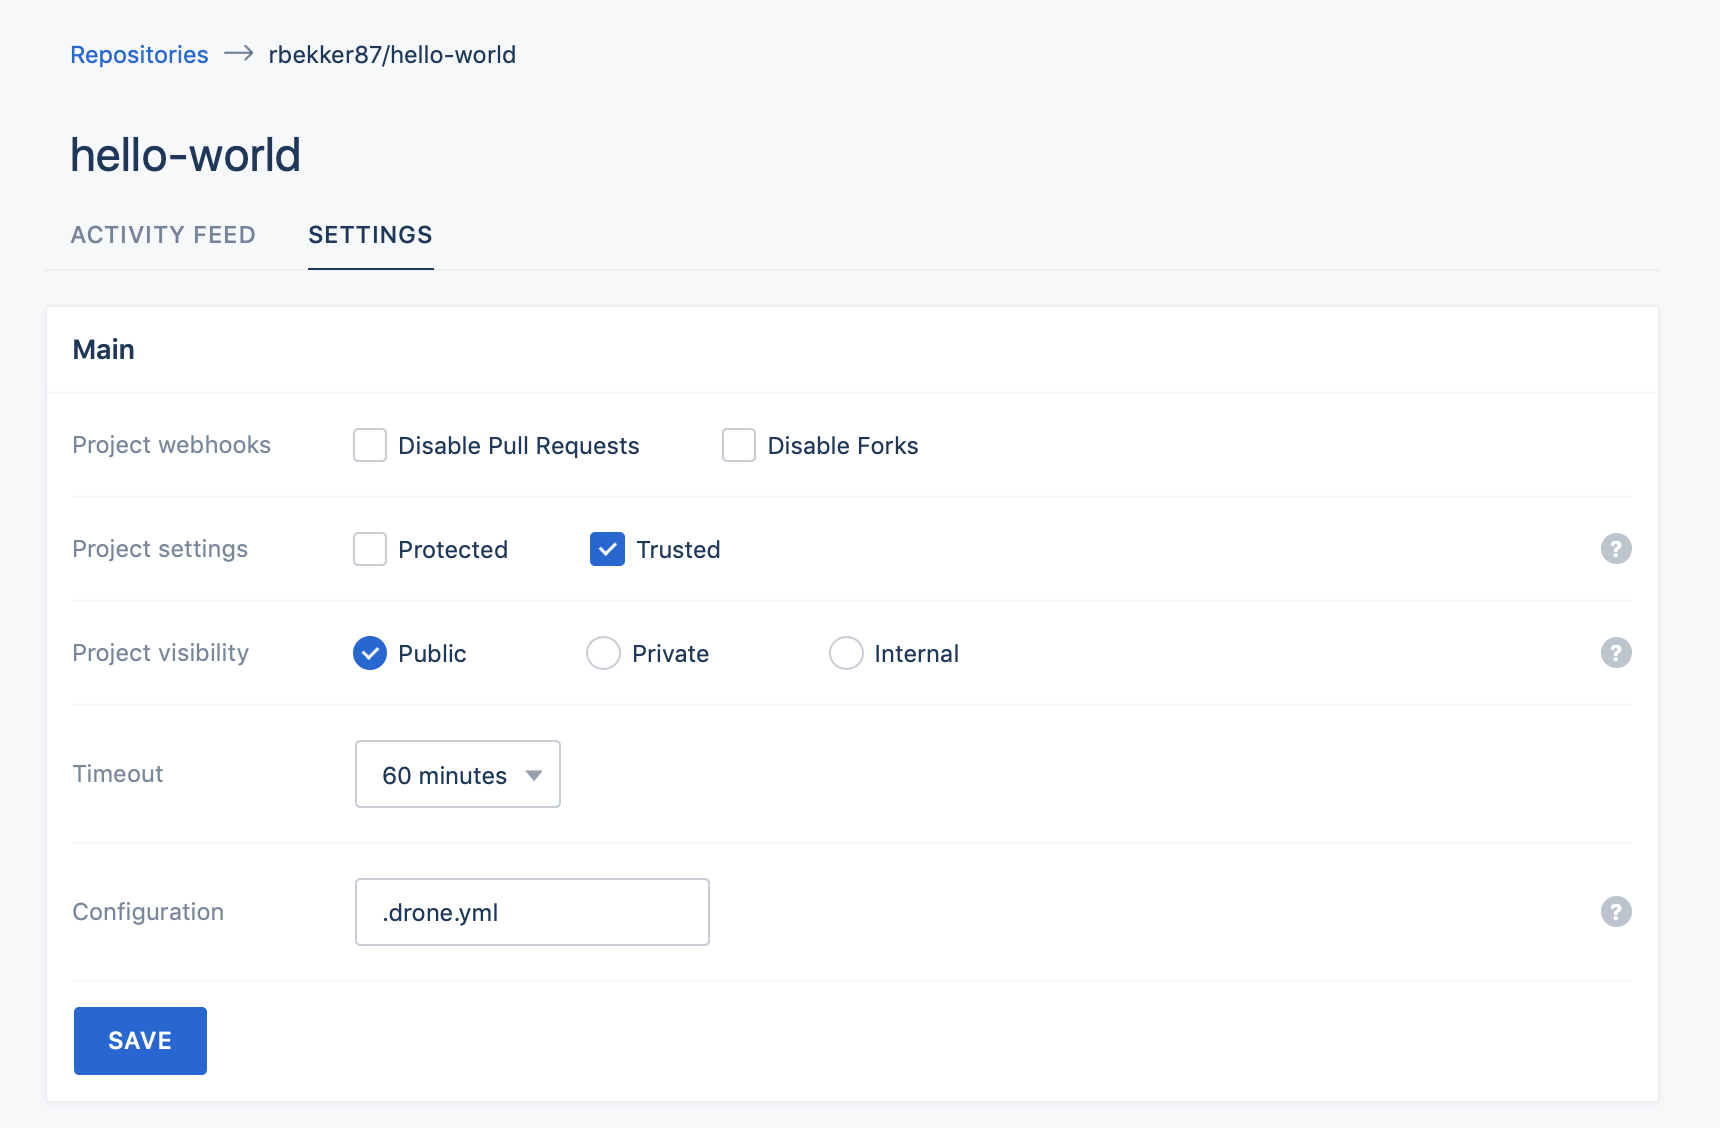
Then I head to drone activate my new git repository and select the repository as “Trusted”. I commited a dummy file to trigger the pipeline and it should look like this:
Drone services allow you to run a service container and will be available for the duration of your build, which is great if you want a ephemeral service to test your applications against.
Today we will experiment with services on drone and will deploy a k3s (a kubernetes distribution built by rancher) cluster as a drone service and interact with our cluster using kubectl.
I will be using multiple pipelines, where we will first deploy our “dev cluster”, when it’s up, we will use kubectl to interact with the cluster, once that is done, we will deploy our “staging cluster” and do the same.
This is very basic and we are not doing anything special, but this is a starting point and you can do pretty much whatever you want.
What is Drone
If you are not aware of Drone, Drone is a container-native continious deliver platform built on Go and you can check them out here: github.com/drone
Setup Gitea and Drone
If you don’t have the stack setup, have a look at this post where I go into detail on how to get that setup.
Create your Git Repo
Go ahead and create a git repo, you can name it anything, then it should look something like this:
Create a drone configuration, .drone.yml my pipeline will look like this:
In this pipeline you can see that the staging pipeline depends on dev, so dev pipeline will start by creating the k3s service container, once its up I am using a step just to sleep for 30 seconds to allow it to boot.
Then I have defined a volume that will be persistent during the build time, which we will use to dump our kubeconfig file and update the hostname of our kubernetes endpoint. Once that is done our last step will set that file to the environment and use kubectl to interact with kubernetes.
Once our dev pipeline has finished, our staging pipeline will start.
Activate the Repo in Drone
Head over to drone on port 80 and activate the newly created git repo (and make sure that you select “Trusted”) and you will see the activity feed being empty:
Commit a dummy file to git and you should see your pipeline being triggered:
Once your pipeline has finished and everything succeeded, you should see the output of your nodes in your kubernetes service container:
As I mentioned earlier, we are not doing anything special but service containers allows us to do some awesome things.
Thank you for reading. If you like my content, feel free to visit me at ruan.dev or follow me on twitter at @ruanbekker
This post will show how to setup gitea and drone on a docker host with docker-compose. The drone example in this tutorial will be very basic, but in future posts I will focus more on pipeline examples using drone.
As this post I will use to link back for those who needs to setup the stack first.
Verify the environment variables and adjust the defaults if you want to change something, if you want your git clone ssh url to point to a dns name as well as the url for gitea, then change the following to your dns:
The default port for Gitea in this setup is port 3000:
Initial configuration will be pre-populated from our environment variables:
From the additional settings section, create your admin user (this user is referenced in our docker-compose as well)
Because I am using gitea as my hostname, you will be redirected to http://gitea:3000/user/login, if you don’t have a host entry setup for that it will fail, but you can just replace your servers ip in the request url and it will take you to the login screen, and after logging on, you should see this screen:
Access drone on port 80, you will be directed to the login screen:
Use the same credentials that you have used to sign up with gitea, and after logging on, you should see this:
If ever your login does not work, just delete the drone access token on gitea (gitea:3000/user/settings/applications)
Create a Git Repository
On gitea, create a new git repository:
You should now see your git repository:
Create a new file .drone.yml with the following content:
Commit the file in your git repository and head over to drone (which should be available on port 80) and select “Sync”, after a couple of seconds you should see the git repository:
Select “Activate” and “Activate Repository”, on the next screen select “Trusted”, verify that the configuration file name is the same as which we created, then select save:
Trigger the Build
If you click on “Activity Feed” you should see a empty feed. Head back to git and commit a dummy file to trigger the build to start. I will create a file name trigger with the value as 1 for my dummy file.
After committing the file, you will see on drone that the build started:
When we select the build, you can see we have a clone step and the step that we defined to echo “hello-world”:
Thank You
This was a basic introduction for gitea and drone, but I will use this post in conjunction with more gitea examples in the future.
Today we will look at Thanos, a open source, highly available prometheus setup with long term storage capabilites, that we will run on docker to simplify the setup.
Note that running this proof of concept does not make it highly available as we will run everything on one host, but it will give you a feel what Thanos is about. In a future post, I will setup Thanos in a multi node environment.
Prometheus
If you are not familiar with Prometheus, then have a look at their documentation, but in short, prometheus is a open source monitoring system and time series database developed by soundcloud.
Prometheus is a monitoring system includes a rich, multidimensional data model, a concise and powerful query language called PromQL, an efficient embedded timeseries database, and over 150 integrations with third-party systems.
Thanos
Thanos is a highly available prometheus setup with long term storage capabilities.
Thanos allows you to ship your data to S3/Minio for long storage capabilites, so you could for example only store your “live” data on prometheus for 2 weeks, then everything older than that gets sent to object storage such as amazon s3 or minio. This helps your prometheus instance not to be flooded with data or prevents you from running out of storage space. The nice thing is, when you query for data older than 2 weeks, it will fetch the data from object storage.
Thanos has a global query view, which essentially means you can query your prometheus metrics from one endpoint backed by multiple prometheus servers or cluster.
You can still use the same tools such as Grafana as it utilizes the same Prometheus Query API.
Thanos provides downsampling and compaction, so that you downsample your historical data for massive query speedup when querying large time ranges.
Thanos Components
Thanos is a clustered system of components which can be categorized as follows:
Metric sources
Thanos provides two components that act as data sources: Prometheus Sidecar and Rule Nodes
Sidecar implements gRPC service on top of Prometheus
Rule Node directly implements it on top of the Prometheus storage engine it is running
Data sources that persist their data for long term storage, do so via the Prometheus 2.0 storage engine
Storage engine periodically produces immutable blocks of data for a fixed time range
A blocks top-level directory includes chunks, index and meta.json files
Chunk files hold a few hundred MB worth of chunks each
The index file holds all information needed to lookup specific series by their labels and the positions of their chunks.
The meta.json file holds metadata about block like stats, time range, and compaction level
Stores
A Store Node acts as a Gateway to block data that is stored in an object storage bucket
It implements the same gRPC API as Data Sources to provide access to all metric data found in the bucket
Continuously synchronizes which blocks exist in the bucket and translates requests for metric data into object storage requests
Implements various strategies to minimize the number of requests to the object storage
Prometheus 2.0 storage layout is optimized for minimal read amplification
At this time of writing, only index data is cached
Stores and Data Sources are the same, store nodes and data sources expose the same gRPC Store API
Store API allows to look up data by a set of label matchers and a time range
It then returns compressed chunks of samples as they are found in the block data
So it’s purely a data retrieval API and does not provide complex query execution
Query Layer
Queriers are stateless and horizontally scalable instances that implement PromQL on top of the Store APIs exposed in the cluster
Queriers participate in the cluster to be able to resiliently discover all data sources and store nodes
Rule nodes in return can discover query nodes to evaluate recording and alerting rules
Based on the metadata of store and source nodes, they attempt to minimize the request fanout to fetch data for a particular query
The only scalable components of Thanos is the query nodes as none of the Thanos components provide sharding
Scaling of storage capacity is ensured by relying on an external object storage system
Store, rule, and compactor nodes are all expected to scale significantly within a single instance or high availability pair
The information from above was retrieved from their website, feel free to check them out if you want to read more on the concepts of thanos.
The Architecture Overview of Thanos looks like this:
What are we doing today
We will setup a Thanos Cluster with Minio, Node-Exporter, Grafana on Docker. Our Thanos setup will consist of 3 prometheus containers, each one running with a sidecar container, a store container, 2 query containers, then we have the remotewrite and receive containers which node-exporter will use to ship its metrics to.
The minio container will be used as our long-term storage and the mc container will be used to initialize the storage bucket which is used by thanos.
Deploy the Cluster
Below is the docker-compose.yml and the script to generate the configs for thanos:
Once you have saved the compose as docker-compose.yml and the script as configs.sh you can create the configs:
1
$ bash configs.sh
The script from above creates the data directory and place all the configs that thanos will use in there. Next deploy the thanos cluster:
This is a quick post on how to use environment variables in ansible
Inventory
Our inventory.ini file looks like this:
12
[localhost]
localhost
Across Tasks
You can set environment variables across tasks, and let your tasks inherit the variables:
1234567891011
-hosts:localhostvars:var_mysecret:secret123tasks:-name:echo my env varenvironment:MYNAME:""shell:"echohello$MYNAME>/tmp/bla.txt"args:creates:/tmp/bla.txt
Thank you to everyone of you that helped me during this year, to the ones inspired me, all the great motivation, support and shout outs! There’s so many people to thank, even for the people that is not mentioned, if you ever interacted with me, helped me or supported me, thank you to each and everyone of you!
Below is a list of some of my personal highlights:
I have to say, this one made intuitively more sense to me than a lot of containerisation articles! And I'm not just saying that because I hit publish on it :D
For some reason, when logging to datadog from your applications running on docker swarm, the service names in datadog appears to have the names on the docker image. The application talks to the datadog agent which runs in global mode on swarm.
Setting DATADOG_SERVICE_NAME or DD_SERVICE_NAME as environment variables on the swarm service has zero affect, as they keep showing the service name as the docker image name, as example:
If we inspect the tags, we can see that the docker image shows as the source and maps through as the docker service name. As you can see the swarm service name is what we want to be the service name (not alpine):
One way how to fix this is to setup a pipeline processor, head over to Logs -> Configuration:
Select “Pipelines” and add a new pipeline, select the filter source:alpine to limit down the results to the alpine image, and name your processor:
Next add a new processor and set the type to remapper, select the tag group as “swarm_service” and set the attribute to service and name the processor:
Add a new processor:
Select a service remapper, set the attribute to service and name the processor:
Now when you go back to logs, you will find that the service name is being set to the correct service name in datadog:
When you inspect one of the logs, you will see that the attribute is being set to the log: