Ruan Bekker's Blog

From a Curious mind to Posts on Github

Use a SSH Jump Host With Ansible

In this post we will demonstrate how to use a SSH Bastion or Jump Host with Ansible to reach the target server.

In some scenarios, the target server might be in a private range which is only accessible via a bastion host, and that counts the same for ansible as ansible is using SSH to reach to the target servers.

SSH Config

Our bastion host is configured as bastion and the config under ~/.ssh/config looks like this:

1
2
3
4
5
6
7
8
9
10
11
Host *
    Port 22
    StrictHostKeyChecking no
    UserKnownHostsFile /dev/null
    ServerAliveInterval 60
    ServerAliveCountMax 30

Host bastion
    HostName bastion.mydomain.com
    User bastion
    IdentityFile ~/.ssh/id_rsa

To verify that our config is working, you should be able to use:

1
$ ssh bastion

Using a Bastion with Ansible

In order to reach our target server we need to use the bastion, so to test the SSH connection we can use this SSH one-liner. Our target server has a IP address of 172.31.81.94 and expects us to provide a ansible.pem private key and we need to authenticate with the ubuntu user:

1
$ ssh -o ProxyCommand="ssh -W %h:%p -q bastion" -i ~/.ssh/ansible.pem ubuntu@172.31.81.94

If we can reach our server its time to include it in our playbook.

In our inventory:

1
2
3
4
5
$ cat inventory.ini
[deployment]
server-a ansible_host=172.31.81.94 ansible_user=ubuntu ansible_ssh_private_key_file=~/.ssh/ansible.pem
[deployment:vars]
ansible_ssh_common_args='-o StrictHostKeyChecking=no -o UserKnownHostsFile=/dev/null -o ProxyCommand="ssh -W %h:%p -q bastion"'

And our playbook which will use the ping module:

1
2
3
4
5
$ cat playbook.yml
- name: Test Ping
  hosts: deployment
  tasks:
  - action: ping

Test it out:

1
2
3
4
5
6
7
8
9
10
11
12
$ ansible-playbook -i inventory.ini ping.yml

PLAY [Test Ping] ***********************************************************************************************************************************************************

TASK [Gathering Facts] *****************************************************************************************************************************************************
ok: [server-a]

TASK [ping] ****************************************************************************************************************************************************************
ok: [server-a]

PLAY RECAP *****************************************************************************************************************************************************************
server-a                   : ok=2    changed=0    unreachable=0    failed=0    skipped=0    rescued=0    ignored=0

Basic Ping Role With Ansible in a Playbook

This is a short post on how to create a basic role to reference the ping module in Ansible.

Directory Structure

This is our directory strucuture:

1
2
3
4
5
6
7
8
9
10
11
$ tree .
.
├── inventory.ini
├── playbooks
│   └── myplaybook.yml
└── roles
    └── ping
        └── tasks
            └── main.yml

4 directories, 3 files

Create the directories:

1
2
$ mkdir -p playbooks
$ mkdir -p roles/ping/tasks

Our inventory.ini includes the hosts that we will be using, and in this case I will be defining a group named rpifleet with all the host nested under that group and I’m using the user pi and my private ssh key ~/.ssh/id_rsa:

1
2
3
4
5
6
$ cat inventory.ini
[rpifleet]
rpi-01 ansible_host=rpi-01.local ansible_user=pi ansible_ssh_private_key_file=~/.ssh/id_rsa ansible_python_interpreter=/usr/bin/python3
rpi-02 ansible_host=rpi-02.local ansible_user=pi ansible_ssh_private_key_file=~/.ssh/id_rsa ansible_python_interpreter=/usr/bin/python3
[rpifleet:vars]
ansible_ssh_common_args='-o StrictHostKeyChecking=no -o UserKnownHostsFile=/dev/null'

Next our role is a basic role that will reference our ping module, so from our main playbook we will reference the role that we are defining:

1
2
3
4
$ cat roles/ping/tasks/main.yml
---
- name: Test Ping
  action: ping

Now that we have defined our ping role, we need to include it into our playbook:

1
2
3
4
5
6
$ cat playbooks/myplaybook.yml
---
- name: ping raspberry pi fleet
  hosts: rpifleet
  roles:
    - { role: ../roles/ping }

You will see due to my playbooks directory being non-default, I defined the path to the role directory.

Install Ansible

Next we need to install ansible:

1
$ pip install ansible

Run the Ansible Playbook

Now run the playbook which will ping the nodes using ssh. Using the ping module is useful when testing the connection to your nodes:

1
2
3
4
5
6
7
8
9
10
11
12
13
14
15
$ ansible-playbook -i inventory.ini playbooks/myplaybook.yml

PLAY [ping raspberry pi fleet] *****************************************************

TASK [Gathering Facts] *************************************************************
ok: [rpi-02]
ok: [rpi-01]

TASK [../roles/ping : Test Ping] ***************************************************
ok: [rpi-02]
ok: [rpi-01]

PLAY RECAP *************************************************************************
rpi-01                     : ok=2    changed=0    unreachable=0    failed=0    skipped=0    rescued=0    ignored=0
rpi-02                     : ok=2    changed=0    unreachable=0    failed=0    skipped=0    rescued=0    ignored=0

Thank You

Thanks for reading

Using the Libvirt Provisioner With Terraform for KVM

terraform-ansible-kvm

In this post we will use the libvirt provisioner with Terraform to deploy a KVM Virtual Machine on a Remote KVM Host using SSH and use Ansible to deploy Nginx on our VM.

In my previous post I demonstrated how I provisioned my KVM Host and created a dedicated user for Terraform to authenticate to our KVM host to provision VMs.

Once you have KVM installed and your SSH access is sorted, we can start by installing our dependencies.

Install our Dependencies

First we will install Terraform:

1
2
3
$ wget https://releases.hashicorp.com/terraform/0.13.3/terraform_0.13.3_linux_amd64.zip
$ unzip terraform_0.13.3_linux_amd64.zip
$ sudo mv terraform /usr/local/bin/terraform

Then we will install Ansible:

1
2
3
$ virtualenv -p python3 .venv
$ source .venv/bin/activate
$ pip install ansible

Now in order to use the libvirt provisioner, we need to install it where we will run our Terraform deployment:

1
2
3
4
5
$ cd /tmp/
$ mkdir -p ~/.local/share/terraform/plugins/registry.terraform.io/dmacvicar/libvirt/0.6.2/linux_amd64
$ wget https://github.com/dmacvicar/terraform-provider-libvirt/releases/download/v0.6.2/terraform-provider-libvirt-0.6.2+git.1585292411.8cbe9ad0.Ubuntu_18.04.amd64.tar.gz
$ tar -xvf terraform-provider-libvirt-0.6.2+git.1585292411.8cbe9ad0.Ubuntu_18.04.amd64.tar.gz
$ mv ./terraform-provider-libvirt  ~/.local/share/terraform/plugins/registry.terraform.io/dmacvicar/libvirt/0.6.2/linux_amd64/

Our ssh config for our KVM host in ~/.ssh/config:

1
2
3
4
5
6
7
8
9
Host *
    Port 22
    StrictHostKeyChecking no
    UserKnownHostsFile /dev/null

Host ams-kvm-remote-host
    HostName ams-kvm.mydomain.com
    User deploys
    IdentityFile ~/.ssh/deploys.pem

Terraform all the things

Create a workspace directory for our demonstration:

1
2
$ mkdir -p ~/workspace/terraform-kvm-example/
$ cd ~/workspace/terraform-kvm-example/

First let’s create our providers.tf:

1
2
3
4
5
6
7
8
terraform {
  required_providers {
    libvirt = {
      source  = "dmacvicar/libvirt"
      version = "0.6.2"
    }
  }
}

Then our variables.tf, just double check where you need to change values to suite your environment:

1
2
3
4
5
6
7
8
9
10
11
12
13
14
15
16
17
18
19
20
21
22
23
24
variable "libvirt_disk_path" {
  description = "path for libvirt pool"
  default     = "/opt/kvm/pool1"
}

variable "ubuntu_18_img_url" {
  description = "ubuntu 18.04 image"
  default     = "http://cloud-images.ubuntu.com/releases/bionic/release-20191008/ubuntu-18.04-server-cloudimg-amd64.img"
}

variable "vm_hostname" {
  description = "vm hostname"
  default     = "terraform-kvm-ansible"
}

variable "ssh_username" {
  description = "the ssh user to use"
  default     = "ubuntu"
}

variable "ssh_private_key" {
  description = "the private key to use"
  default     = "~/.ssh/id_rsa"
}

Create the main.tf, you will notice that we are using ssh to connect to KVM, and because the private range of our VM’s are not routable via the internet, I’m using a bastion host to reach them.

The bastion host (ssh config from the pre-requirements section) is the KVM host and you will see that ansible is also using that host as a jump box, to get to the VM. I am also using cloud-init to bootstrap the node with SSH, etc.

The reason why I’m using remote-exec before the ansible deployment, is to ensure that we can establish a command via SSH before Ansible starts.

1
2
3
4
5
6
7
8
9
10
11
12
13
14
15
16
17
18
19
20
21
22
23
24
25
26
27
28
29
30
31
32
33
34
35
36
37
38
39
40
41
42
43
44
45
46
47
48
49
50
51
52
53
54
55
56
57
58
59
60
61
62
63
64
65
66
67
68
69
70
71
72
73
74
75
76
77
78
79
80
81
82
83
84
85
86
87
88
89
90
91
92
93
94
provider "libvirt" {
  uri = "qemu+ssh://deploys@ams-kvm-remote-host/system"
}

resource "libvirt_pool" "ubuntu" {
  name = "ubuntu"
  type = "dir"
  path = var.libvirt_disk_path
}

resource "libvirt_volume" "ubuntu-qcow2" {
  name = "ubuntu-qcow2"
  pool = libvirt_pool.ubuntu.name
  source = var.ubuntu_18_img_url
  format = "qcow2"
}

data "template_file" "user_data" {
  template = file("${path.module}/config/cloud_init.yml")
}

data "template_file" "network_config" {
  template = file("${path.module}/config/network_config.yml")
}

resource "libvirt_cloudinit_disk" "commoninit" {
  name           = "commoninit.iso"
  user_data      = data.template_file.user_data.rendered
  network_config = data.template_file.network_config.rendered
  pool           = libvirt_pool.ubuntu.name
}

resource "libvirt_domain" "domain-ubuntu" {
  name   = var.vm_hostname
  memory = "512"
  vcpu   = 1

  cloudinit = libvirt_cloudinit_disk.commoninit.id

  network_interface {
    network_name   = "default"
    wait_for_lease = true
    hostname       = var.vm_hostname
  }

  console {
    type        = "pty"
    target_port = "0"
    target_type = "serial"
  }

  console {
    type        = "pty"
    target_type = "virtio"
    target_port = "1"
  }

  disk {
    volume_id = libvirt_volume.ubuntu-qcow2.id
  }

  graphics {
    type        = "spice"
    listen_type = "address"
    autoport    = true
  }

  provisioner "remote-exec" {
    inline = [
      "echo 'Hello World'"
    ]

    connection {
      type                = "ssh"
      user                = var.ssh_username
      host                = libvirt_domain.domain-ubuntu.network_interface[0].addresses[0]
      private_key         = file(var.ssh_private_key)
      bastion_host        = "ams-kvm-remote-host"
      bastion_user        = "deploys"
      bastion_private_key = file("~/.ssh/deploys.pem")
      timeout             = "2m"
    }
  }

  provisioner "local-exec" {
    command = <<EOT
      echo "[nginx]" > nginx.ini
      echo "${libvirt_domain.domain-ubuntu.network_interface[0].addresses[0]}" >> nginx.ini
      echo "[nginx:vars]" >> nginx.ini
      echo "ansible_ssh_common_args='-o StrictHostKeyChecking=no -o UserKnownHostsFile=/dev/null -o ProxyCommand=\"ssh -W %h:%p -q ams-kvm-remote-host\"'" >> nginx.ini
      ansible-playbook -u ${var.ssh_username} --private-key ${var.ssh_private_key} -i nginx.ini ansible/playbook.yml
      EOT
  }
}

As I’ve mentioned, Im using cloud-init, so lets setup the network config and cloud init under the config/ directory:

1
$ mkdir config

And our config/cloud_init.yml, just make sure that you configure your public ssh key for ssh access in the config:

1
2
3
4
5
6
7
8
9
10
11
12
13
14
15
16
17
18
19
20
21
22
23
24
25
#cloud-config
# vim: syntax=yaml
# examples:
# https://cloudinit.readthedocs.io/en/latest/topics/examples.html
bootcmd:
  - echo 192.168.0.1 gw.homedns.xyz >> /etc/hosts
runcmd:
 - [ ls, -l, / ]
 - [ sh, -xc, "echo $(date) ': hello world!'" ]
ssh_pwauth: true
disable_root: false
chpasswd:
  list: |
     root:password
  expire: false
users:
  - name: ubuntu
    sudo: ALL=(ALL) NOPASSWD:ALL
    groups: users, admin
    home: /home/ubuntu
    shell: /bin/bash
    lock_passwd: false
    ssh-authorized-keys:
      - ssh-rsa AAAA ...your-public-ssh-key-goes-here... user@host
final_message: "The system is finally up, after $UPTIME seconds"

And our network config, in config/network_config.yml:

1
2
3
4
version: 2
ethernets:
  ens3:
    dhcp4: true

Now we will create our Ansible playbook, to deploy nginx to our VM, create the ansible directory:

1
$ mkdir ansible

Then create the ansible/playbook.yml:

1
2
3
4
5
6
7
8
9
10
11
12
13
14
15
16
17
18
19
20
21
22
23
24
---
# https://docs.ansible.com/ansible/latest/collections/ansible/builtin/apt_module.html
# https://docs.ansible.com/ansible/latest/collections/ansible/builtin/systemd_module.html#examples
- hosts: nginx
  become: yes
  become_user: root
  become_method: sudo
  tasks:
    - name: Install nginx
      apt:
        name: nginx
        state: latest
        update_cache: yes

    - name: Enable service nginx and ensure it is not masked
      systemd:
        name: nginx
        enabled: yes
        masked: no

    - name: ensure nginx is started
      systemd:
        state: started
        name: nginx

This is optional, but I’m using a ansible.cfg file to define my defaults:

1
2
3
4
5
6
[defaults]
host_key_checking = False
ansible_port = 22
ansible_user = ubuntu
ansible_ssh_private_key_file = ~/.ssh/id_rsa
ansible_python_interpreter = /usr/bin/python3

And lastly, our outputs.tf which will display our IP address of our VM:

1
2
3
4
5
6
7
output "ip" {
  value = libvirt_domain.domain-ubuntu.network_interface[0].addresses[0]
}

output "url" {
  value = "http://${libvirt_domain.domain-ubuntu.network_interface[0].addresses[0]}"
}

Deploy our Terraform Deployment

It’s time to deploy a KVM instance with Terraform and deploy Nginx to our VM with Ansible using the local-exec provisioner.

Initialize terraform to download all the plugins:

1
2
3
4
5
6
7
8
9
10
11
12
13
14
15
16
17
18
19
20
21
22
$ terraform init

Initializing the backend...

Initializing provider plugins...
- Finding latest version of hashicorp/template...
- Finding dmacvicar/libvirt versions matching "0.6.2"...
- Installing hashicorp/template v2.1.2...
- Installed hashicorp/template v2.1.2 (signed by HashiCorp)
- Installing dmacvicar/libvirt v0.6.2...
- Installed dmacvicar/libvirt v0.6.2 (unauthenticated)

The following providers do not have any version constraints in configuration,
so the latest version was installed.

To prevent automatic upgrades to new major versions that may contain breaking
changes, we recommend adding version constraints in a required_providers block
in your configuration, with the constraint strings suggested below.

* hashicorp/template: version = "~> 2.1.2"

Terraform has been successfully initialized!

Run a plan, to see what will be done:

1
2
3
4
5
6
7
8
9
$ terraform plan

...
Plan: 4 to add, 0 to change, 0 to destroy.

Changes to Outputs:
  + ip  = (known after apply)
  + url = (known after apply)
...

And run a apply to run our deployment:

1
2
3
4
5
6
7
8
9
10
11
12
$ terraform apply -auto-approve
...
libvirt_domain.domain-ubuntu (local-exec): PLAY RECAP *********************************************************************
libvirt_domain.domain-ubuntu (local-exec): 192.168.122.213            : ok=4    changed=1    unreachable=0    failed=0    skipped=0    rescued=0    ignored=0
libvirt_domain.domain-ubuntu: Creation complete after 2m24s [id=c96def6e-0361-441c-9e1f-5ba5f3fa5aec]

Apply complete! Resources: 4 added, 0 changed, 0 destroyed.

Outputs:

ip = 192.168.122.213
url = http://192.168.122.213

You can always get the output afterwards using show or output:

1
2
3
4
5
$ terraform show -json | jq -r '.values.outputs.ip.value'
192.168.122.213

$ terraform output -json ip | jq -r '.'
192.168.122.213

Test our VM

Hop onto the KVM host, and test out nginx:

1
2
3
4
5
6
7
8
9
10
$ curl -I http://192.168.122.213
HTTP/1.1 200 OK
Server: nginx/1.14.0 (Ubuntu)
Date: Thu, 08 Oct 2020 00:37:43 GMT
Content-Type: text/html
Content-Length: 612
Last-Modified: Thu, 08 Oct 2020 00:33:04 GMT
Connection: keep-alive
ETag: "5f7e5e40-264"
Accept-Ranges: bytes

via GIPHY

Thank You

Say Thanks!

Thanks for reading, check out my website or follow me at @ruanbekker on Twitter.

Setup a KVM Host for Virtualization on OneProvider

I’ve been on the hunt for a hobby dedicated server for a terraform project, where I’m intending to use the libvirt provider and found one awesome provider that offers amazingly great prices.

At oneprovider.com, they offer dedicated servers for great prices and they offer a huge number of locations. So I decided to give them a go and ordered a dedicated server in Amsterdam, Netherlands:

cheap-dedicated-servers

I went for a 4GB DDR3 RAM, Atom C2350 2 Cores CPU with 128GB SSD and 1Gbps unmetered bandwidth for $7.30 a month, which is super cheap and more than enough for a hobby project:

image

I’ve been using them for the last week and super impressed.

What are we doing

As part of my Terraform project, I would like to experiment with the libvirt provisioner to provision KVM instances, I need a dedicated server with KVM installed, and in this guide we will install KVM and create a dedicated user that we will use with Terraform.

Install KVM

Once your server is provisioned, SSH to your dedicated server and install cpu-checker to ensure that we are able to install KVM:

1
2
$ $ apt update && apt upgrade -y
$ apt install cpu-checker -y

Test using kvm-ok:

1
2
3
$ kvm-ok
INFO: /dev/kvm exists
KVM acceleration can be used

On a client pc, generate the SSH key that we will use to authenticate with on our KVM host:

1
$ ssh-keygen -t rsa -C deploys -f ~/.ssh/deploys.pem

Back on the server, create the user and prepare the ssh directory:

1
2
3
$ useradd -m -s /bin/bash deploys
$ mkdir /home/deploys/.ssh
$ touch /home/deploys/.ssh/authorized_keys

On the client PC where you generated your SSH key, copy the public key:

1
$ cat ~/.ssh/deploys.pem.pub| pbcopy

Paste your public key to the servers authorized_keys file:

1
2
$ vim /home/deploys/.ssh/authorized_keys
# paste the public key contents and save

Update the content below with the correct permissions:

1
2
3
$ chown -R deploys:deploys /home/deploys
$ chmod 755 /home/deploys/.ssh
$ chmod 644 /home/deploys/.ssh/authorized_keys

Install KVM on the host:

1
$ apt install bridge-utils qemu-kvm libvirt-bin virtinst -y

Add our dedicated user to the libvirt group:

1
$ usermod -G libvirt deploys

Create the directory where we will store our vm’s disks:

1
$ mkdir -p /opt/kvm

And apply ownership permissions for our user and group:

1
$ chown -R deploys:libvirt /opt/kvm

I ran into a permission denied issue using terraform and the dedicated user, and to resolve I had to ensure that the security_driver is set to none in /etc/libvirt/qemu.conf:

1
$ vim /etc/libvirt/qemu.conf

and update the following:

1
security_driver = "none"

Then restart libvirtd:

1
$ sudo systemctl restart libvirtd 

Test KVM

Switch to the deploys user:

1
$ sudo su - deploys

And list domains using virsh:

1
2
3
$ virsh list
 Id    Name                           State
----------------------------------------------------

Thank You

That’s it, now we have a KVM host that allows us to provision VM’s. In the next post we will install terraform and the libvirt provisioner for terraform to provision a vm and use ansible to deploy software to our vm.

Say Thanks!

Thanks for reaching out to me, check out my website or follow me at @ruanbekker on Twitter.

Using the Local-exec Provisioner With Terraform

This is a basic example on how to use the local-exec provisioner in terraform, and I will use it to write a environment variable’s value to disk.

Installing Terraform

Get the latest version of terraform, for this post, I will be using the latest version of the time of writing:

1
2
3
$ wget https://releases.hashicorp.com/terraform/0.13.3/terraform_0.13.3_linux_amd64.zip
$ unzip terraform_0.13.3_linux_amd64.zip
$ sudo mv terraform /usr/local/bin/terraform

Ensure that it’s working:

1
2
$ terraform -version
Terraform v0.13.3

Terraform local-exec

The local-exec provisioner allows us to run a command locally, so to test that we will write the environment variable owner=ruan to disk.

First setup our main.tf:

1
2
3
4
5
resource "null_resource" "this" {
  provisioner "local-exec" {
    command = "echo ${var.owner} > file_${null_resource.this.id}.txt"
  }
}

As you can see our local-exec provisioner is issuing the command echo to write the environment variable owner’s value to a file on disk, and the file name is file_ + the null resource’s id.

As we are referencing a variable, we need to define the variable, I will define it in variables.tf:

1
variable "owner" {}

As you can see, I am not defining the value, as I will define the value at runtime.

Initialize

When we initialize terraform, terraform builds up a dependency tree from all the .tf files and downloads any dependencies it requires:

1
$ terraform init

Apply

Run our deployment and pass our variable at runtime:

1
2
3
4
5
6
7
8
$ terraform apply -var 'owner=ruan' -auto-approve

null_resource.this: Creating...
null_resource.this: Provisioning with 'local-exec'...
null_resource.this (local-exec): Executing: ["/bin/sh" "-c" "echo ruan > file_4397943546484635522.txt"]
null_resource.this: Creation complete after 0s [id=4397943546484635522]

Apply complete! Resources: 1 added, 0 changed, 0 destroyed.

View the written file:

1
2
$ cat file_4397943546484635522.txt
ruan

If we wanted to define the environment variable in the variables.tf file, it will look like this:

1
2
3
4
variable "owner" {
  description = "the owner of this project"
  default     = "ruan"
}

The github repository for this code is located at:

Setup a NFS Server With Docker

In this tutorial we will setup a NFS Server using Docker for our development environment.

Host Storage Path

In this example we will be using our host path /data/nfs-storage which will host our storage for our NFS server, which will will mount to the container:

1
$ mkdir -p /data/nfs-storage

NFS Server

Create the NFS Server with docker:

1
2
3
4
5
6
$ docker run -itd --privileged \
  --restart unless-stopped \
  -e SHARED_DIRECTORY=/data \
  -v /data/nfs-storage:/data \
  -p 2049:2049 \
  itsthenetwork/nfs-server-alpine:12

We can do the same using docker-compose, for our docker-compose.yml:

1
2
3
4
5
6
7
8
9
10
11
12
13
14
version: "2.1"
services:
  # https://hub.docker.com/r/itsthenetwork/nfs-server-alpine
  nfs:
    image: itsthenetwork/nfs-server-alpine:12
    container_name: nfs
    restart: unless-stopped
    privileged: true
    environment:
      - SHARED_DIRECTORY=/data
    volumes:
      - /data/nfs-storage:/data
    ports:
      - 2049:2049

To deploy using docker-compose:

1
$ docker-compose up -d

NFS Client

To use a NFS Client to mount this to your filesystem, you can look at this blogpost>

In summary:

1
2
$ sudo apt install nfs-client -y
$ sudo mount -v -o vers=4,loud 192.168.0.4:/ /mnt

Verify that the mount is showing:

1
2
3
4
$ df -h
Filesystem      Size  Used Avail Use% Mounted on
/dev/sda2       109G   53G   51G  52% /
192.168.0.4:/   4.5T  2.2T  2.1T  51% /mnt

Now, create a test file on our NFS export:

1
$ touch /mnt/file.txt

Verify that the test file is on the local path:

1
2
$ ls /data/nfs-storage/
file.txt

If you want to load this into other client’s /etc/fstab:

1
192.168.0.4:/   /mnt   nfs4    _netdev,auto  0  0

NFS Docker Volume Plugin

You can use a NFS Volume Plugin for Docker or Docker Swarm for persistent container storage.

To use the NFS Volume plugin, we need to download docker-volume-netshare from their github releases page.

1
2
3
$ wget https://github.com/ContainX/docker-volume-netshare/releases/download/v0.36/docker-volume-netshare_0.36_amd64.deb
$ dpkg -i docker-volume-netshare_0.36_amd64.deb
$ service docker-volume-netshare start

Then your docker-compose.yml:

1
2
3
4
5
6
7
8
9
10
11
12
13
14
15
16
17
18
19
20
version: '3.7'

services:
  mysql:
    image: mariadb:10.1
    networks:
      - private
    environment:
      - MYSQL_ROOT_PASSWORD=${DATABASE_PASSWORD:-admin}
      - MYSQL_DATABASE=testdb
      - MYSQL_USER=${DATABASE_USER:-admin}
      - MYSQL_PASSWORD=${DATABASE_PASSWORD:-admin}
    volumes:
      - mysql_data.vol:/var/lib/mysql

volumes:
  mysql_data.vol:
    driver: nfs
    driver_opts:
      share: 192.168.69.1:/mysql_data_vol

Thank You

That’s it. Thanks for reading, follow me on Twitter and say hi! @ruanbekker

Say Thanks!

Using if Statements in Bash to Check if Environment Variables Exist

This is a quick post to demonstrate how to use if statements in bash to check if we have the required environment variables in our environment before we continue a script.

Let’s say we require FOO and BAR in our environment before we can continue, we can do this:

1
2
3
4
5
6
7
8
9
10
11
#!/usr/bin/env bash

if [ -z ${FOO} ] || [ -z ${BAR} ] ;
  then
    echo "required environment variables does not exist"
    exit 1
  else
    echo "required environment variables are set"
    # do things
    exit 0
fi

So now if FOO or BAR is not set in our environment, the script will exit with return code 1.

To test it, when we pass no environment variables:

1
2
3
$ chmod +x ./update.sh
$ ./update.sh
required environment variables does not exist

If we only pass one environment variable:

1
2
$ FOO=1 ./update.sh
required environment variables does not exist

And as the result we want, when we pass both required environment variables, we have success:

1
2
$ FOO=1 BAR=2 ./update.sh
required environment variables are set

Getting Started on Logging With Loki Using Docker

Logging with Loki is AMAZING!

In the past couple of months i’ve been working a lot with logging, but more specifically logging with loki. As most of my metrics reside in prometheus, I use grafana quite extensively and logging was always the one that stood out a bit as I pushed my logs to elasticsearch and consumed them from grafana. Which worked pretty well, but the maintenance and resource costs was a bit too much for what I was looking for.

And then grafana released Loki, which is like prometheus, but for logs. And that was just super, exactly what I was looking for. For my use case, I was looking for something that can be consumed by grafana as a presentation layer, central based so I can push all sorts of logs, and want a easy way to grep for logs and a bonus would be to have a cli tool.

And Loki checked all those boxes!

What can you expect from this blog

In this post will be a getting started guide to Loki, we will provision Loki, Grafana and Nginx using Docker to get our environment up and running, so that we can push our nginx container logs to the loki datasource, and access the logs via grafana.

We will then generate some logs so that we can show a couple of query examples using the log query language (LogQL) and use the LogCLI to access our logs via cli.

In a future post, I will demonstrate how to setup Loki for a non-docker deployment.

Some useful information about Loki

Let’s first talk about Loki compared with Elasticsearch, as they are not the same:

  1. Loki does not index the text of the logs, instead grouping entries into streams and index those with labels
  2. Things like full text search engines tokenizes your text into k/v pairs and gets written to an inverted index, which over time in my opinion gets complex to maintain, expensive to scale, storage retention, etc.
  3. Loki is advertised as easy to scale, affordable to operate as it uses DynamoDB for Indexing and S3 for Storage
  4. When using Loki, you may need to forget what you know and look to see how the problem can be solved differently with parallelization. Loki’s superpower is breaking up queries into small pieces and dispatching them in parallel so that you can query huge amounts of log data in small amounts of time.

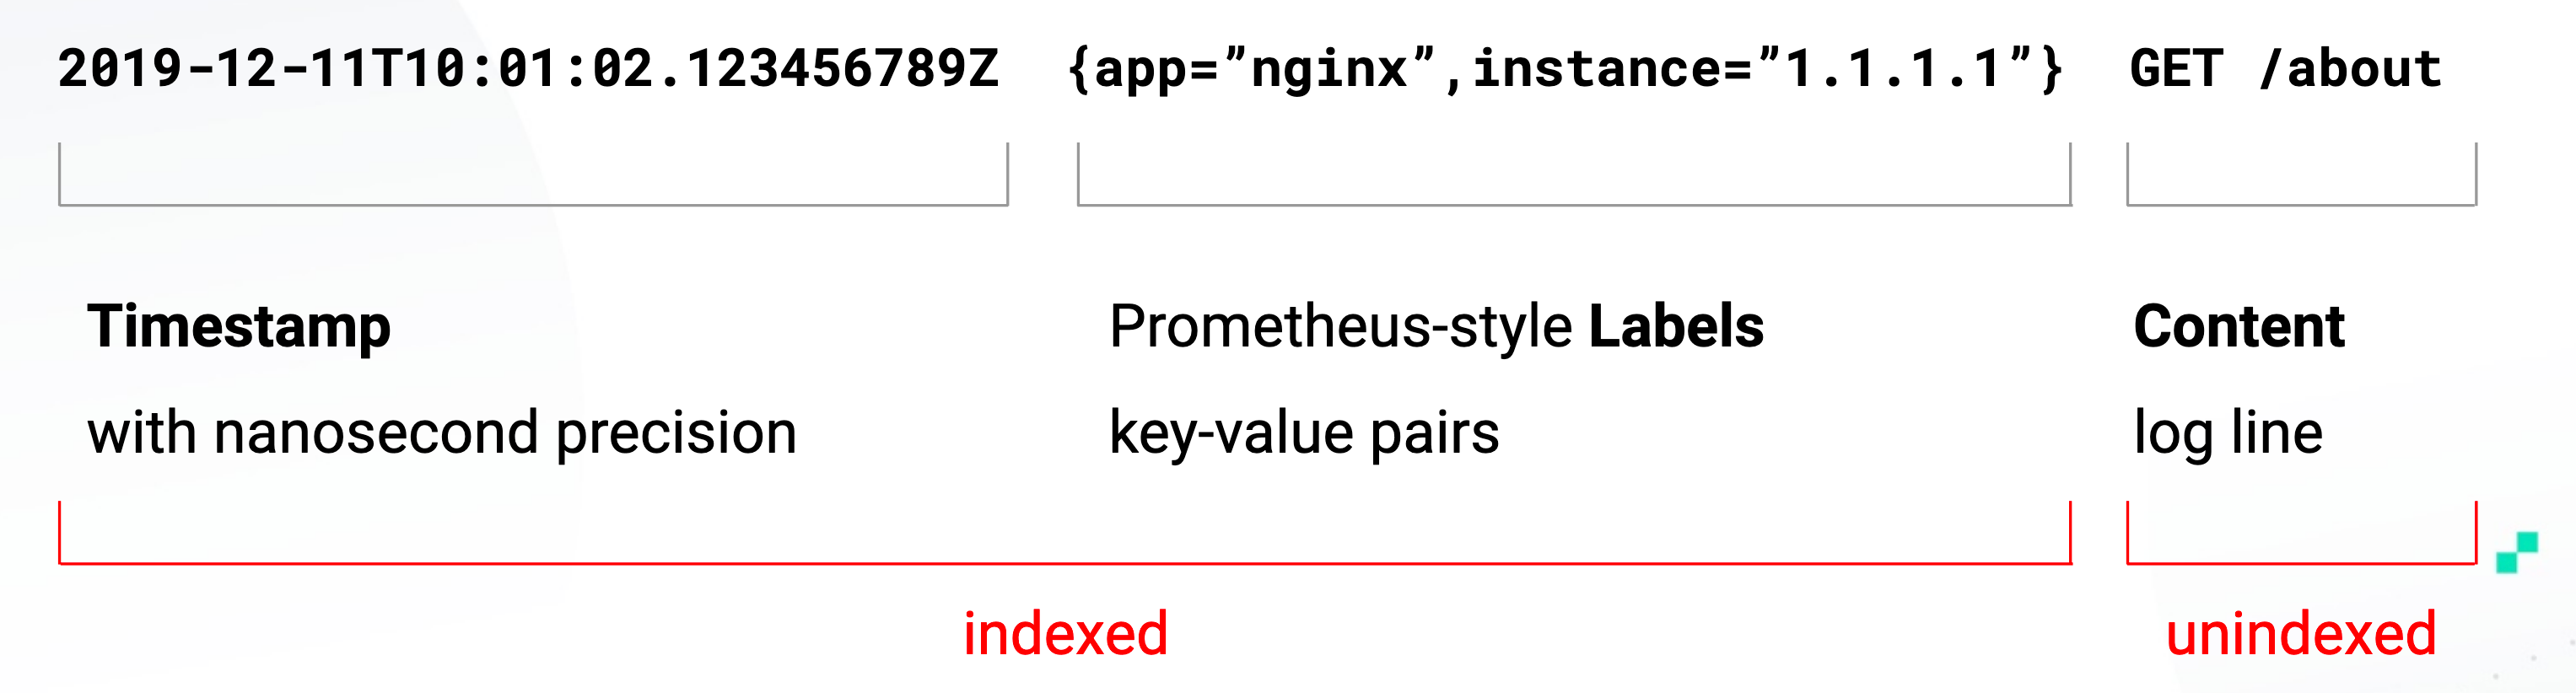
If we look at the Loki Log Model, we can see that the timestamp and the labels are indexed and the content of the logs are not indexed:

loki

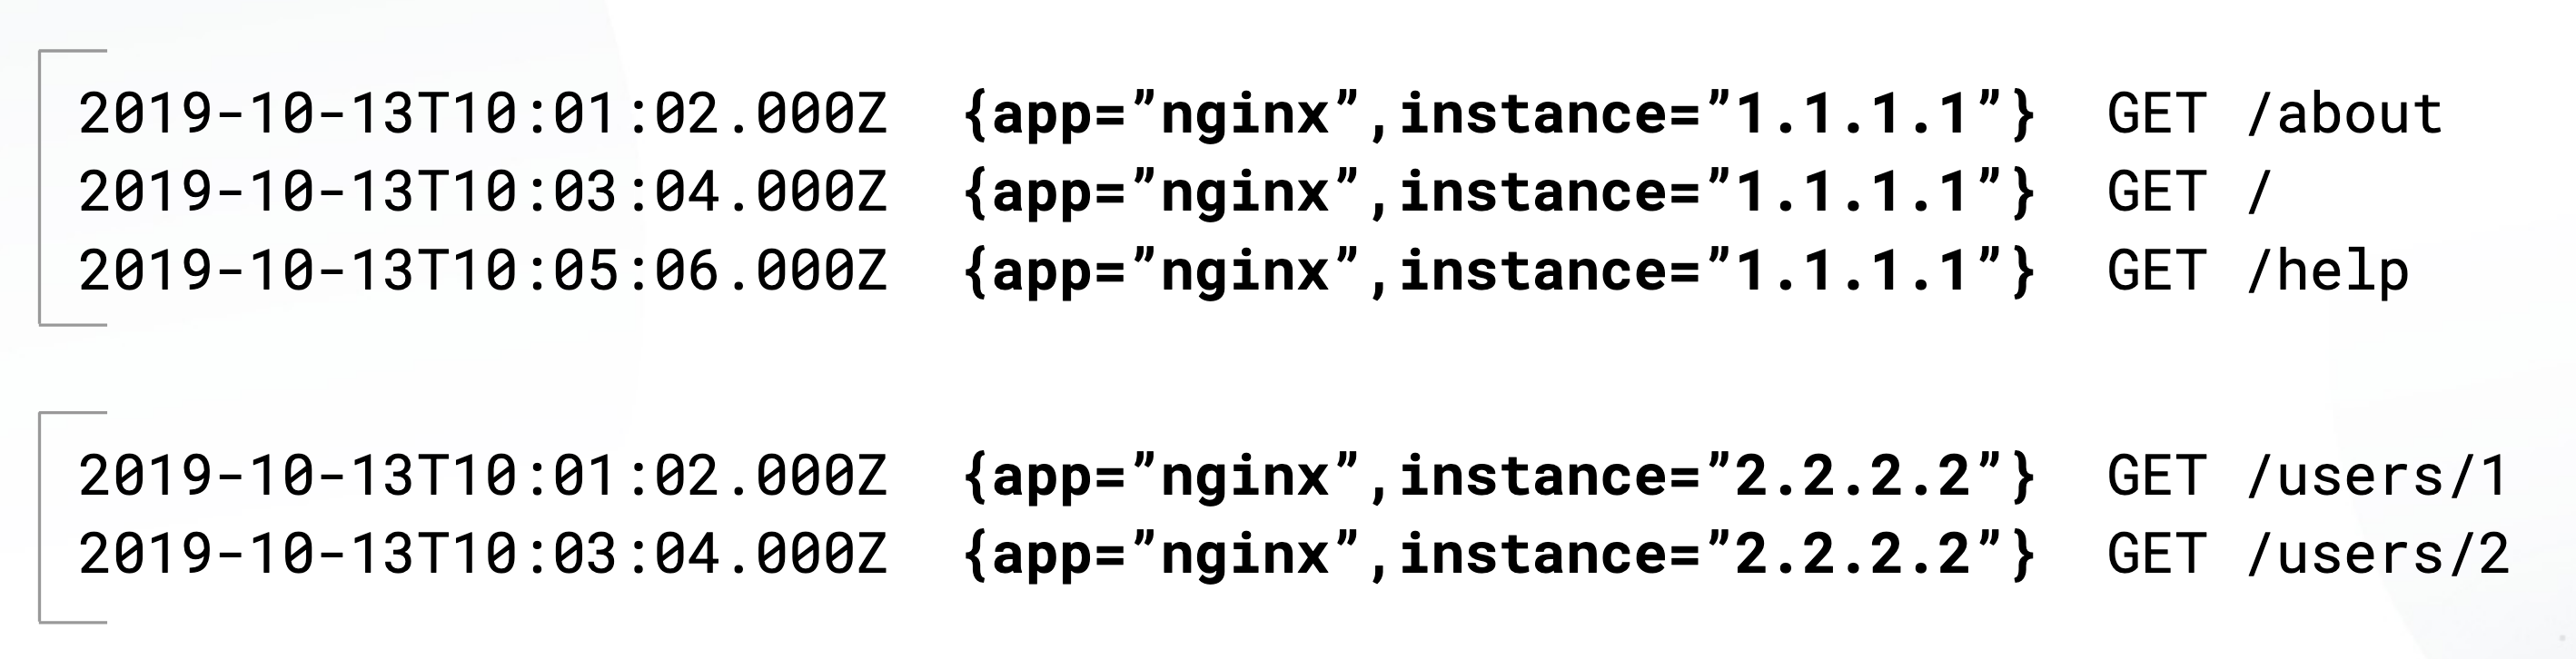
A log stream is a stream of log entries with the same exact label set:

loki

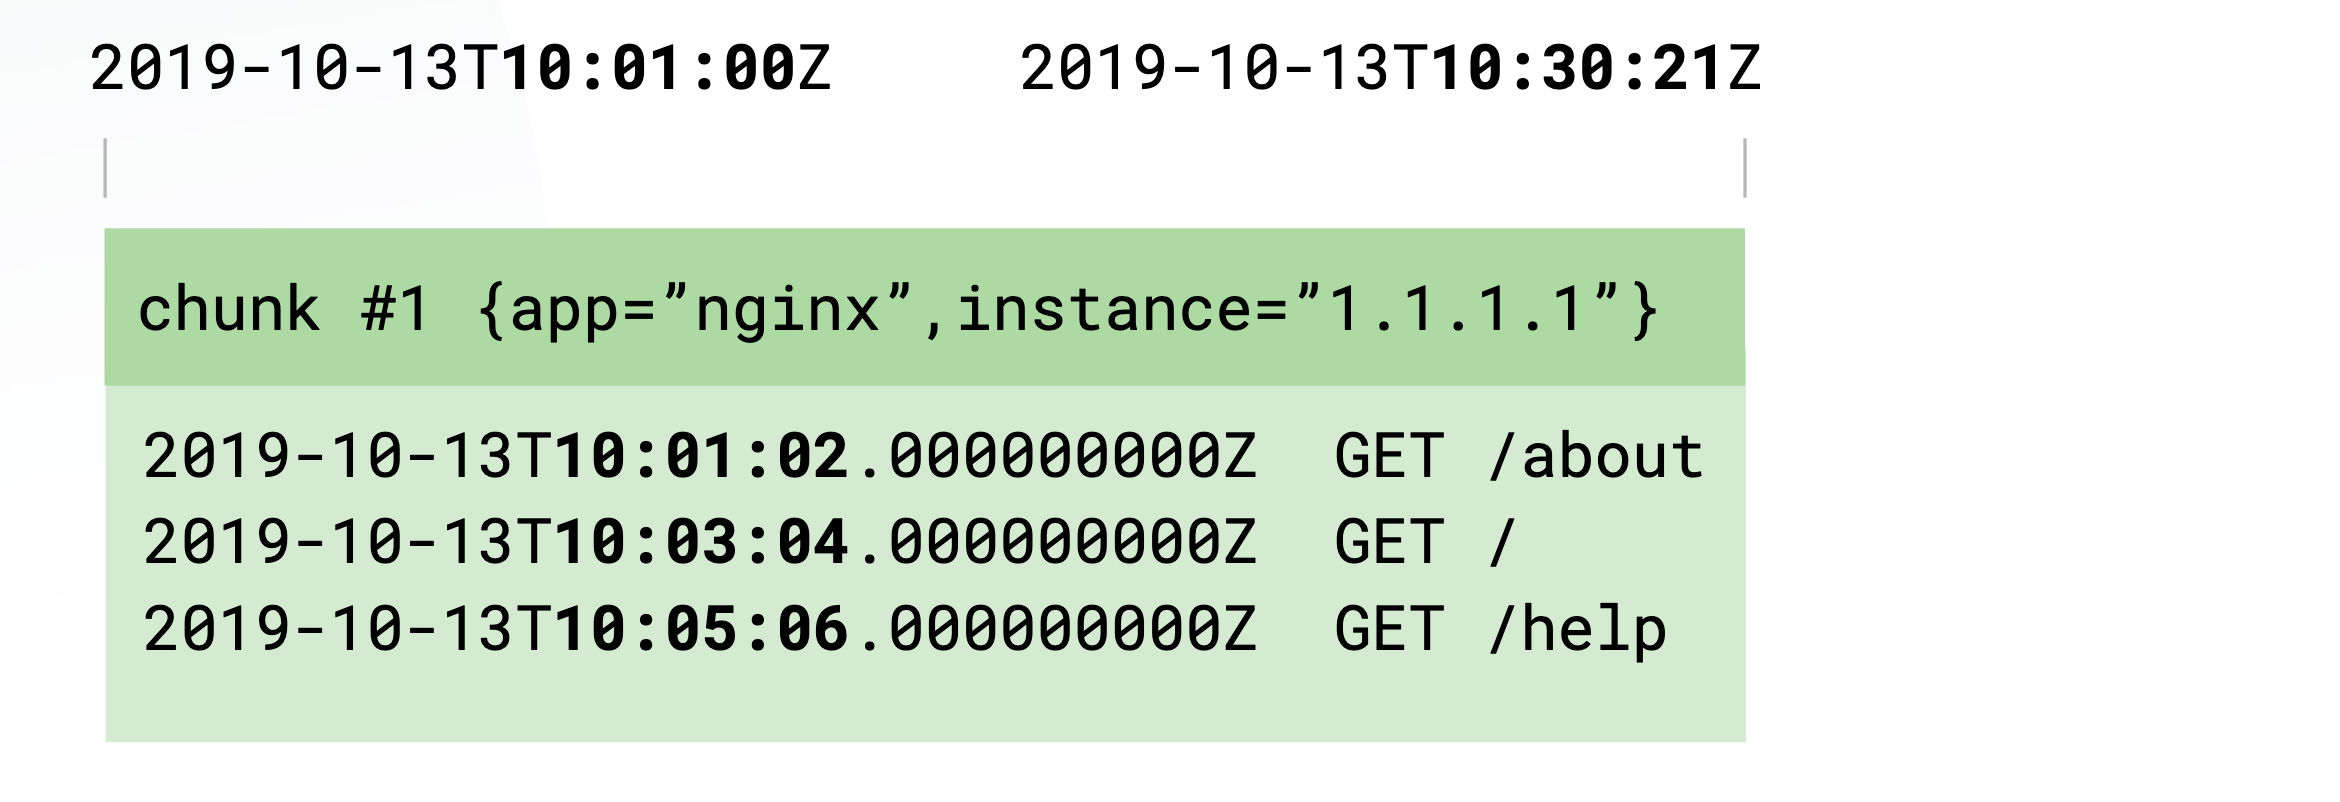
For the storage side, inside each chunk, log entries are sorted by timestamp. Loki only indexes minimum and maximum timestamps of a chunk. Storage options support local storage, AWS S3, Google Cloud Storage and Azure

loki

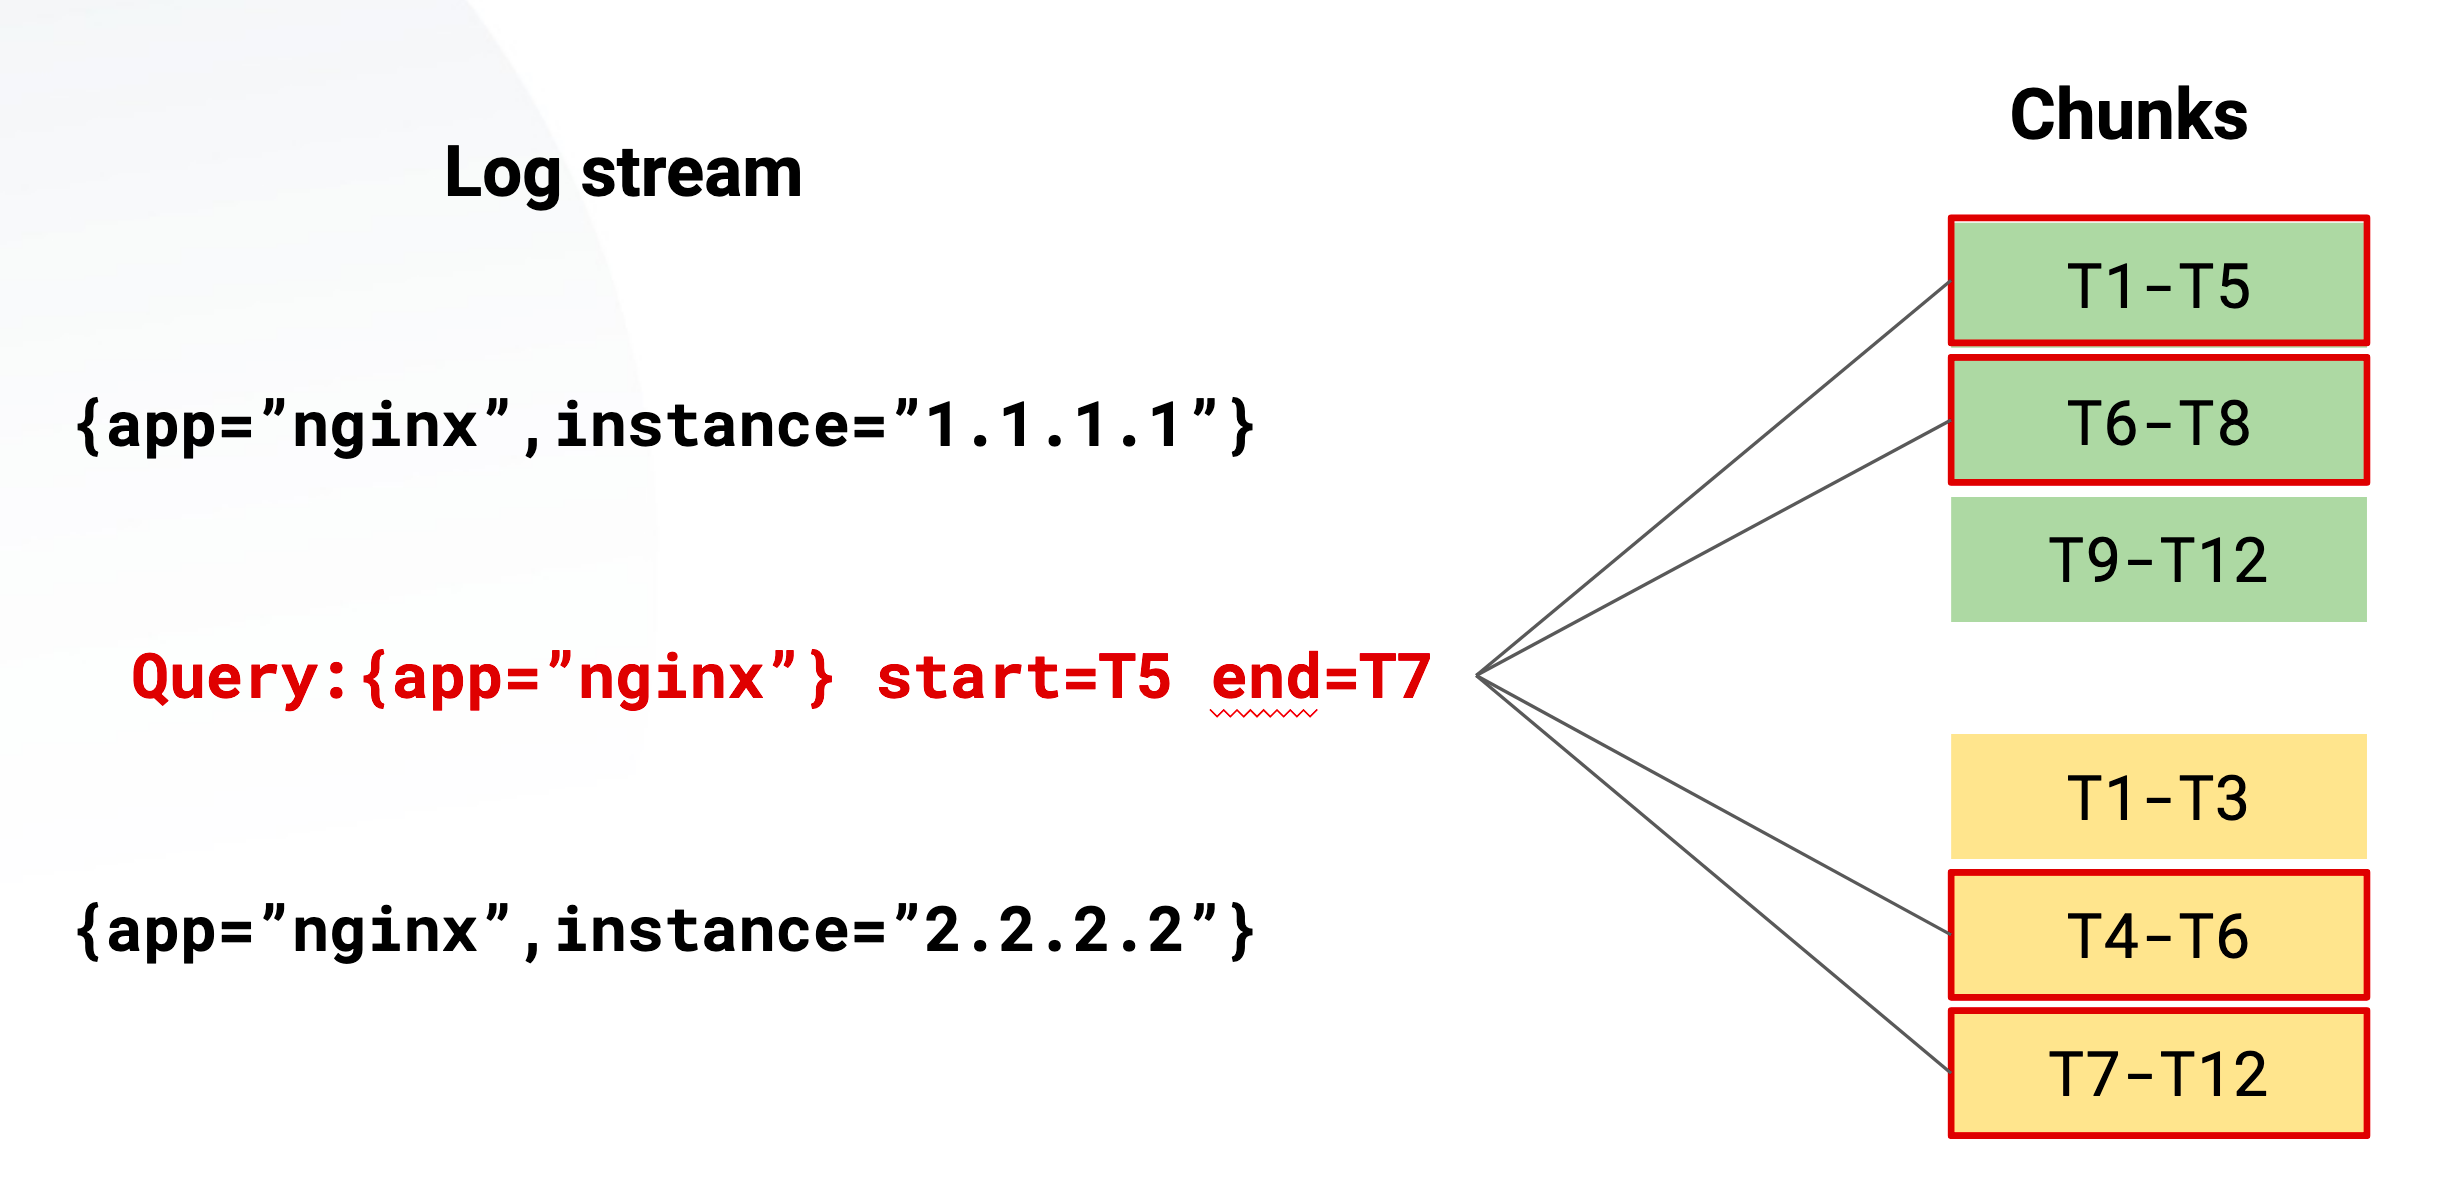
For chunks and querying, chunks are filled per stream and they are flushed of a few criterias such as age and size:

loki

And one of the most important parts are the labels, labels define the stream and therefore its very important.

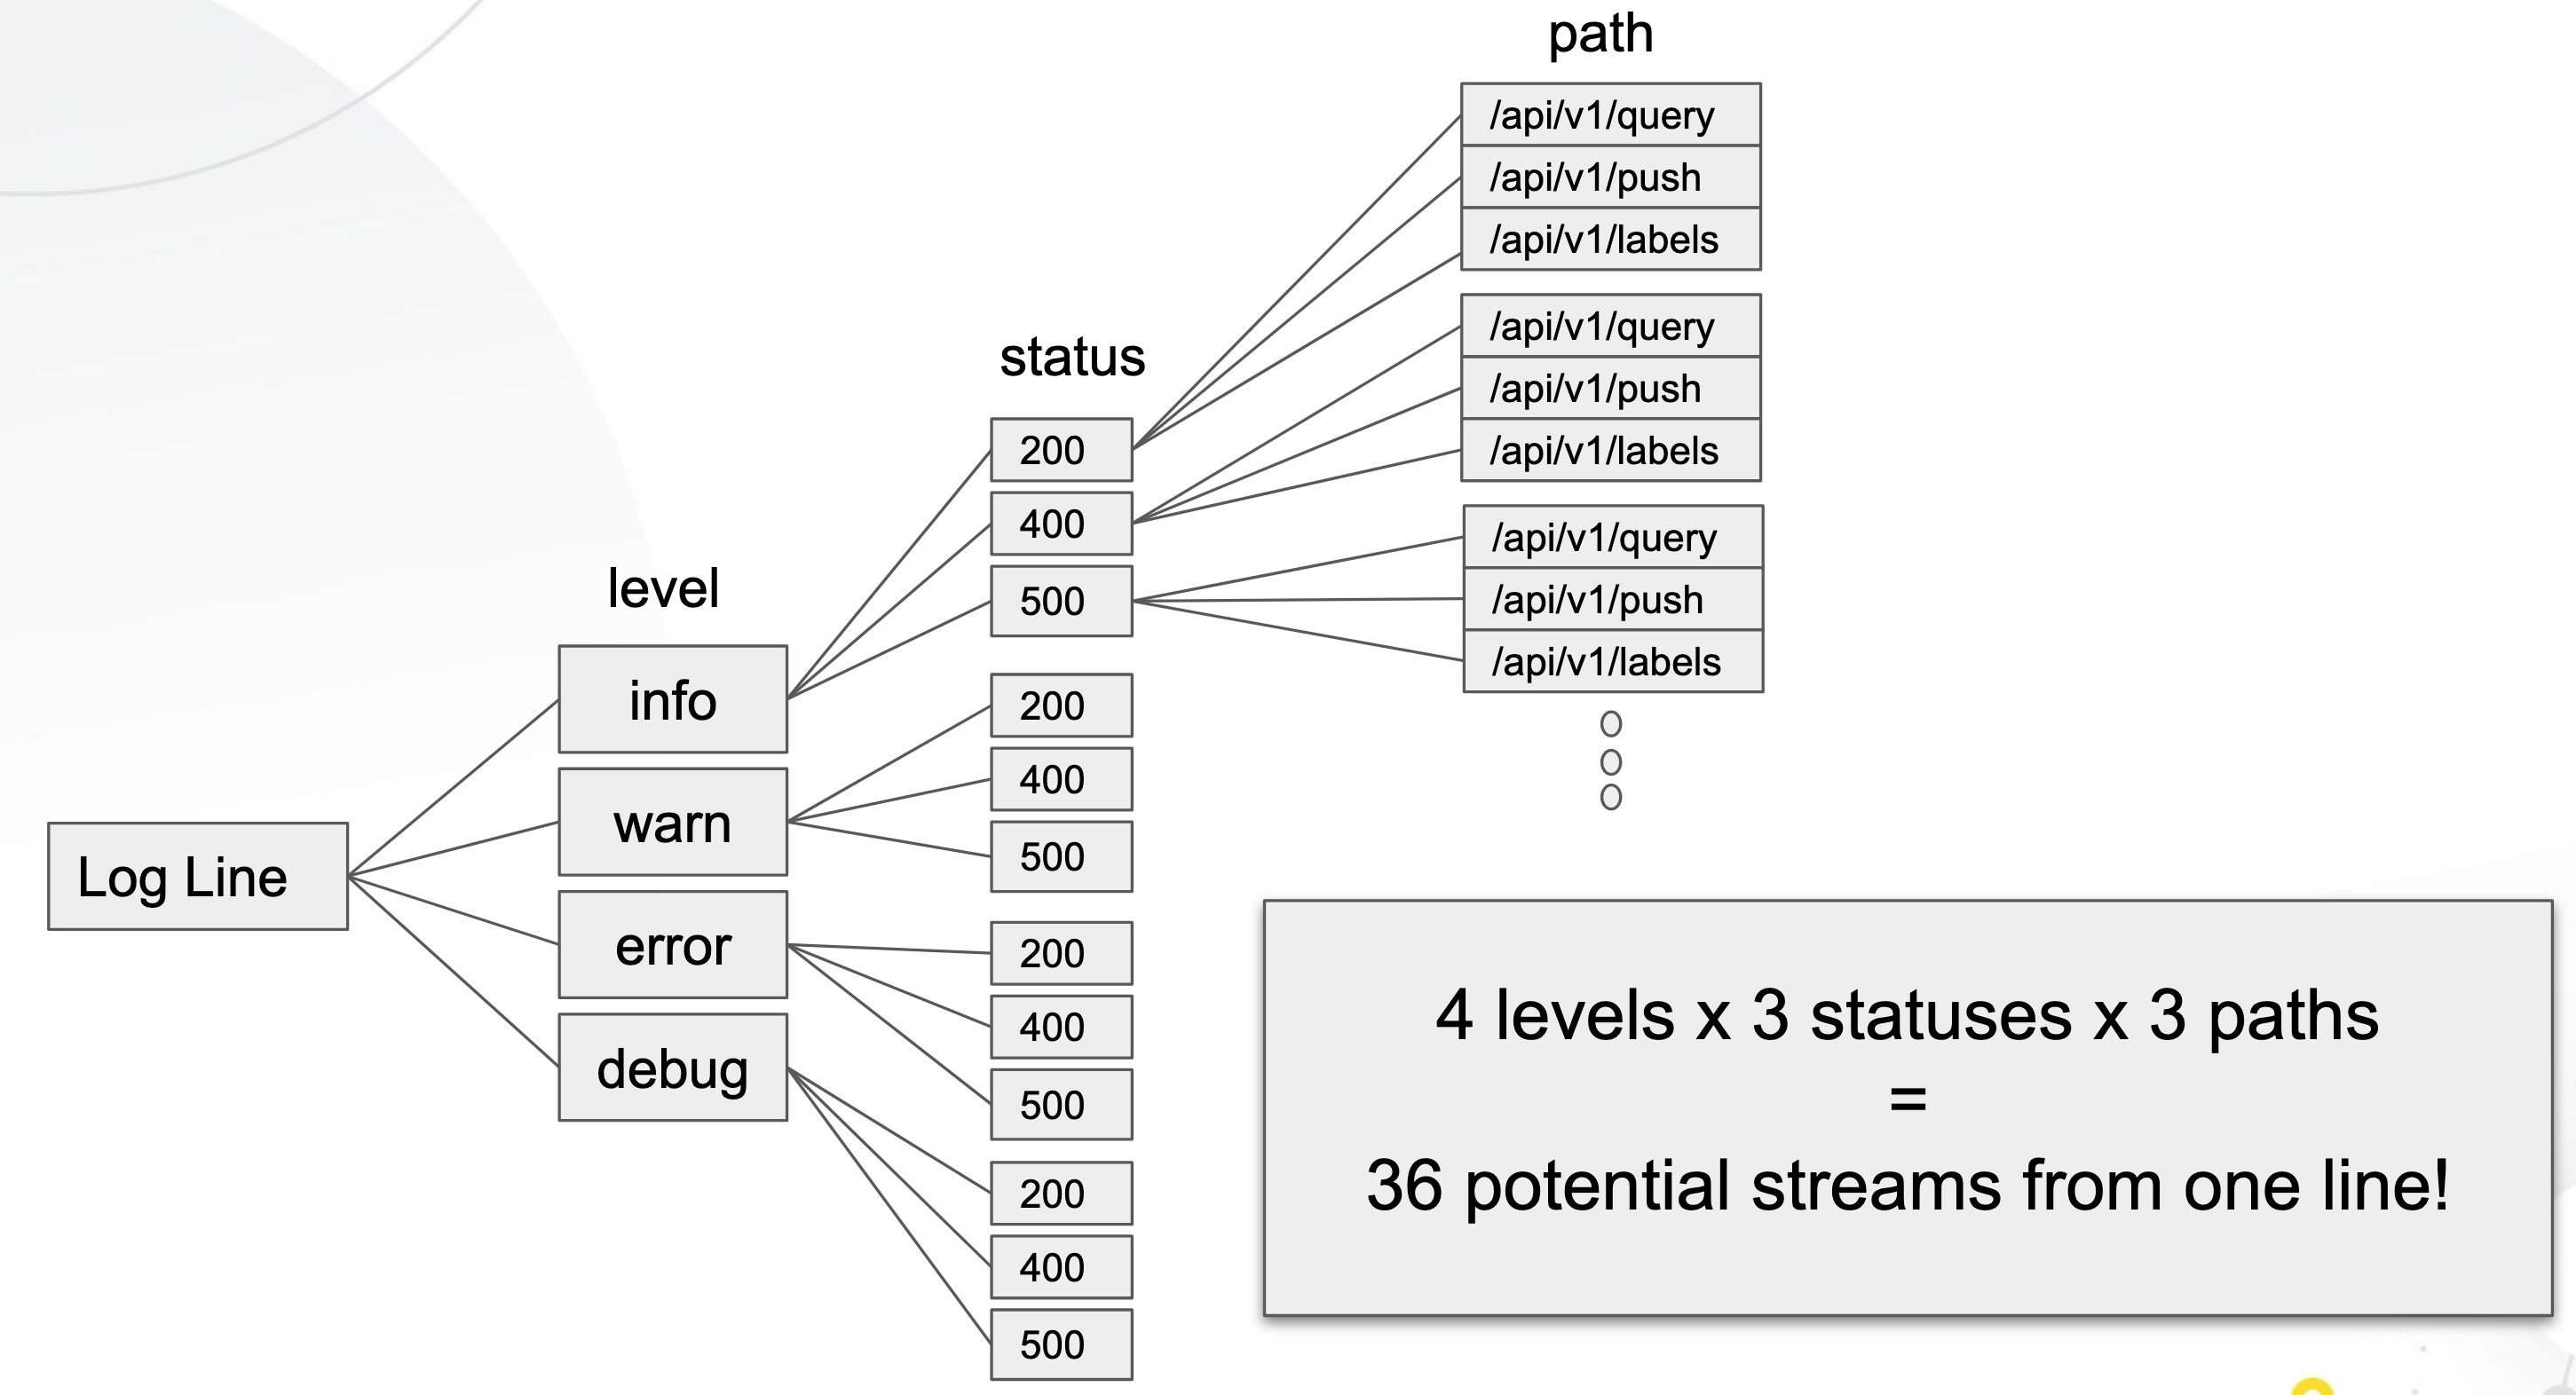
High cardinality is bad for labels, as something like a IP address can reduce your performance a lot, as it will create a stream for every unique IP label.

Static defined labels such as environment, hostnames are good, you can read more up about it here

Here is a info graphic on how one log line can be split up into 36 streams:

So with that being said, good labels will be considered as cluster, job, namespace, environment, etc where as bad labels will be things such as userid, ip address, url path, etc

Selecting logstreams with Loki

Selecting logstreams, is done by using label matchers and filter expressions, such as this example:

1
{job="dockerlogs", environment="development"} |= "POST" |~ "196.35.64.+"

Label Matchers and Filter Expressions support:

  • = Contains string
  • != Does not contain string
  • =~ Matches regular expression
  • !~ Does not match regular expression

Supported Clients

At the moment of writing, loki supports the following log clients:

  • Promtail (tails logs and ships to Loki)
  • Docker Driver
  • Fluentd
  • Fluent Bit
  • Logstash

We will be going into more detail on using promtail in a future post, but you can read more up about it here

Loki in Action

Time to get to the fun part, clone my github repo:

1
2
$ git clone https://github.com/ruanbekker/loki-docker-nginx-example
$ cd loki-docker-nginx-example

You can inspect the docker-compose.yml:

1
2
3
4
5
6
7
8
9
10
11
12
13
14
15
16
17
18
19
20
21
22
23
24
25
26
27
28
29
30
31
32
33
$ cat docker-compose.yml
version: "3.4"

services:
  my-nginx-service:
    image: nginx
    container_name: my-nginx-service
    ports:
      - 8000:80
    environment:
      - FOO=bar
    logging:
      driver: loki
      options:
        loki-url: http://localhost:3100/loki/api/v1/push
        loki-external-labels: job=dockerlogs,owner=ruan,environment=development

  grafana:
    image: grafana/grafana:7.1.1
    volumes:
    - ./config/datasource.yml:/etc/grafana/provisioning/datasources/datasource.yml
    ports:
    - "3000:3000"

  loki:
   image: grafana/loki:v1.3.0
   volumes:
     - ./config/loki.yaml:/etc/config/loki.yaml
   entrypoint:
     - /usr/bin/loki
     - -config.file=/etc/config/loki.yaml
   ports:
     - "3100:3100"

As you can see loki will be the datasource where we will be pushing our logs to from our nginx container and we are defining our logging section where it should find loki and we are also setting labels to that log stream using loki-external-labels. Then we are using grafana to auto configure the loki datasource from the ./config/datasource.yml section so that we can visualize our logs.

If you don’t want to define the logging section per container, you can always set the defaults using the /etc/docker/daemon.json by following this guide

Let’s boot up our stack:

1
$ docker-compose up

After everything is up, you should be able to access nginx by visiting: http://nginx.localdns.xyz:8000/, after you received a response, visit Grafana on http://grafana.localdns.xyz:3000 using the username and password: admin/admin.

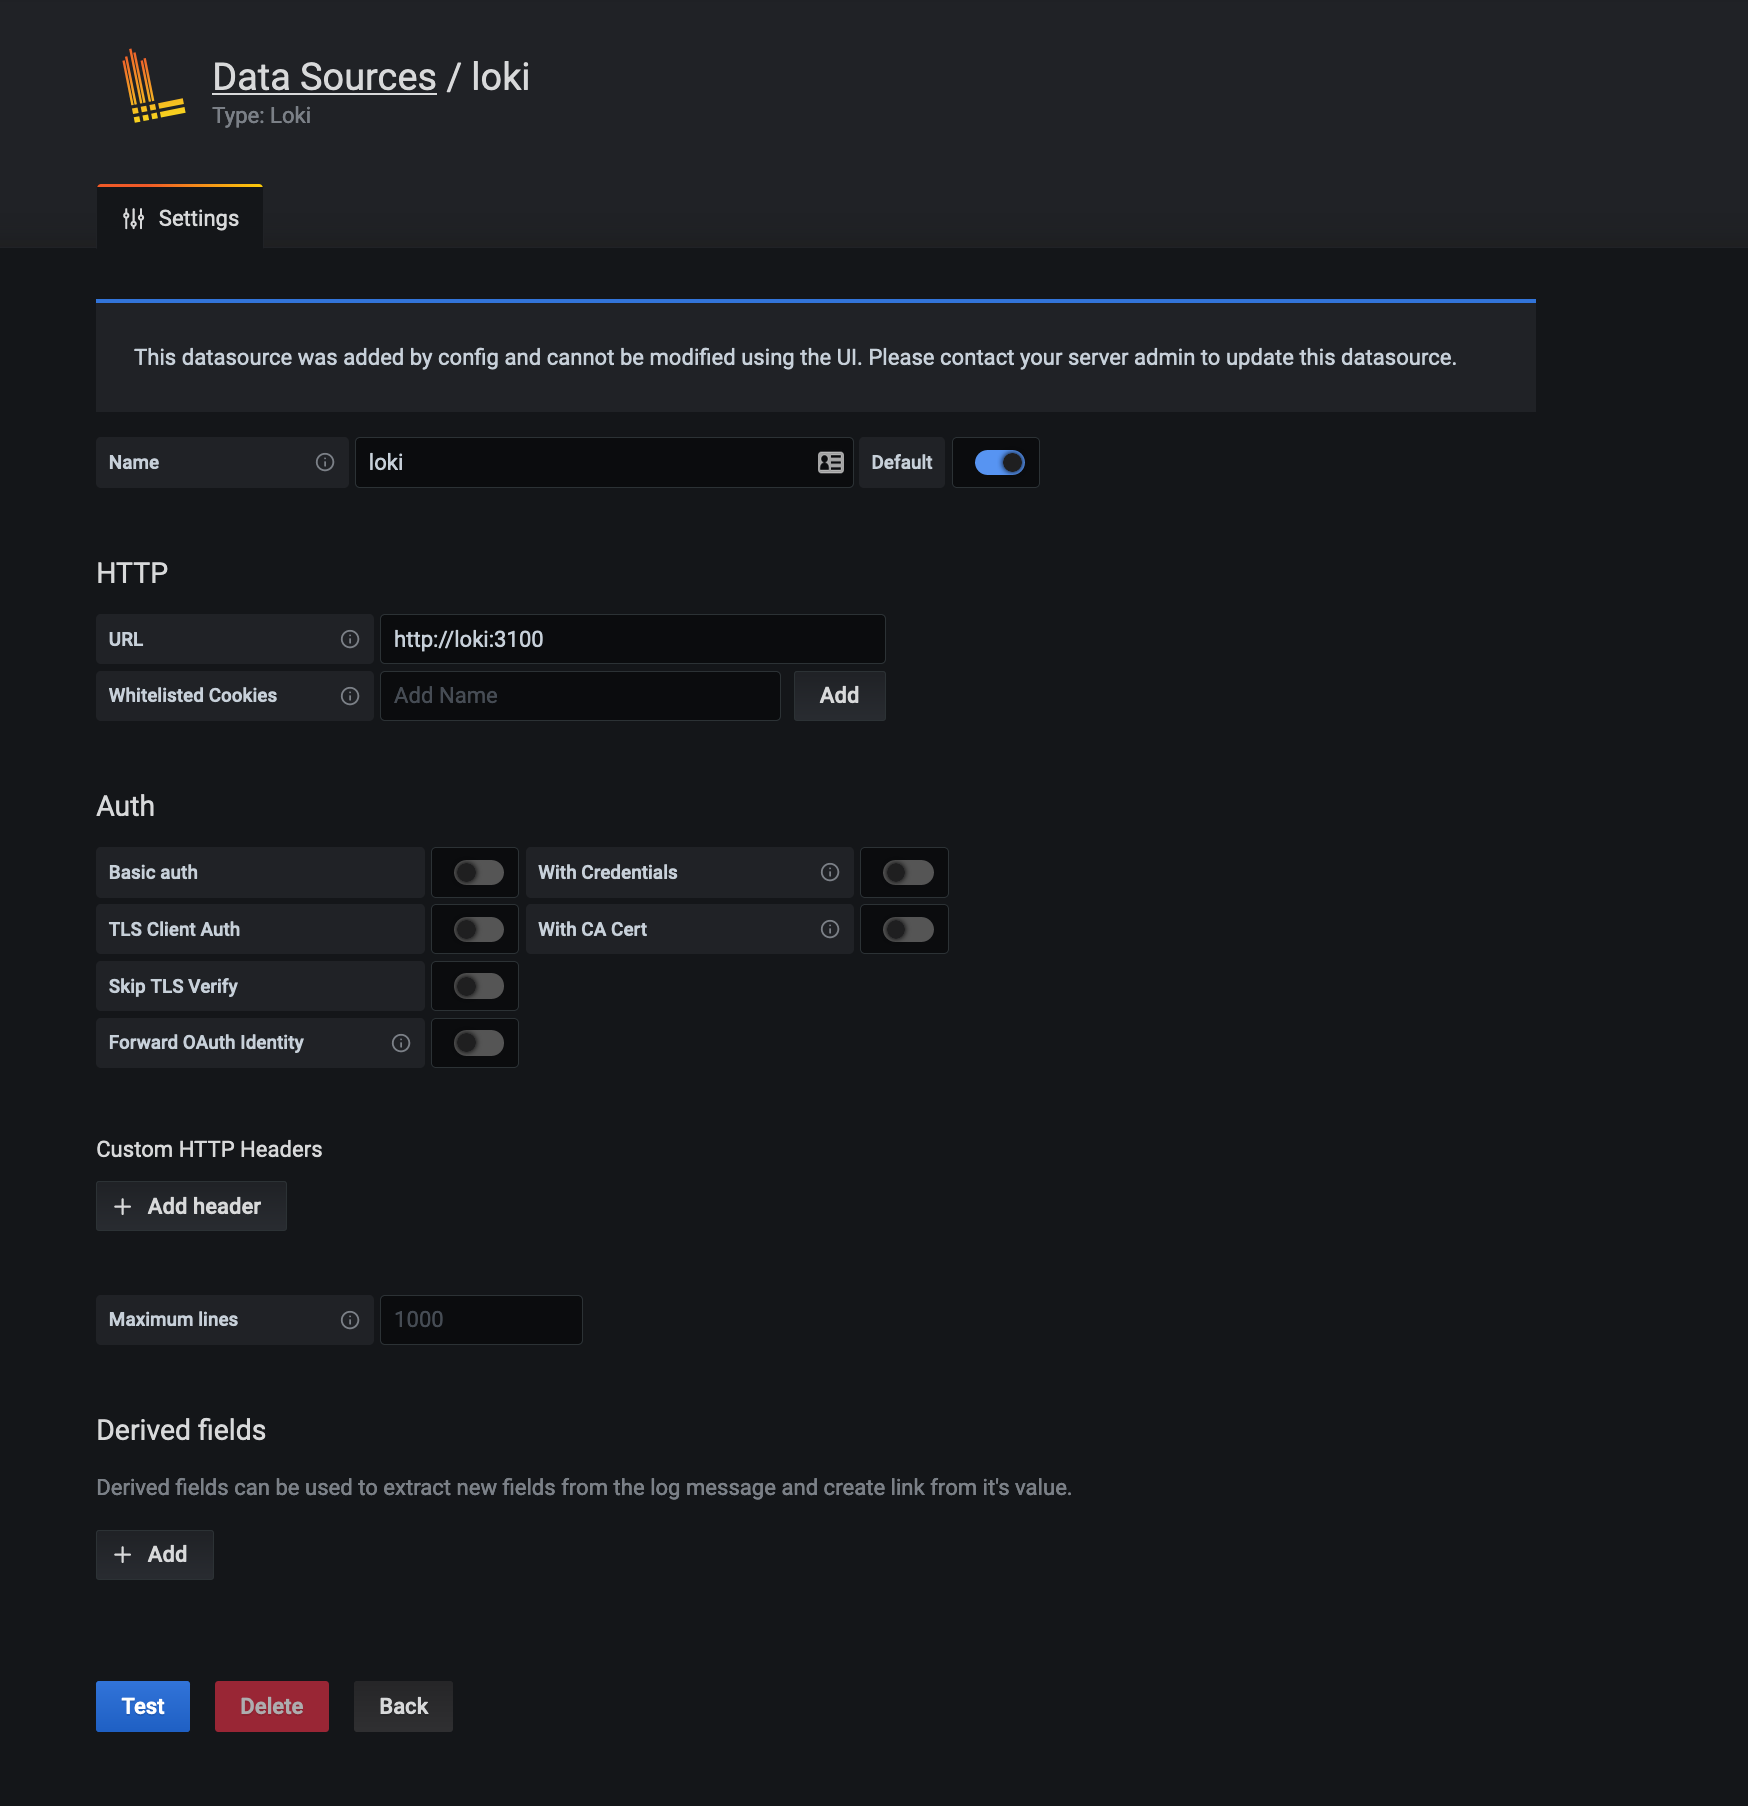
If you head over to datasources, you should see the loki datasource which was provisioned for you:

loki-grafana

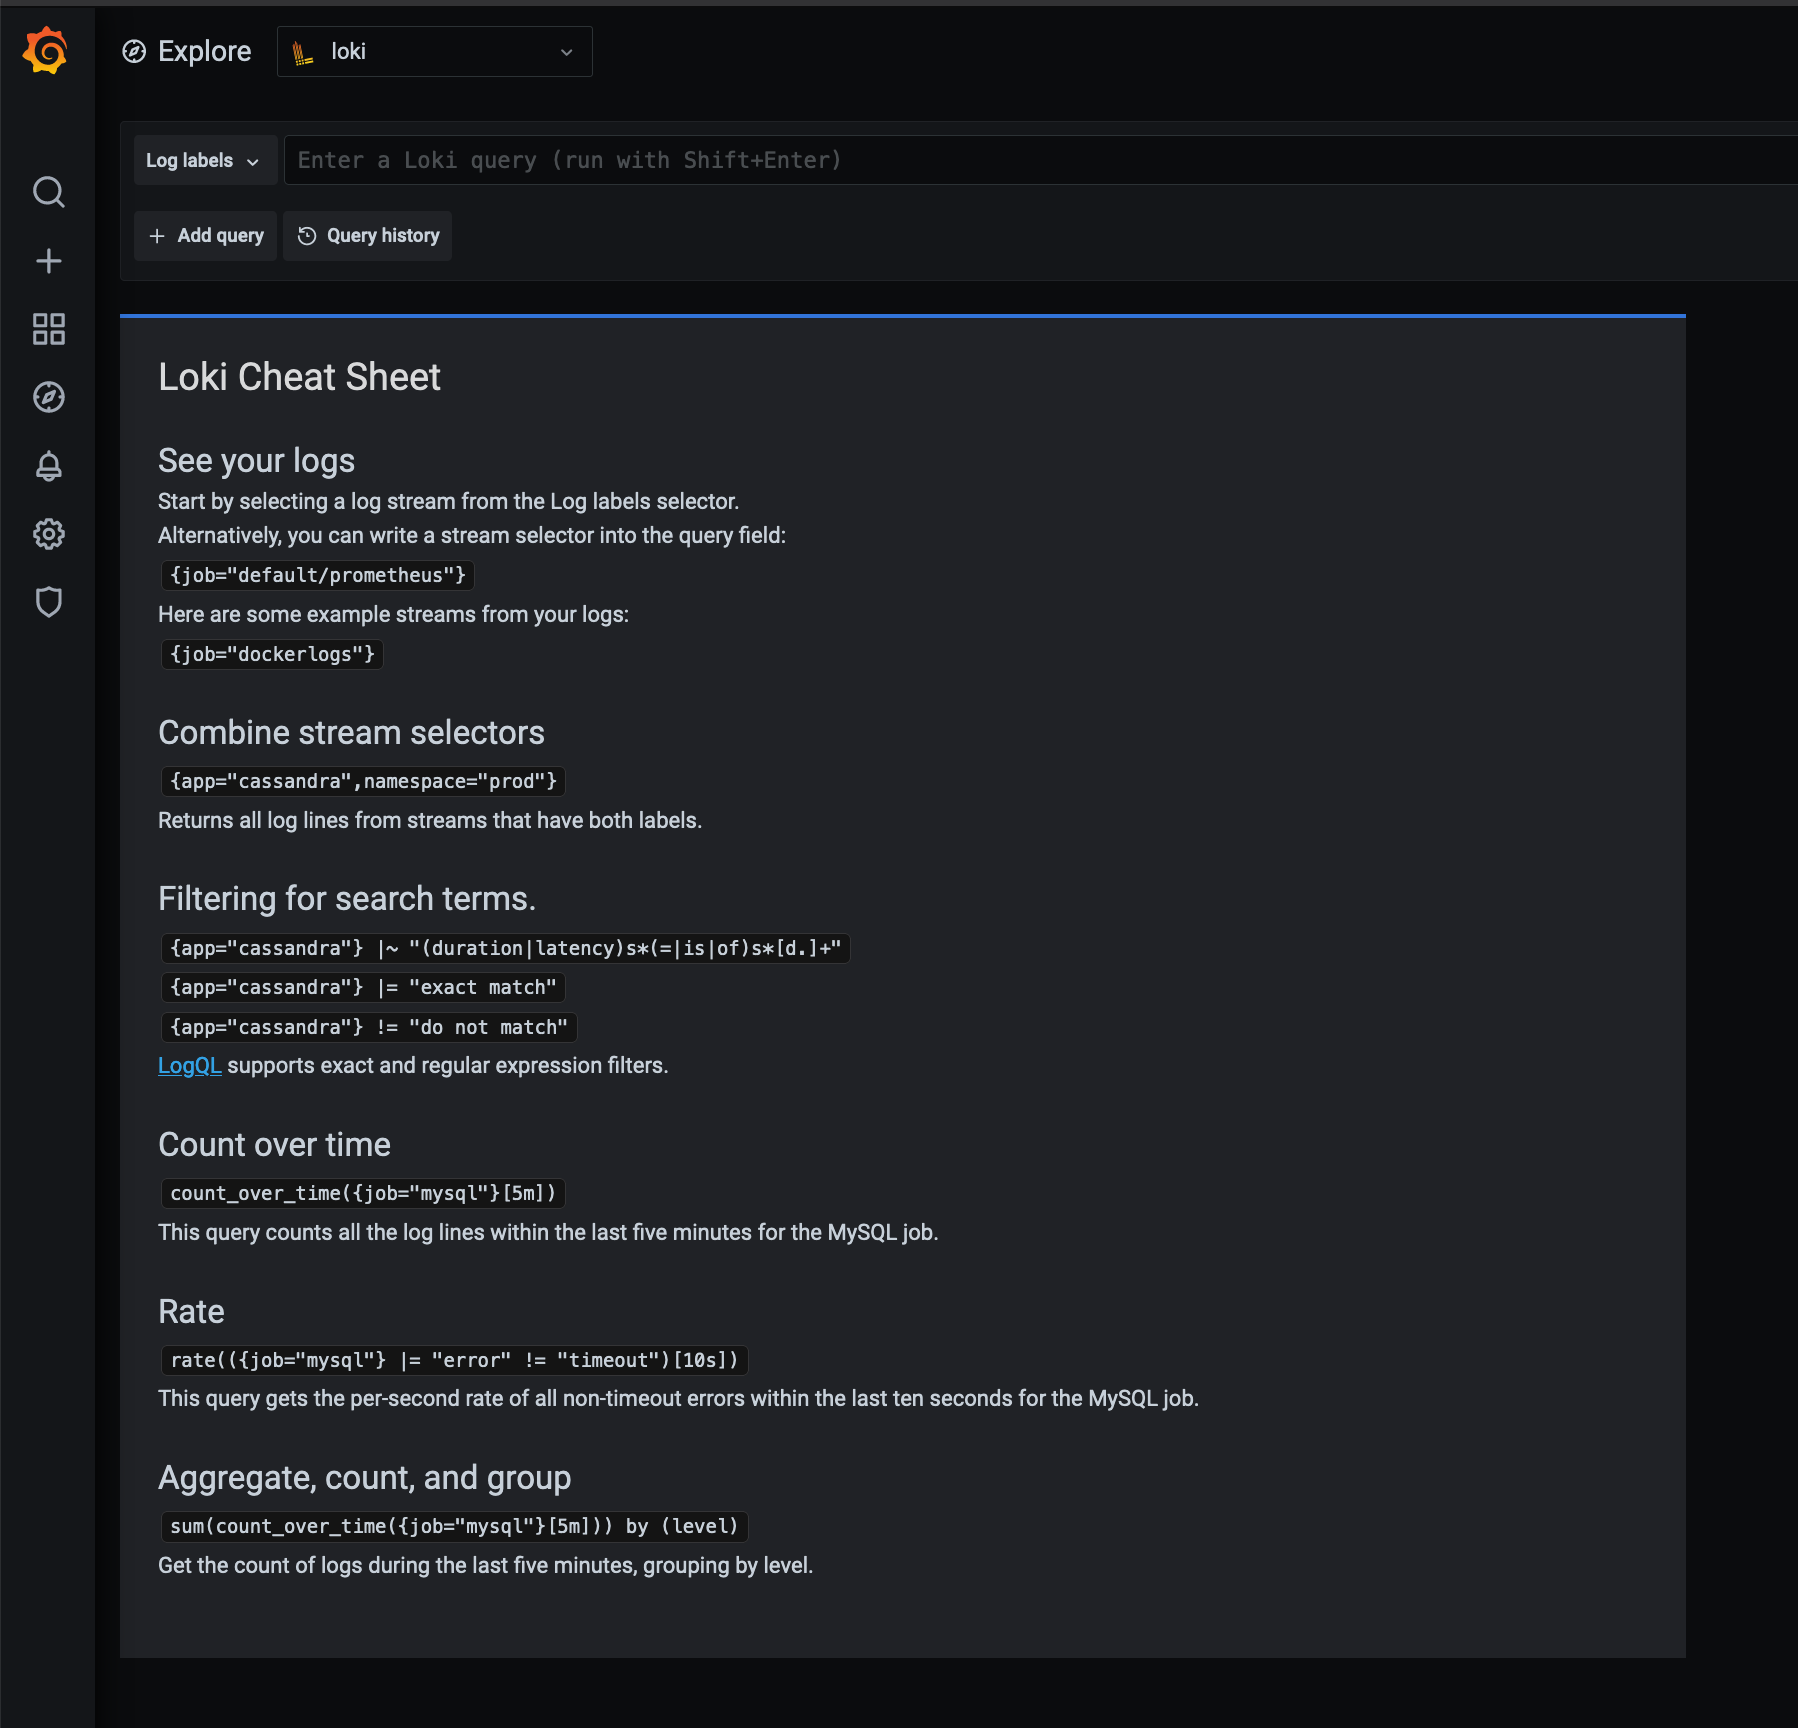
When you head to the left on explore and you select the loki datasource on http://grafana.localdns.xyz:3000/explore you should see the following:

loki-grafana

You will see that grafana discovers logstreams with the label job as you can see that our job="dockerlogs" can be seen there. We can either click on it, select the log labels from the left and browse the label we want to select or manually enter the query.

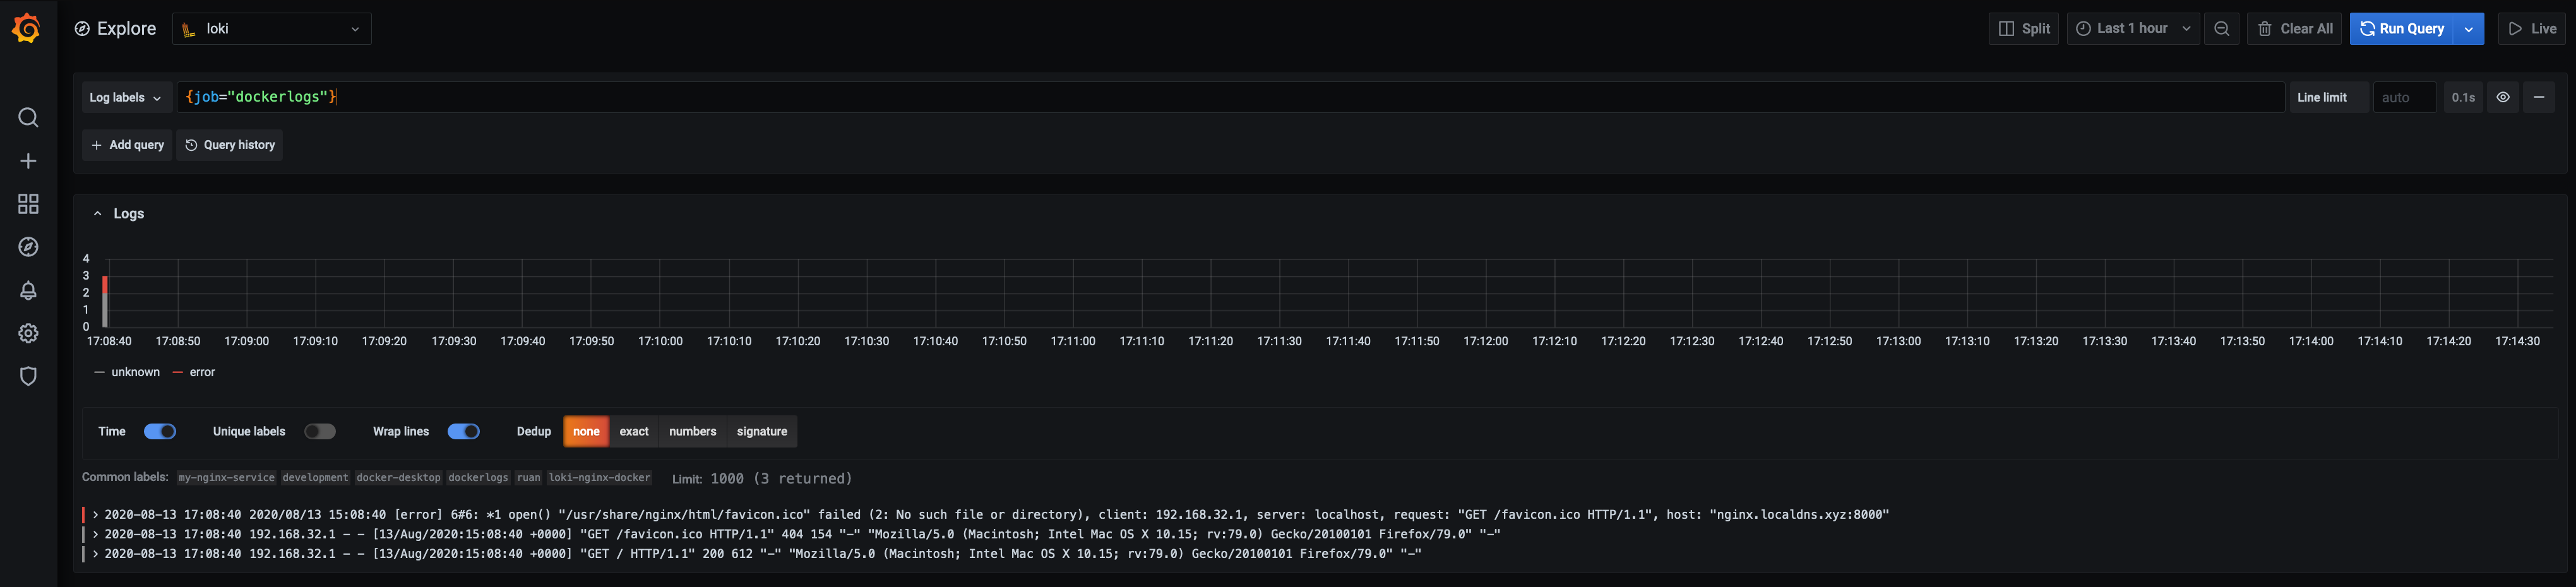
I will be using the query manually:

1
{job="dockerlogs"}

So now we will get all the logs that has that label associated and as you can see, we see our request that we made:

nginx-grafana-loki

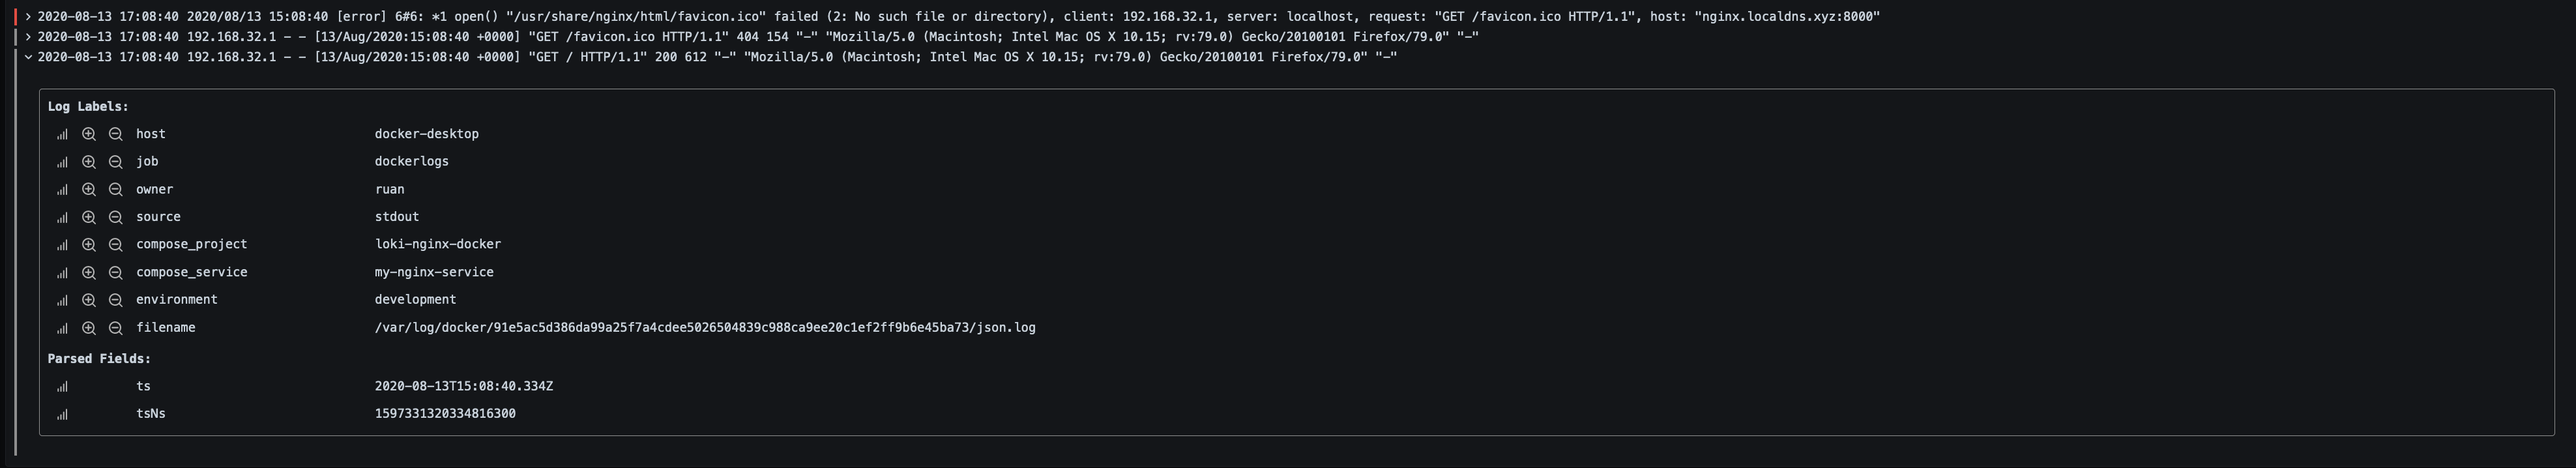
We can see one error due to the favicon.ico that it could not find, but let’s first inspect our first log line:

loki

Here we can see the labels assigned to that log event, which we can include in our query, like if we had multiple services and different environments, we can use a query like the following to only see logs for a specific service and environment:

1
{job="dockerlogs", environment="development", compose_service="my-nginx-service"}

In the example above we used the selectors to select the logs we want to see, now we can use our filter expressions, to “grep” our logs.

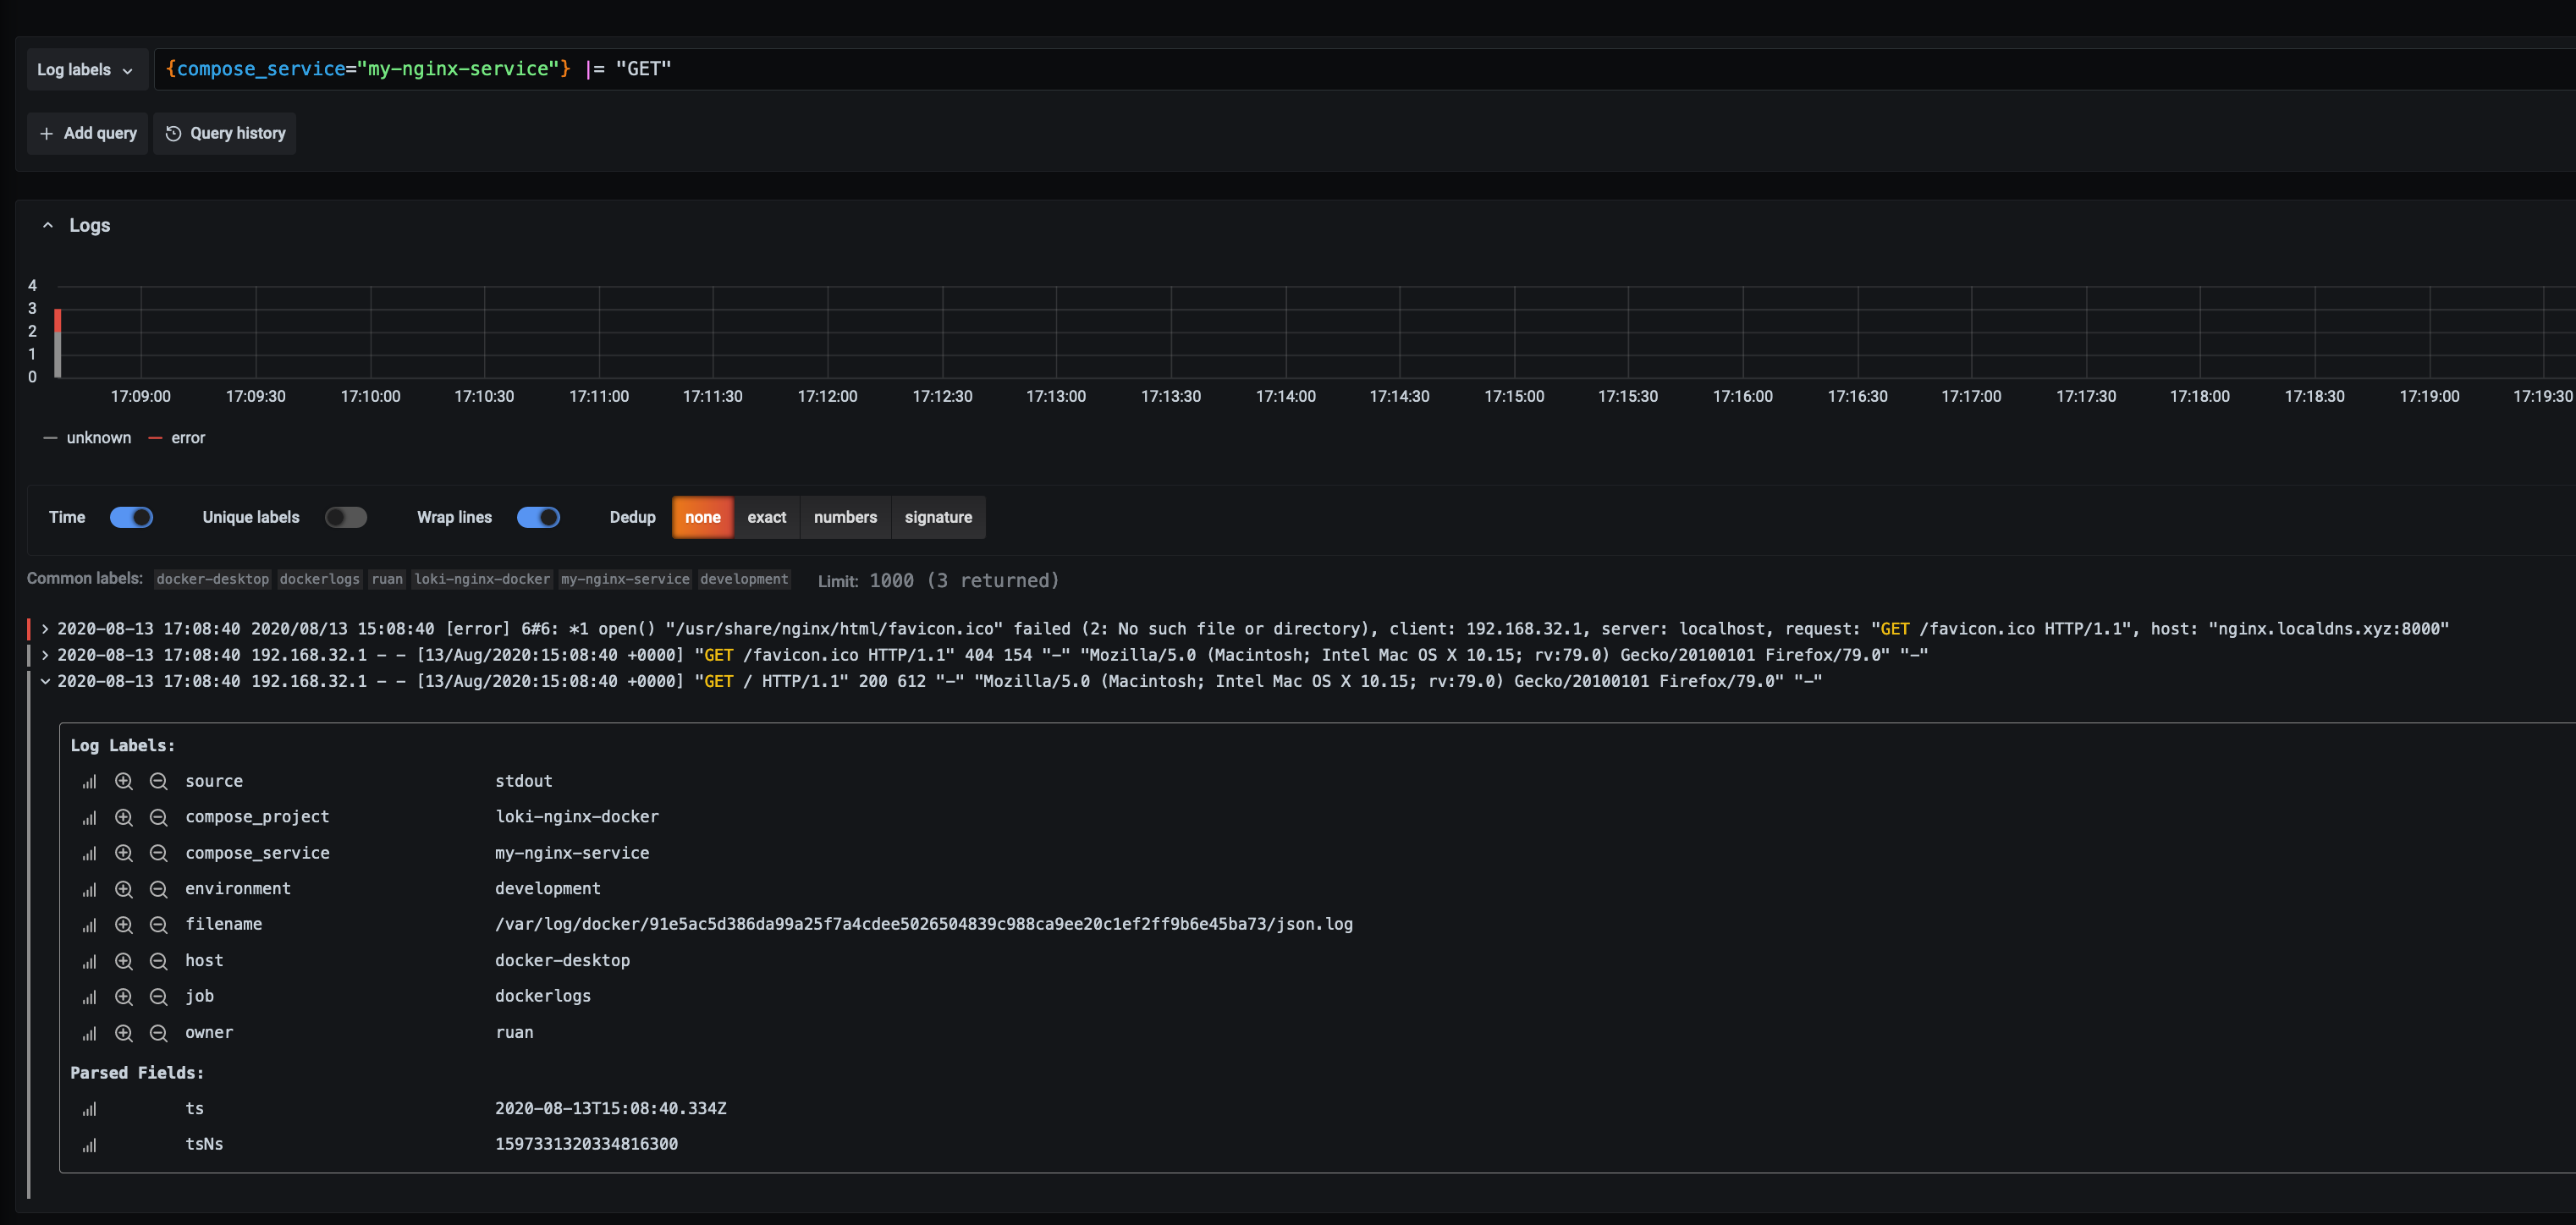
Let’s say we want to focus only on one service, and we want to filter for any logs with GET requests, so first we select to service then apply the filter expression:

1
{compose_service="my-nginx-service"} |= "GET"

loki-logs

As you can see we can see the ones we were looking for, we can also chain them, so we want to se GET’s and errors:

1
{compose_service="my-nginx-service"} |= "GET" |= "error"

And lets say for some reason we only want to see the logs that comes from a 192.168.32 subnet:

1
{compose_service="my-nginx-service"} |= "GET" |= "error" |~ "192.168.32."

But we dont want to see requests from “nginx.localdns.xyz”:

1
{compose_service="my-nginx-service"} |= "GET" |= "error" |~ "192.168.32." != "nginx.localdns.xyz"

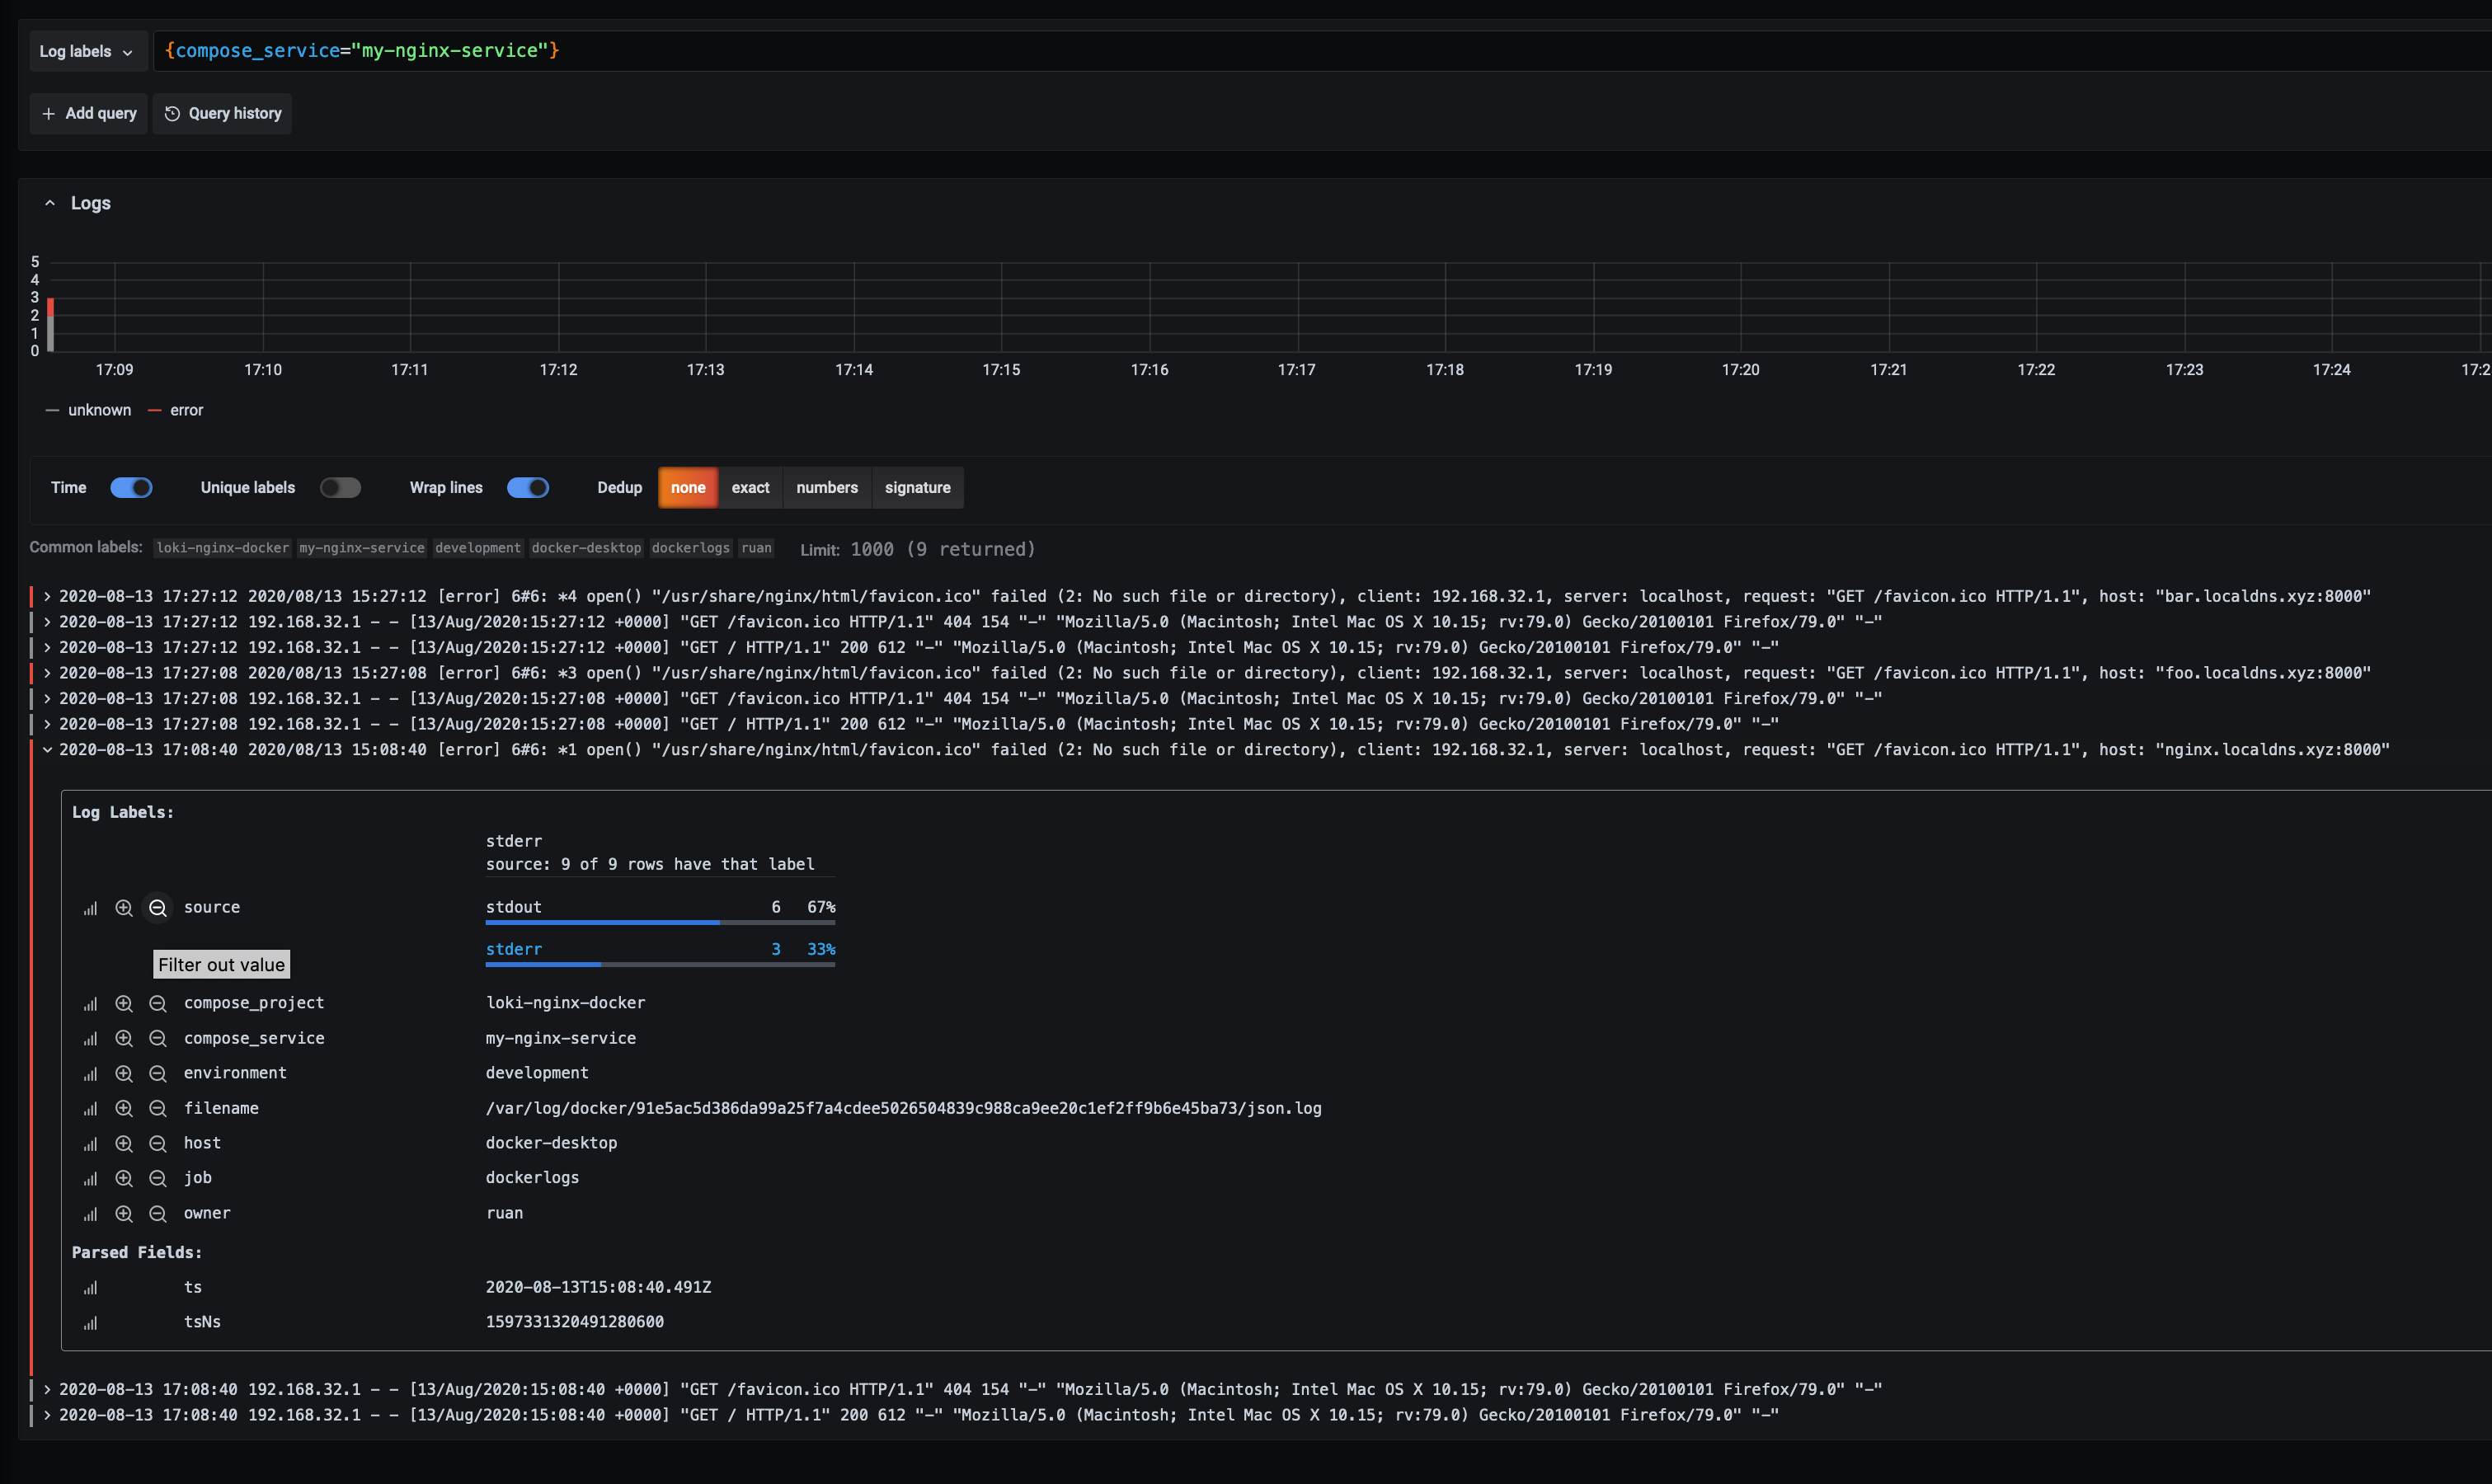
Make two extra get requests to “foo.localdns.xyz:8000” and “bar.localdns.xyz:8000” and then we change the query to say that we only want to see errors and hostnames coming from the 2 requests that we made:

1
{compose_service="my-nginx-service"} |= "error" |~ "(foo|bar).localdns.xyz"

If we expand one of the log lines, we can do a ad-hoc analysis to see the percentage of logs by source for example:

loki-logs

LogCLI

If you prefer the cli to query logs, logcli is the command line client for loki, allows you to query logs from your terminal and has clients for linux, mac and windows.

Check the releases for the latest version:

1
2
3
$ wget https://github.com/grafana/loki/releases/download/v1.5.0/logcli-darwin-amd64.zip
$ unzip logcli-darwin-amd64.zip
$ mv logcli-darwin-amd64 /usr/local/bin/logcli

Set your environment details, in our case we dont have a username and password for loki:

1
2
3
$ #export LOKI_USERNAME=${MYUSER}
$ #export LOKI_PASSWORD=${MYPASS}
$ export LOKI_ADDR=http://localhost:3001

We can view all our labels, let’s view all the job labels:

1
2
3
$ logcli labels job
http://localhost:3001/loki/api/v1/label/job/values
dockerlogs

Let’s look at family apps nginx logs:

1
2
3
4
$ logcli query '{job="dockerlogs"}'
http://localhost:3001/loki/api/v1/query_range?direction=BACKWARD&end=1587727924005496000&limit=30&query=%7Bjob%3D%22dockerlogs%22%2C&start=1587724324005496000
Common labels: {environment="development", owner="ruan", compose_service="my-nginx-service", job="dockerlogs", host="docker-desktop", compose_project="loki-nginx-docker"}
2020-08-13 17:08:40 192.168.32.1 - - [13/Aug/2020:15:08:40 +0000] "GET / HTTP/1.1" 200 612 "-" "Mozilla/5.0 (Macintosh; Intel Mac OS X 10.15; rv:79.0) Gecko/20100101 Firefox/79.0" "-"

We can also pipe that output to grep, awk, etc:

1
$ logcli query '{job="dockerlogs"}' | grep GREP | awk -F 'X' '{print  $1}'

Supported arguments:

1
2
3
4
5
6
7
8
9
10
11
12
13
14
15
16
17
18
19
20
21
22
23
24
25
26
27
28
29
30
31
32
33
34
35
36
37
38
39
40
41
$ logcli query --help
usage: logcli query [<flags>] <query>


Run a LogQL query.


Flags:
      --help             Show context-sensitive help (also try --help-long and --help-man).
      --version          Show application version.
  -q, --quiet            suppress everything but log lines
      --stats            show query statistics
  -o, --output=default   specify output mode [default, raw, jsonl]
  -z, --timezone=Local   Specify the timezone to use when formatting output timestamps [Local, UTC]
      --addr="http://localhost:3100"
                         Server address. Can also be set using LOKI_ADDR env var.
      --username=""      Username for HTTP basic auth. Can also be set using LOKI_USERNAME env var.
      --password=""      Password for HTTP basic auth. Can also be set using LOKI_PASSWORD env var.
      --ca-cert=""       Path to the server Certificate Authority. Can also be set using LOKI_CA_CERT_PATH env var.
      --tls-skip-verify  Server certificate TLS skip verify.
      --cert=""          Path to the client certificate. Can also be set using LOKI_CLIENT_CERT_PATH env var.
      --key=""           Path to the client certificate key. Can also be set using LOKI_CLIENT_KEY_PATH env var.
      --org-id=ORG-ID    org ID header to be substituted for auth
      --limit=30         Limit on number of entries to print.
      --since=1h         Lookback window.
      --from=FROM        Start looking for logs at this absolute time (inclusive)
      --to=TO            Stop looking for logs at this absolute time (exclusive)
      --step=STEP        Query resolution step width
      --forward          Scan forwards through logs.
      --no-labels        Do not print any labels
      --exclude-label=EXCLUDE-LABEL ...
                         Exclude labels given the provided key during output.
      --include-label=INCLUDE-LABEL ...
                         Include labels given the provided key during output.
      --labels-length=0  Set a fixed padding to labels
  -t, --tail             Tail the logs
      --delay-for=0      Delay in tailing by number of seconds to accumulate logs for re-ordering


Args:
  <query>  eg '{foo="bar",baz=~".*blip"} |~ ".*error.*"'

Thank you

I hope this was useful

Setup a Hugo Blog With the Kiera Theme

hugo-blog-kiera-theme

In this tutorial we will setup a Hugo Blog with the Kiera theme on Linux and will be using Ubuntu for this demonstration, but since Hugo runs on Go, you can run this on Windows, Linux or Mac.

Dependencies

We require git to download the theme from github, so first update your package managers indexes, and install git:

1
$ apt update && apt install git -y

Install golang (optional):

1
2
3
4
5
$ VERSION=1.14.4
$ wget "https://dl.google.com/go/go${VERSION}.linux-amd64.tar.gz"
$ tar -xf go$VERSION.linux-amd64.tar.gz -C /usr/local
$ echo 'export HUGO_HOME=/usr/local/hugo' >> ~/.profile
$ echo 'export PATH=$PATH:$HUGO_HOME/bin' >> ~/.profile

When we source our profile, we sound be able to get the go version:

1
2
3
$ source ~/.profile
$ go version
go version go1.14.4 linux/amd64

Now to install Hugo:

1
2
3
4
5
$ mkdir -p /usr/local/hugo/bin
$ wget https://github.com/gohugoio/hugo/releases/download/v0.72.0/hugo_0.72.0_Linux-64bit.tar.gz
$ tar -xf hugo_0.72.0_Linux-64bit.tar.gz -C /usr/local/hugo/bin
$ echo 'export HUGO_HOME=/usr/local/hugo' >> ~/.profile
$ echo 'export PATH=$PATH:$HUGO_HOME/bin' >> ~/.profile

After sourcing the profile we should see the hugo version:

1
2
3
$ source ~/.profile
$ hugo version
Hugo Static Site Generator v0.72.0-8A7EF3CF linux/amd64 BuildDate: 2020-05-31T12:07:45Z

Create the Hugo Workspace

Create the directory where we will host our blogs and change into that directory:

1
2
$ mkdir -p ~/websites 
$ cd ~/websites

Create your site with hugo:

1
2
3
$ hugo new site awesome-blog
Congratulations! Your new Hugo site is created in /home/ubuntu/websites/awesome-blog.
Visit https://gohugo.io/ for quickstart guide and full documentation.

Change into the directory that was created:

1
$ cd awesome-blog/

Themes

Hugo has a extensive list of themes, but for this demonstration we will use kiera.

Download the theme to the themes directory:

1
$ git clone https://github.com/avianto/hugo-kiera themes/kiera

Let’s run the server and see how it looks like out of the box:

1
$ hugo server --theme=kiera --bind=0.0.0.0 --environment development

By default hugo uses the port 1313, so accessing Hugo should look like this:

Customize Hugo

So let’s customize Hugo a bit by adding some content such as a navbar and social icons:

1
2
3
4
5
6
7
8
9
10
11
12
13
14
15
16
17
18
19
20
21
22
23
24
25
26
27
28
29
30
31
32
33
34
35
36
37
38
39
40
$ cat ./config.yml
baseurl = "http://192.168.64.17/"
title = "My Hugo Blog"
copyright = "Copyright © 2020 - Ruan Bekker"
canonifyurls = true
theme = "kiera"

paginate = 3

summaryLength = 30
enableEmoji = true
pygmentsCodeFences = true

[author]
    name = "Ruan Bekker"
    github = "ruanbekker"
    gitlab = "rbekker87"
    linkedin = "ruanbekker"
    facebook = ""
    twitter = "ruanbekker"
    instagram = ""

[params]
    tagline = "A Hugo theme for creative and technical writing"

[menu]

  [[menu.main]]
    identifier = "about"
    name = "about hugo"
    pre = "<i class='fa fa-heart'></i>"
    url = "/about/"
    weight = -110

  [[menu.main]]
    name = "getting started"
    post = "<span class='alert'>New!</span>"
    pre = "<i class='fa fa-road'></i>"
    url = "/getting-started/"
    weight = -100

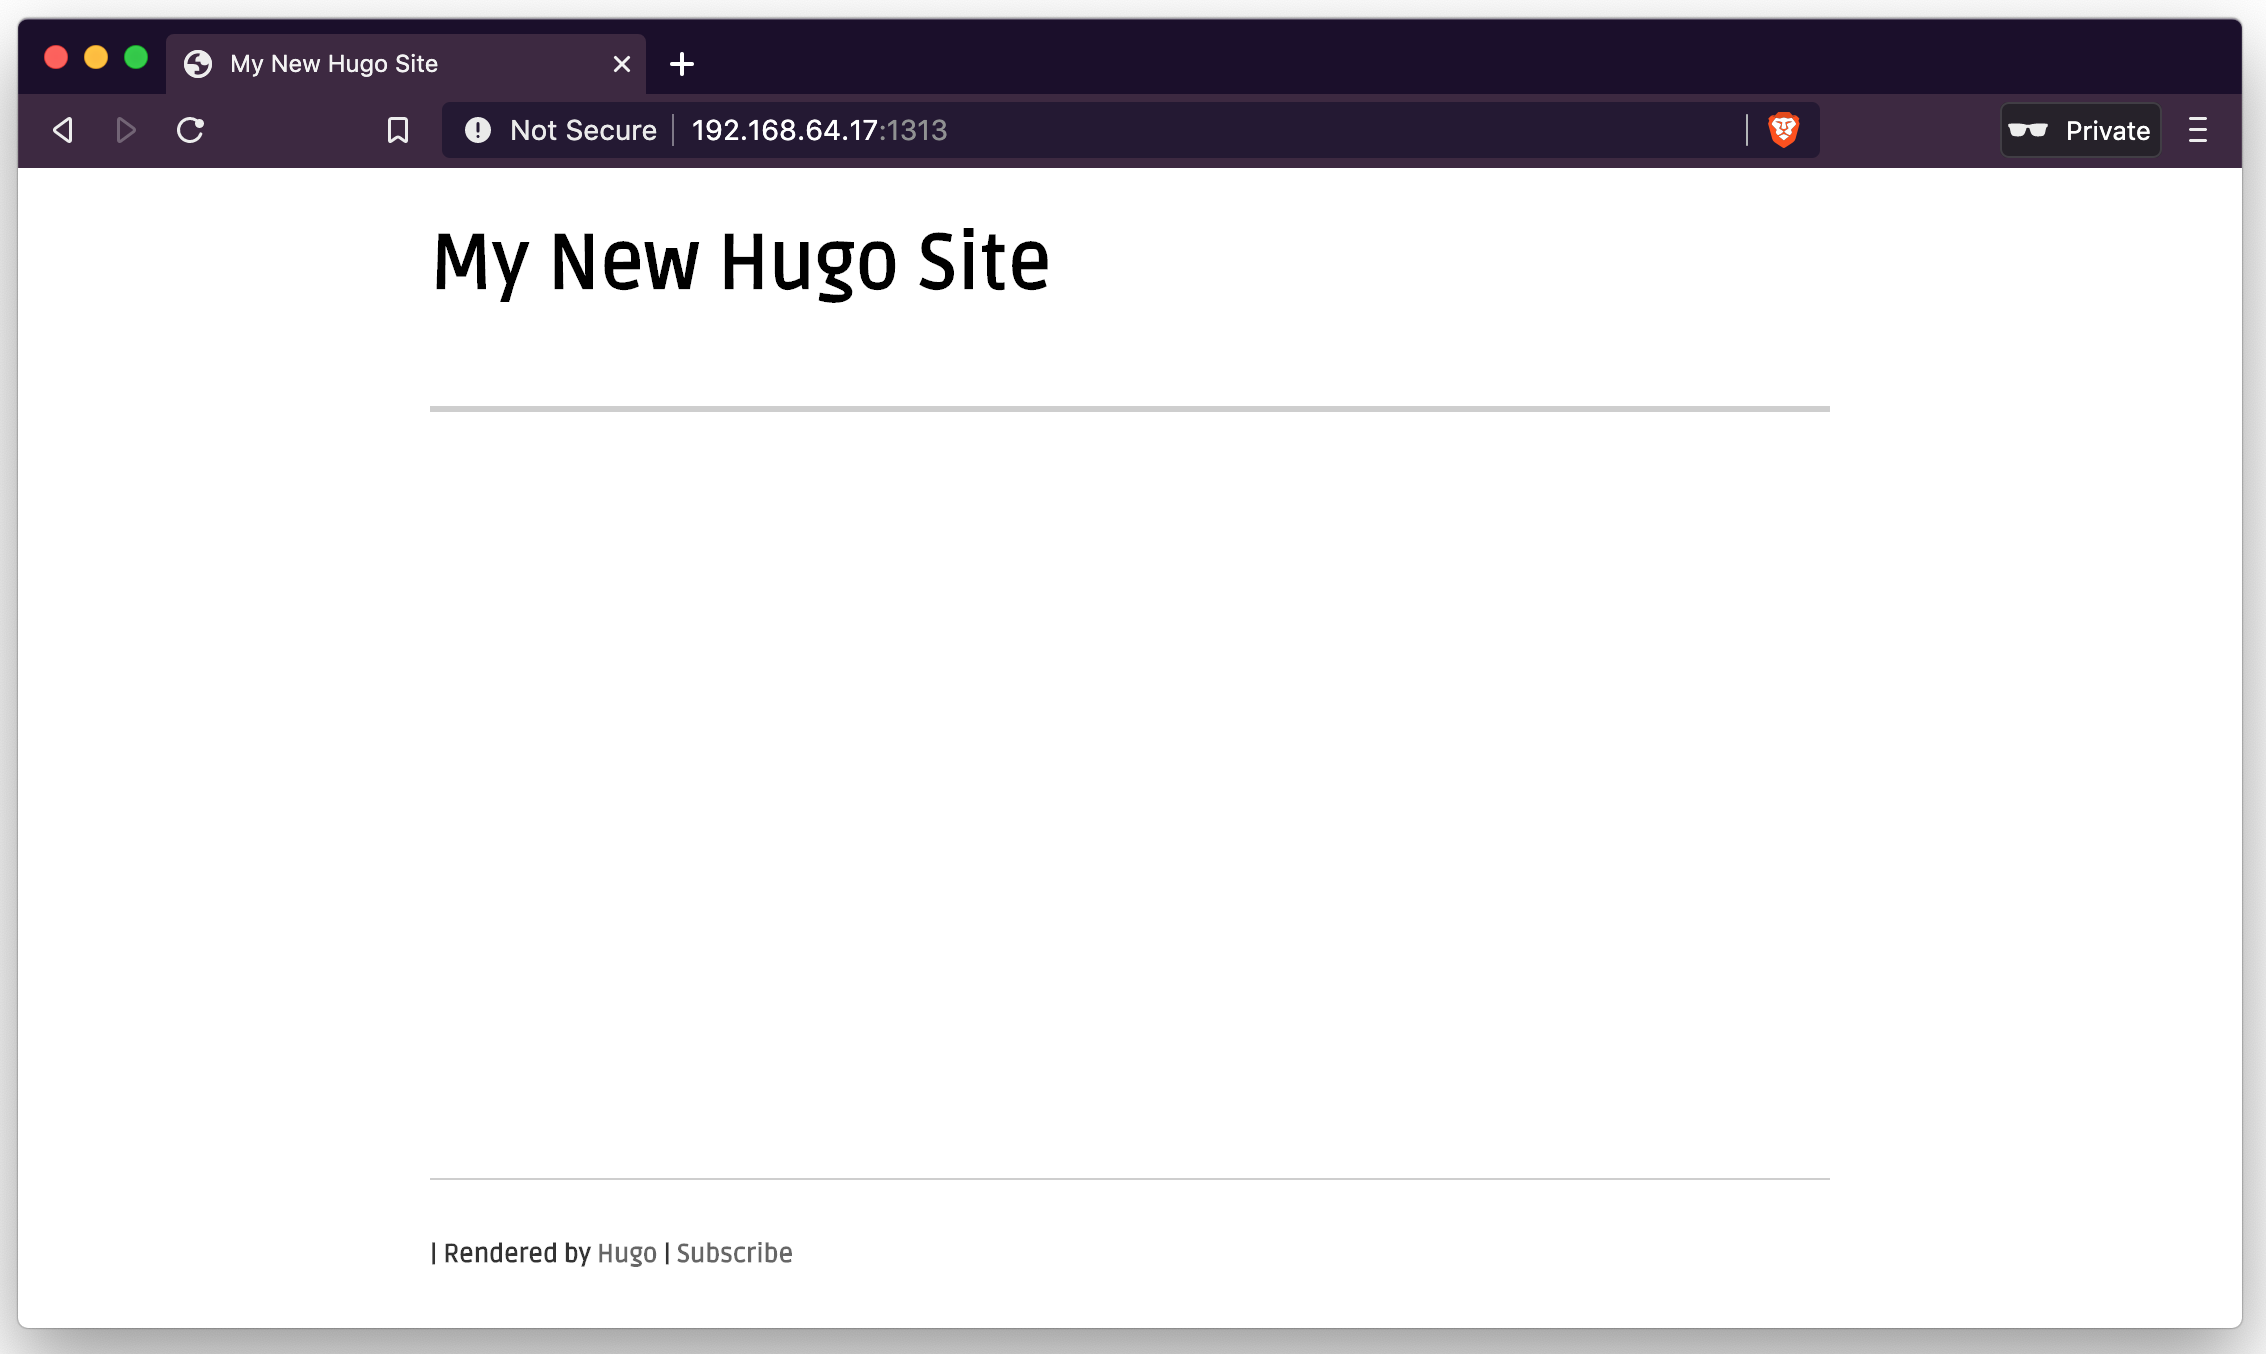
After config has been applied to ./config.yml and we start our server up again:

1
$ hugo server --theme=kiera --bind=0.0.0.0 --environment development

We should see this:

Create your First Post

Creating the first post:

1
2
$ hugo new posts/my-first-post.md
/home/ubuntu/websites/awesome-blog/content/posts/my-first-post.md created

Let’s add some sample data to our markdown file that hugo created:

1
2
3
4
5
6
7
8
9
+++
title = "My First Post"
date = 2020-06-14T15:47:17+02:00
draft = false
tags = ["hugo", "kiera"]
categories = ["hugo-blog"]
+++

-> markdown content here <-

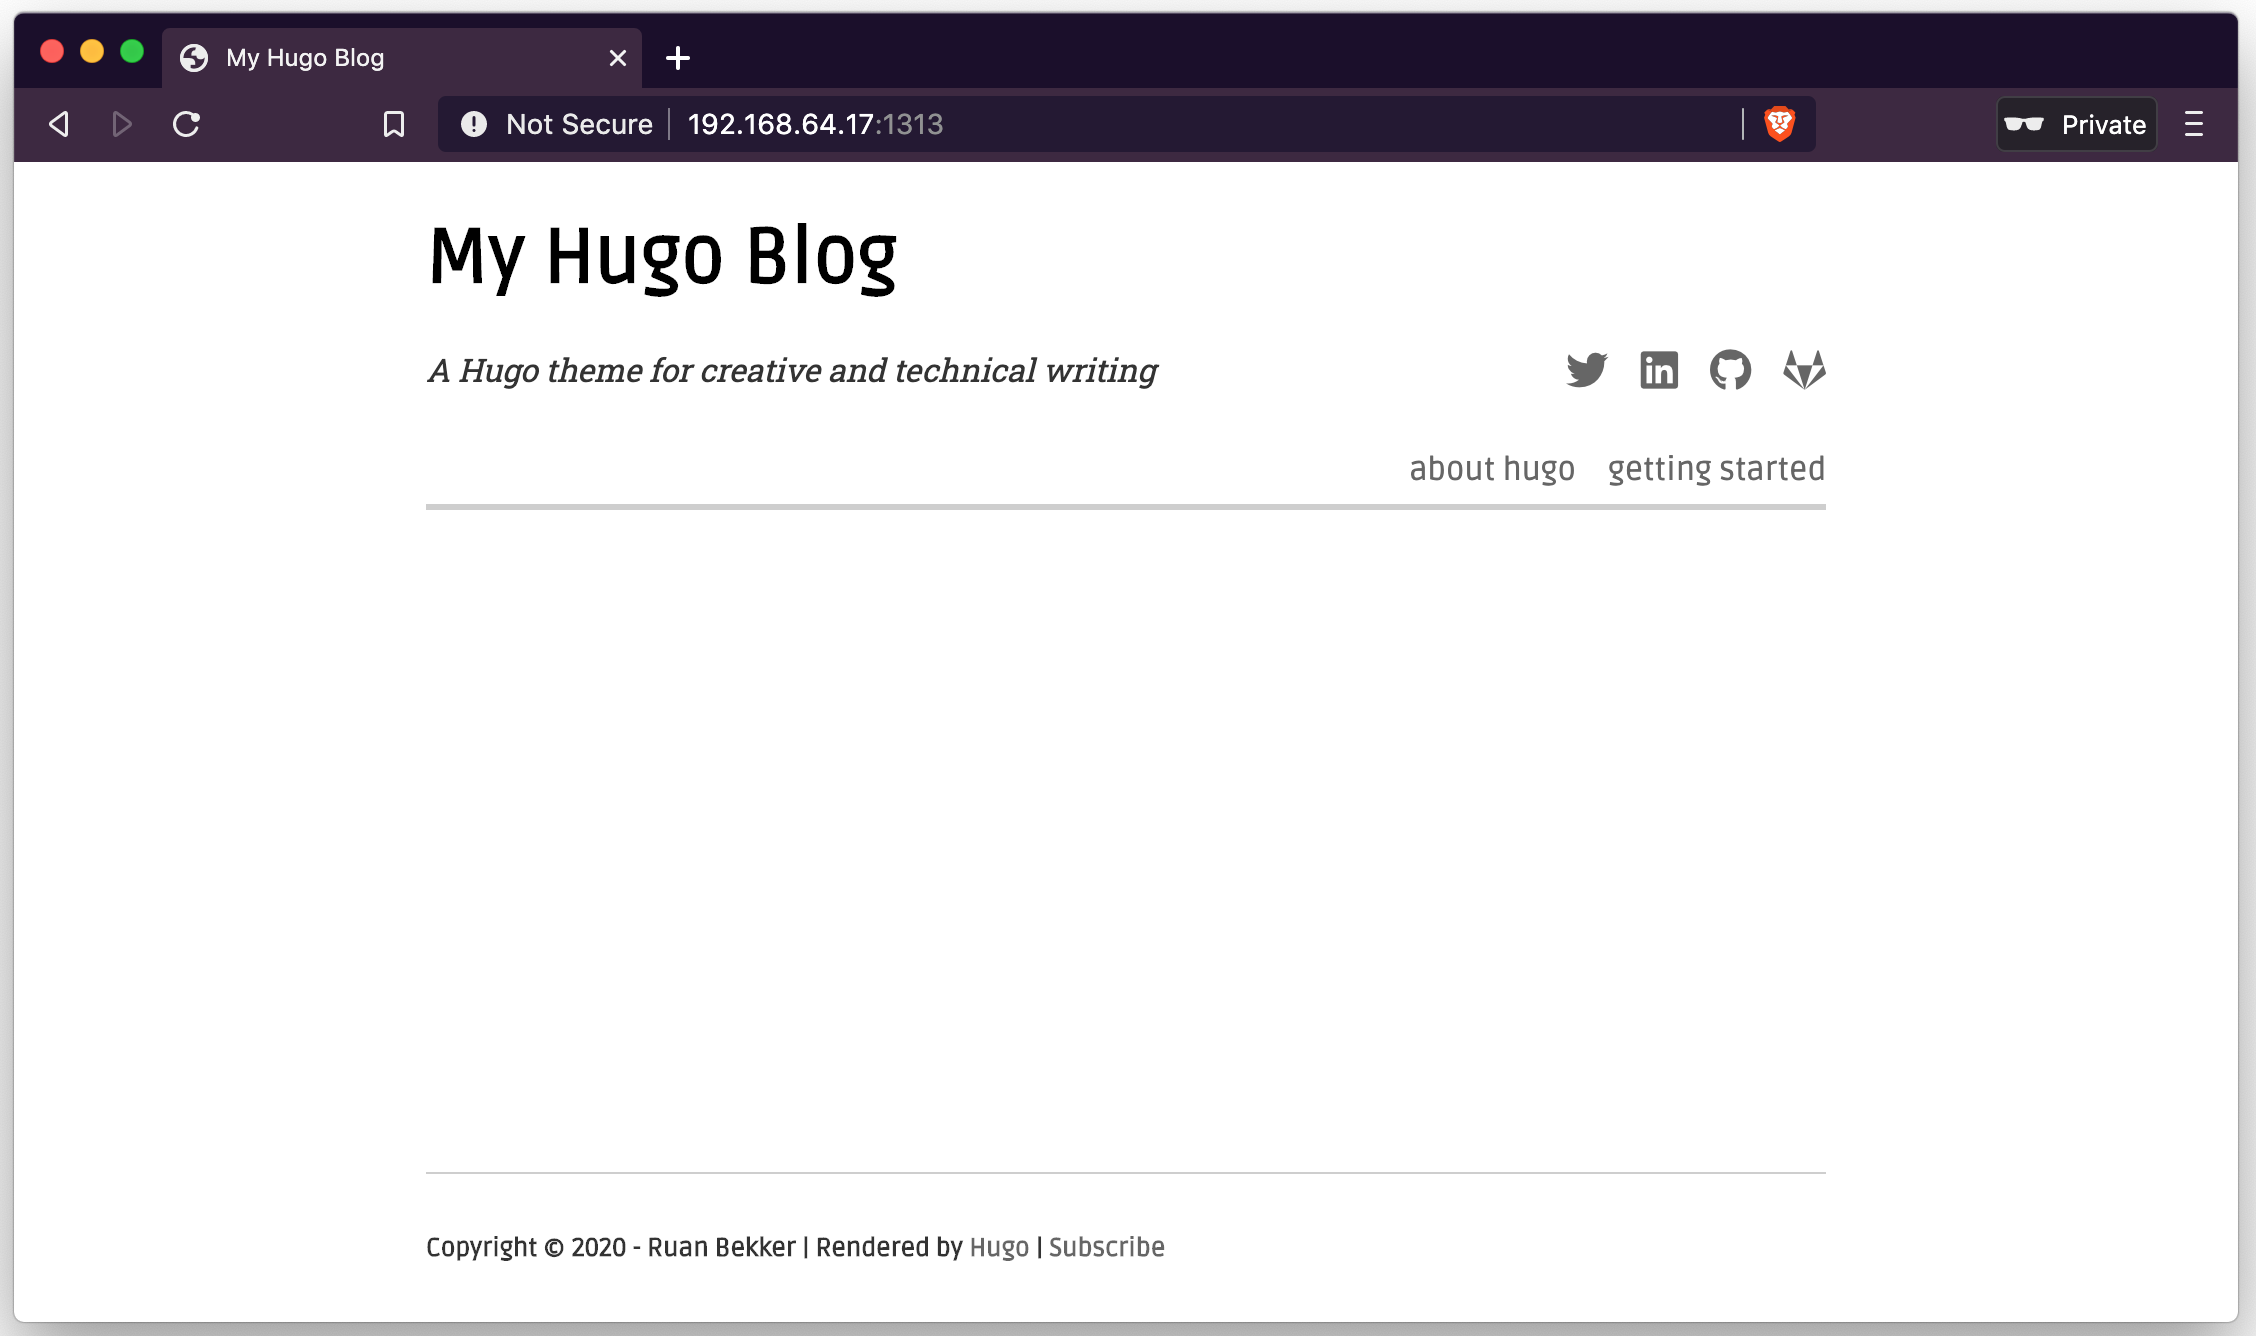
When starting the server up again and viewing the home page:

hugo-blog-with-home-page

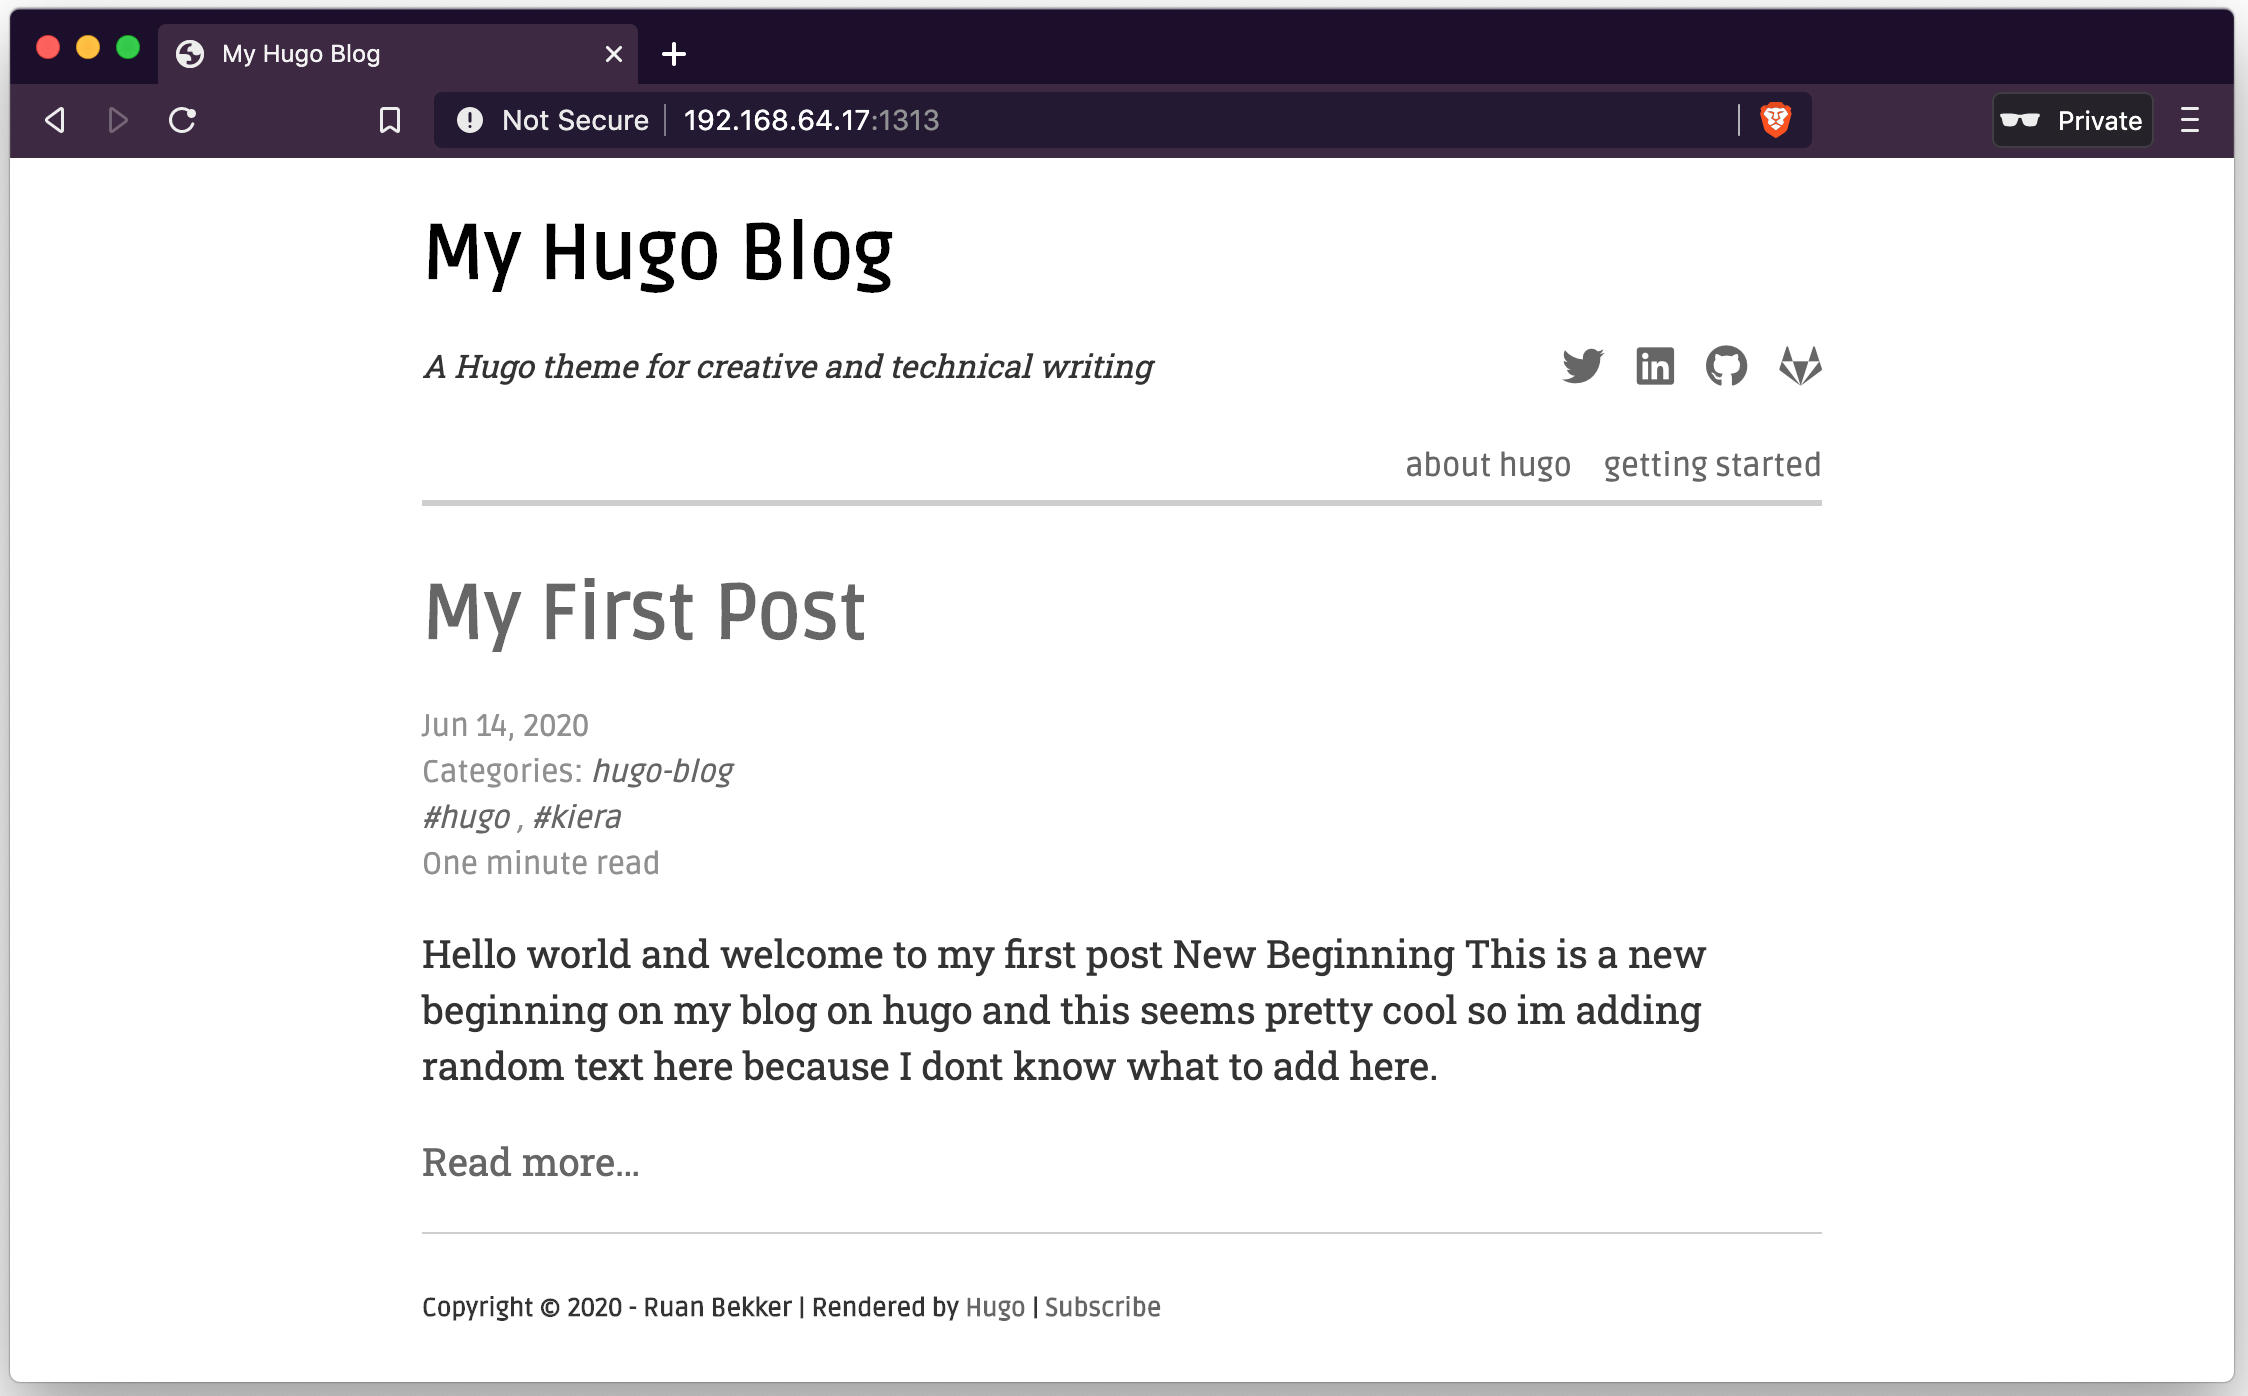
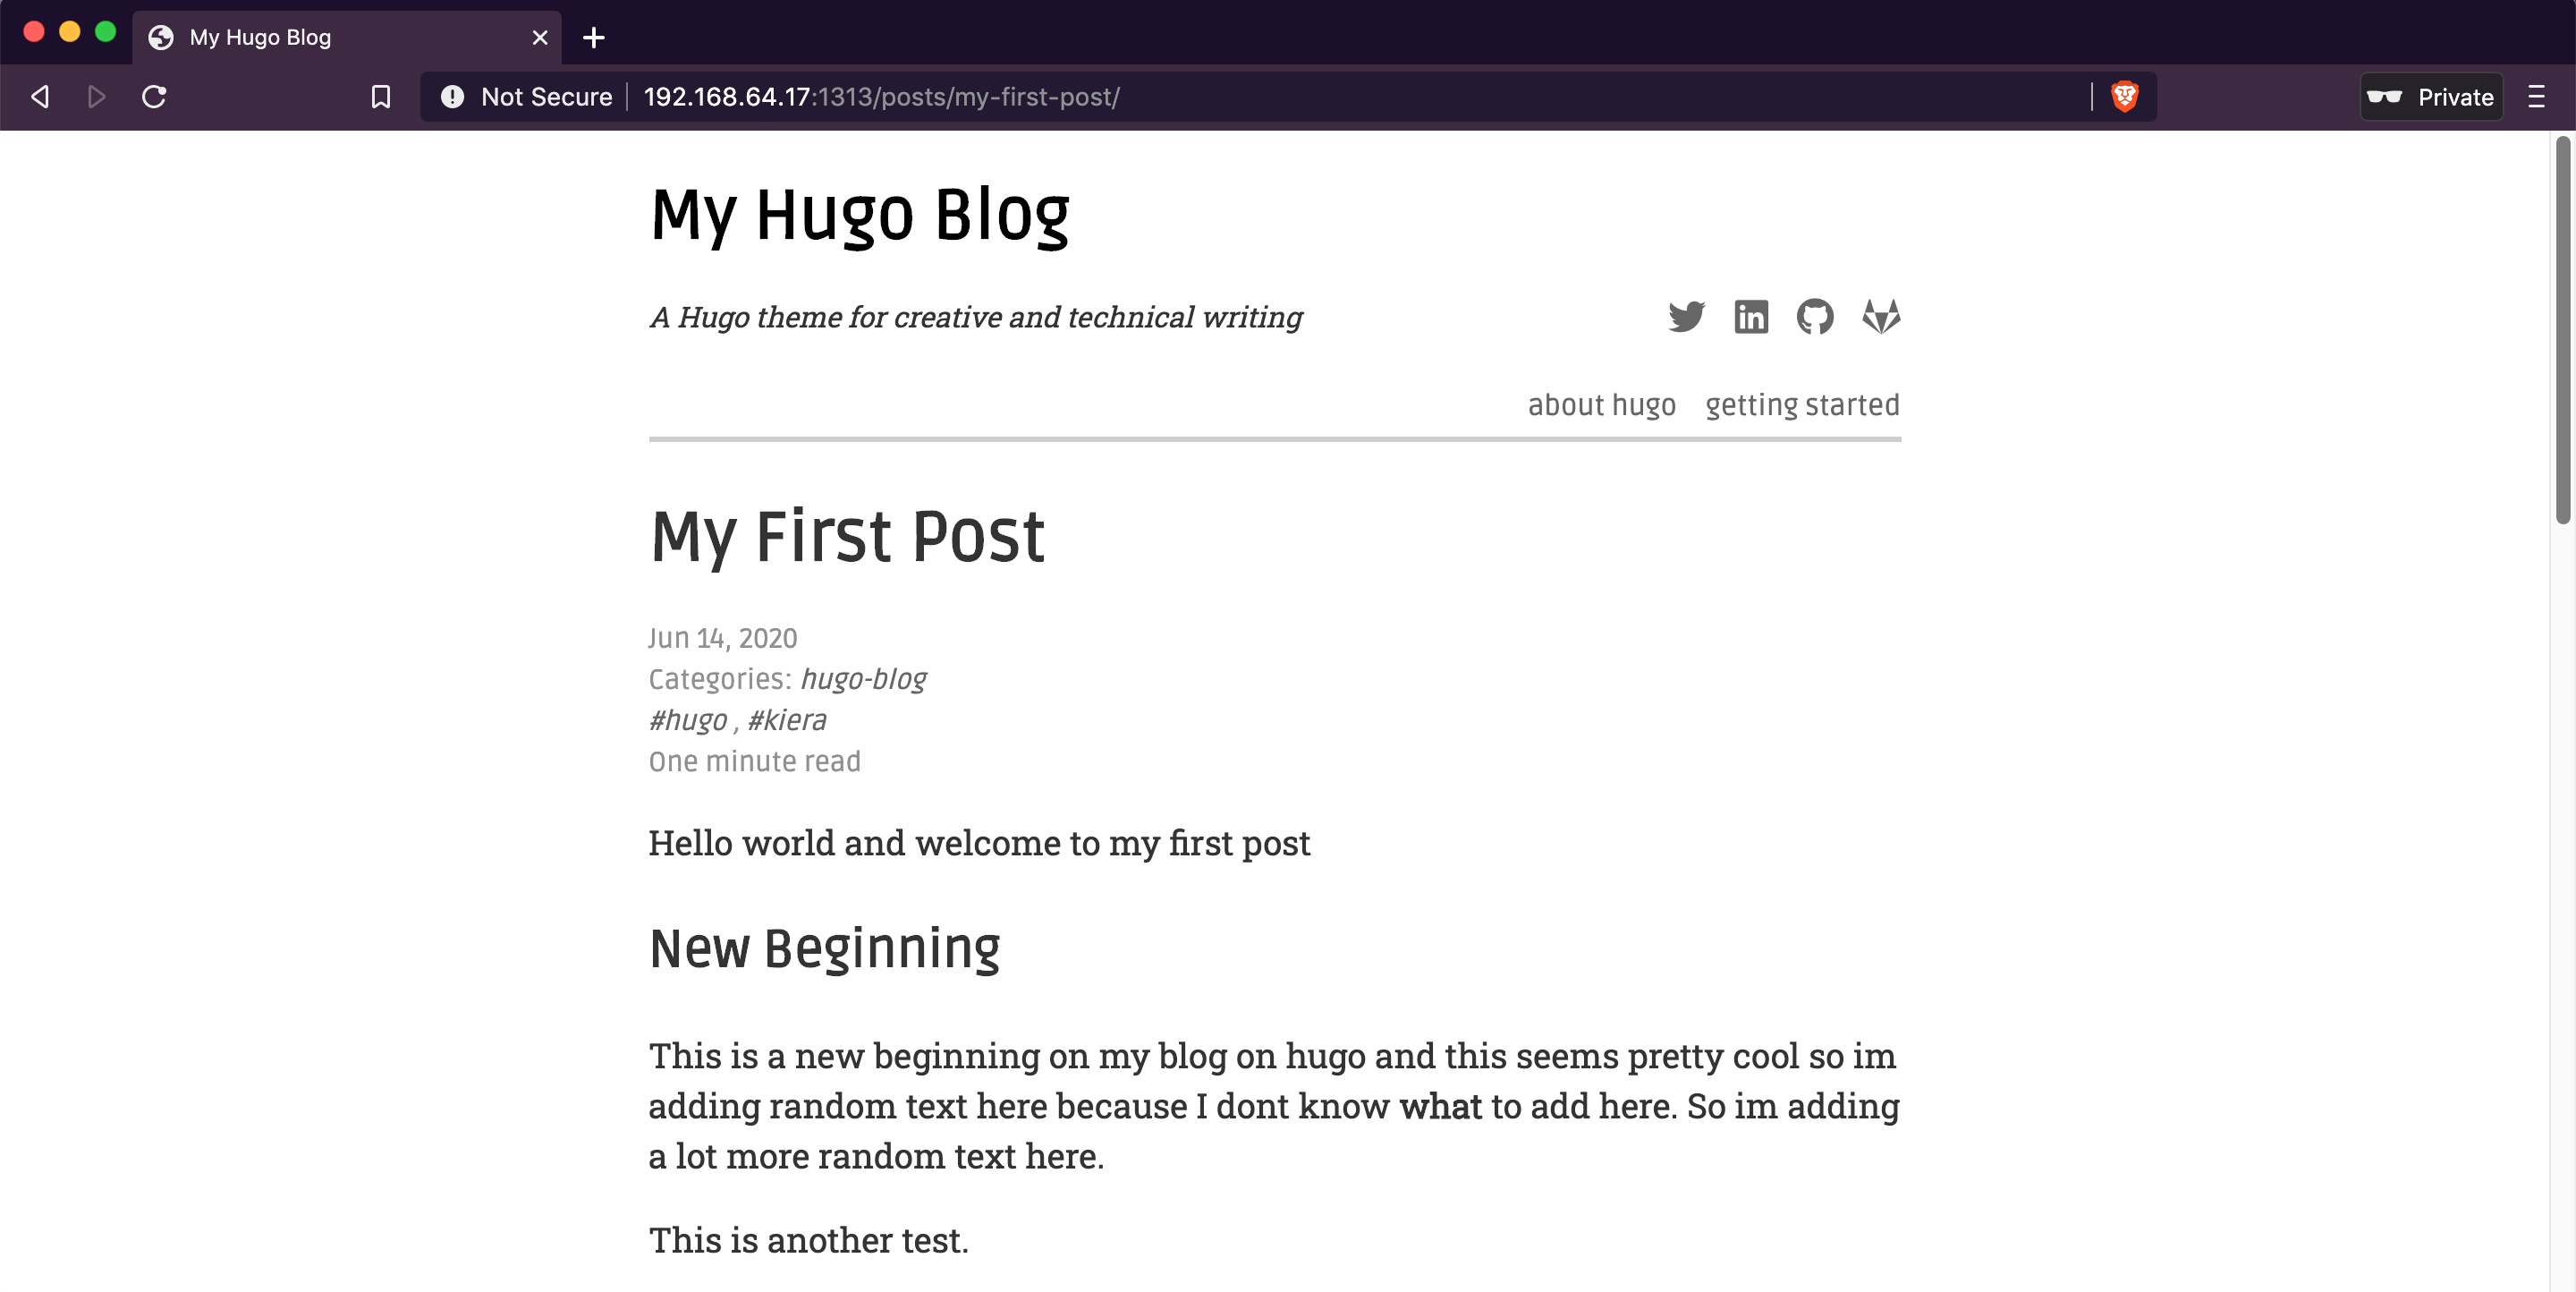
And selecting the post:
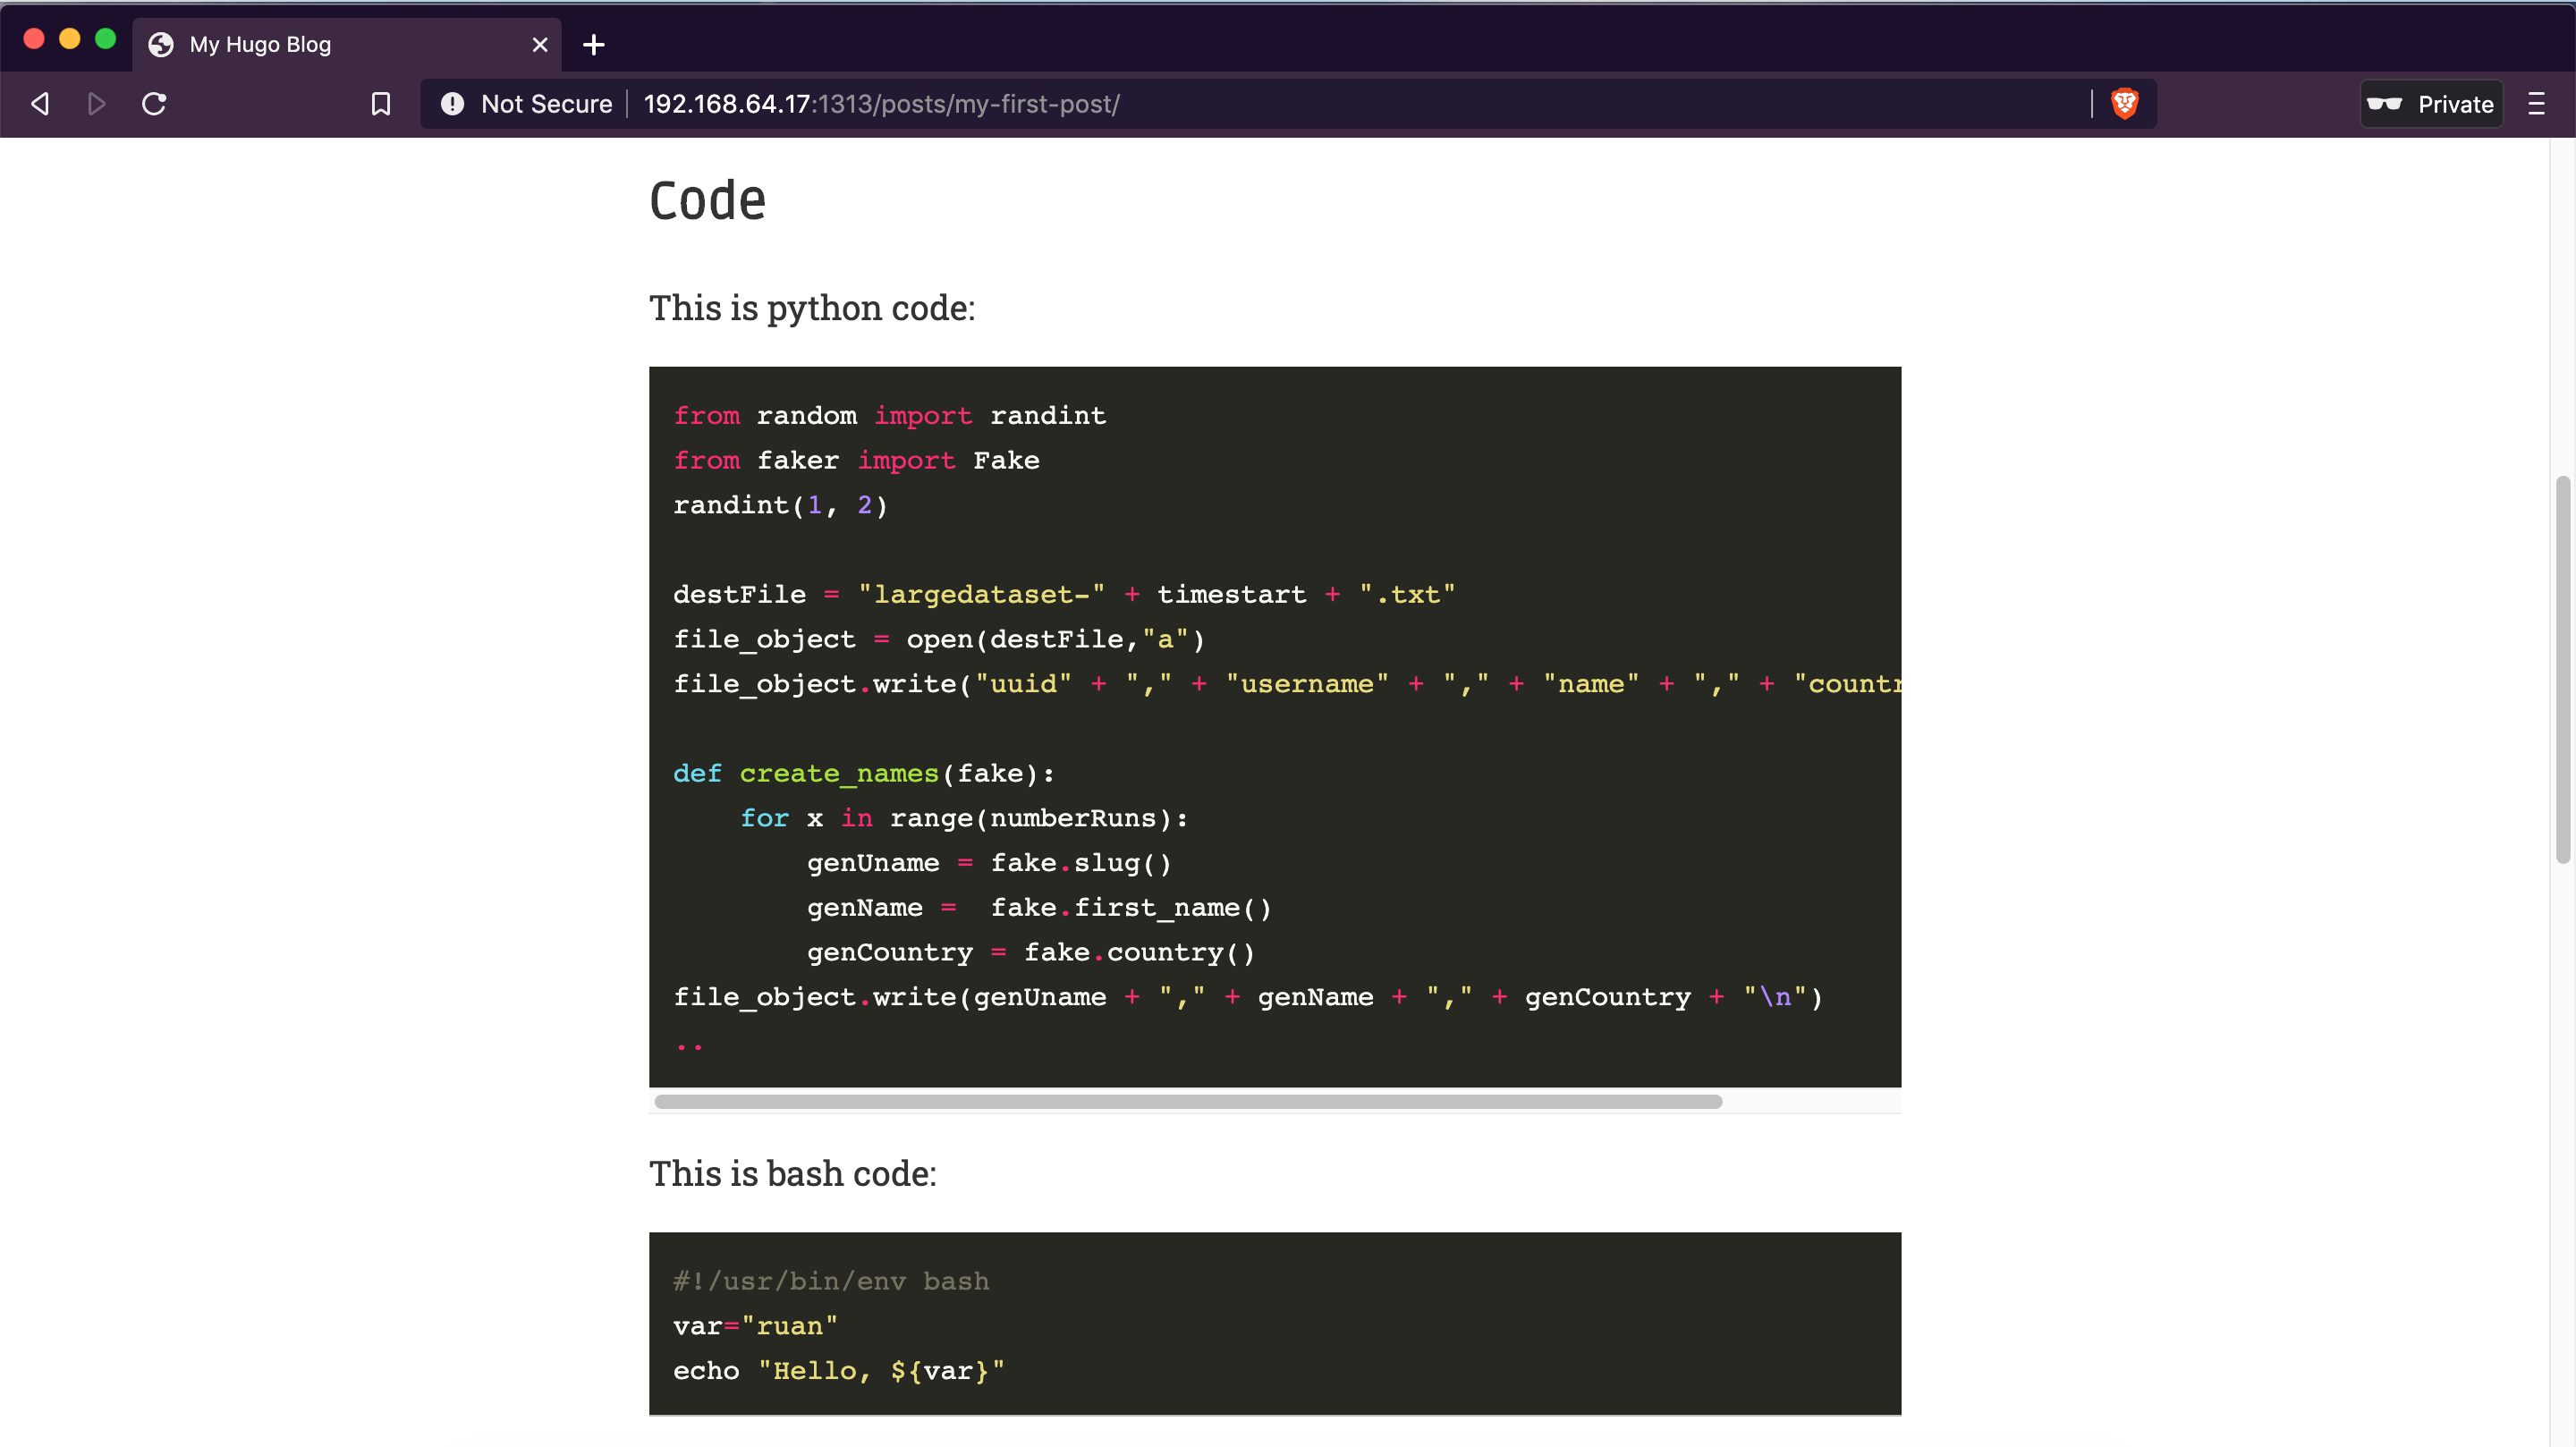
Code snippets:

code

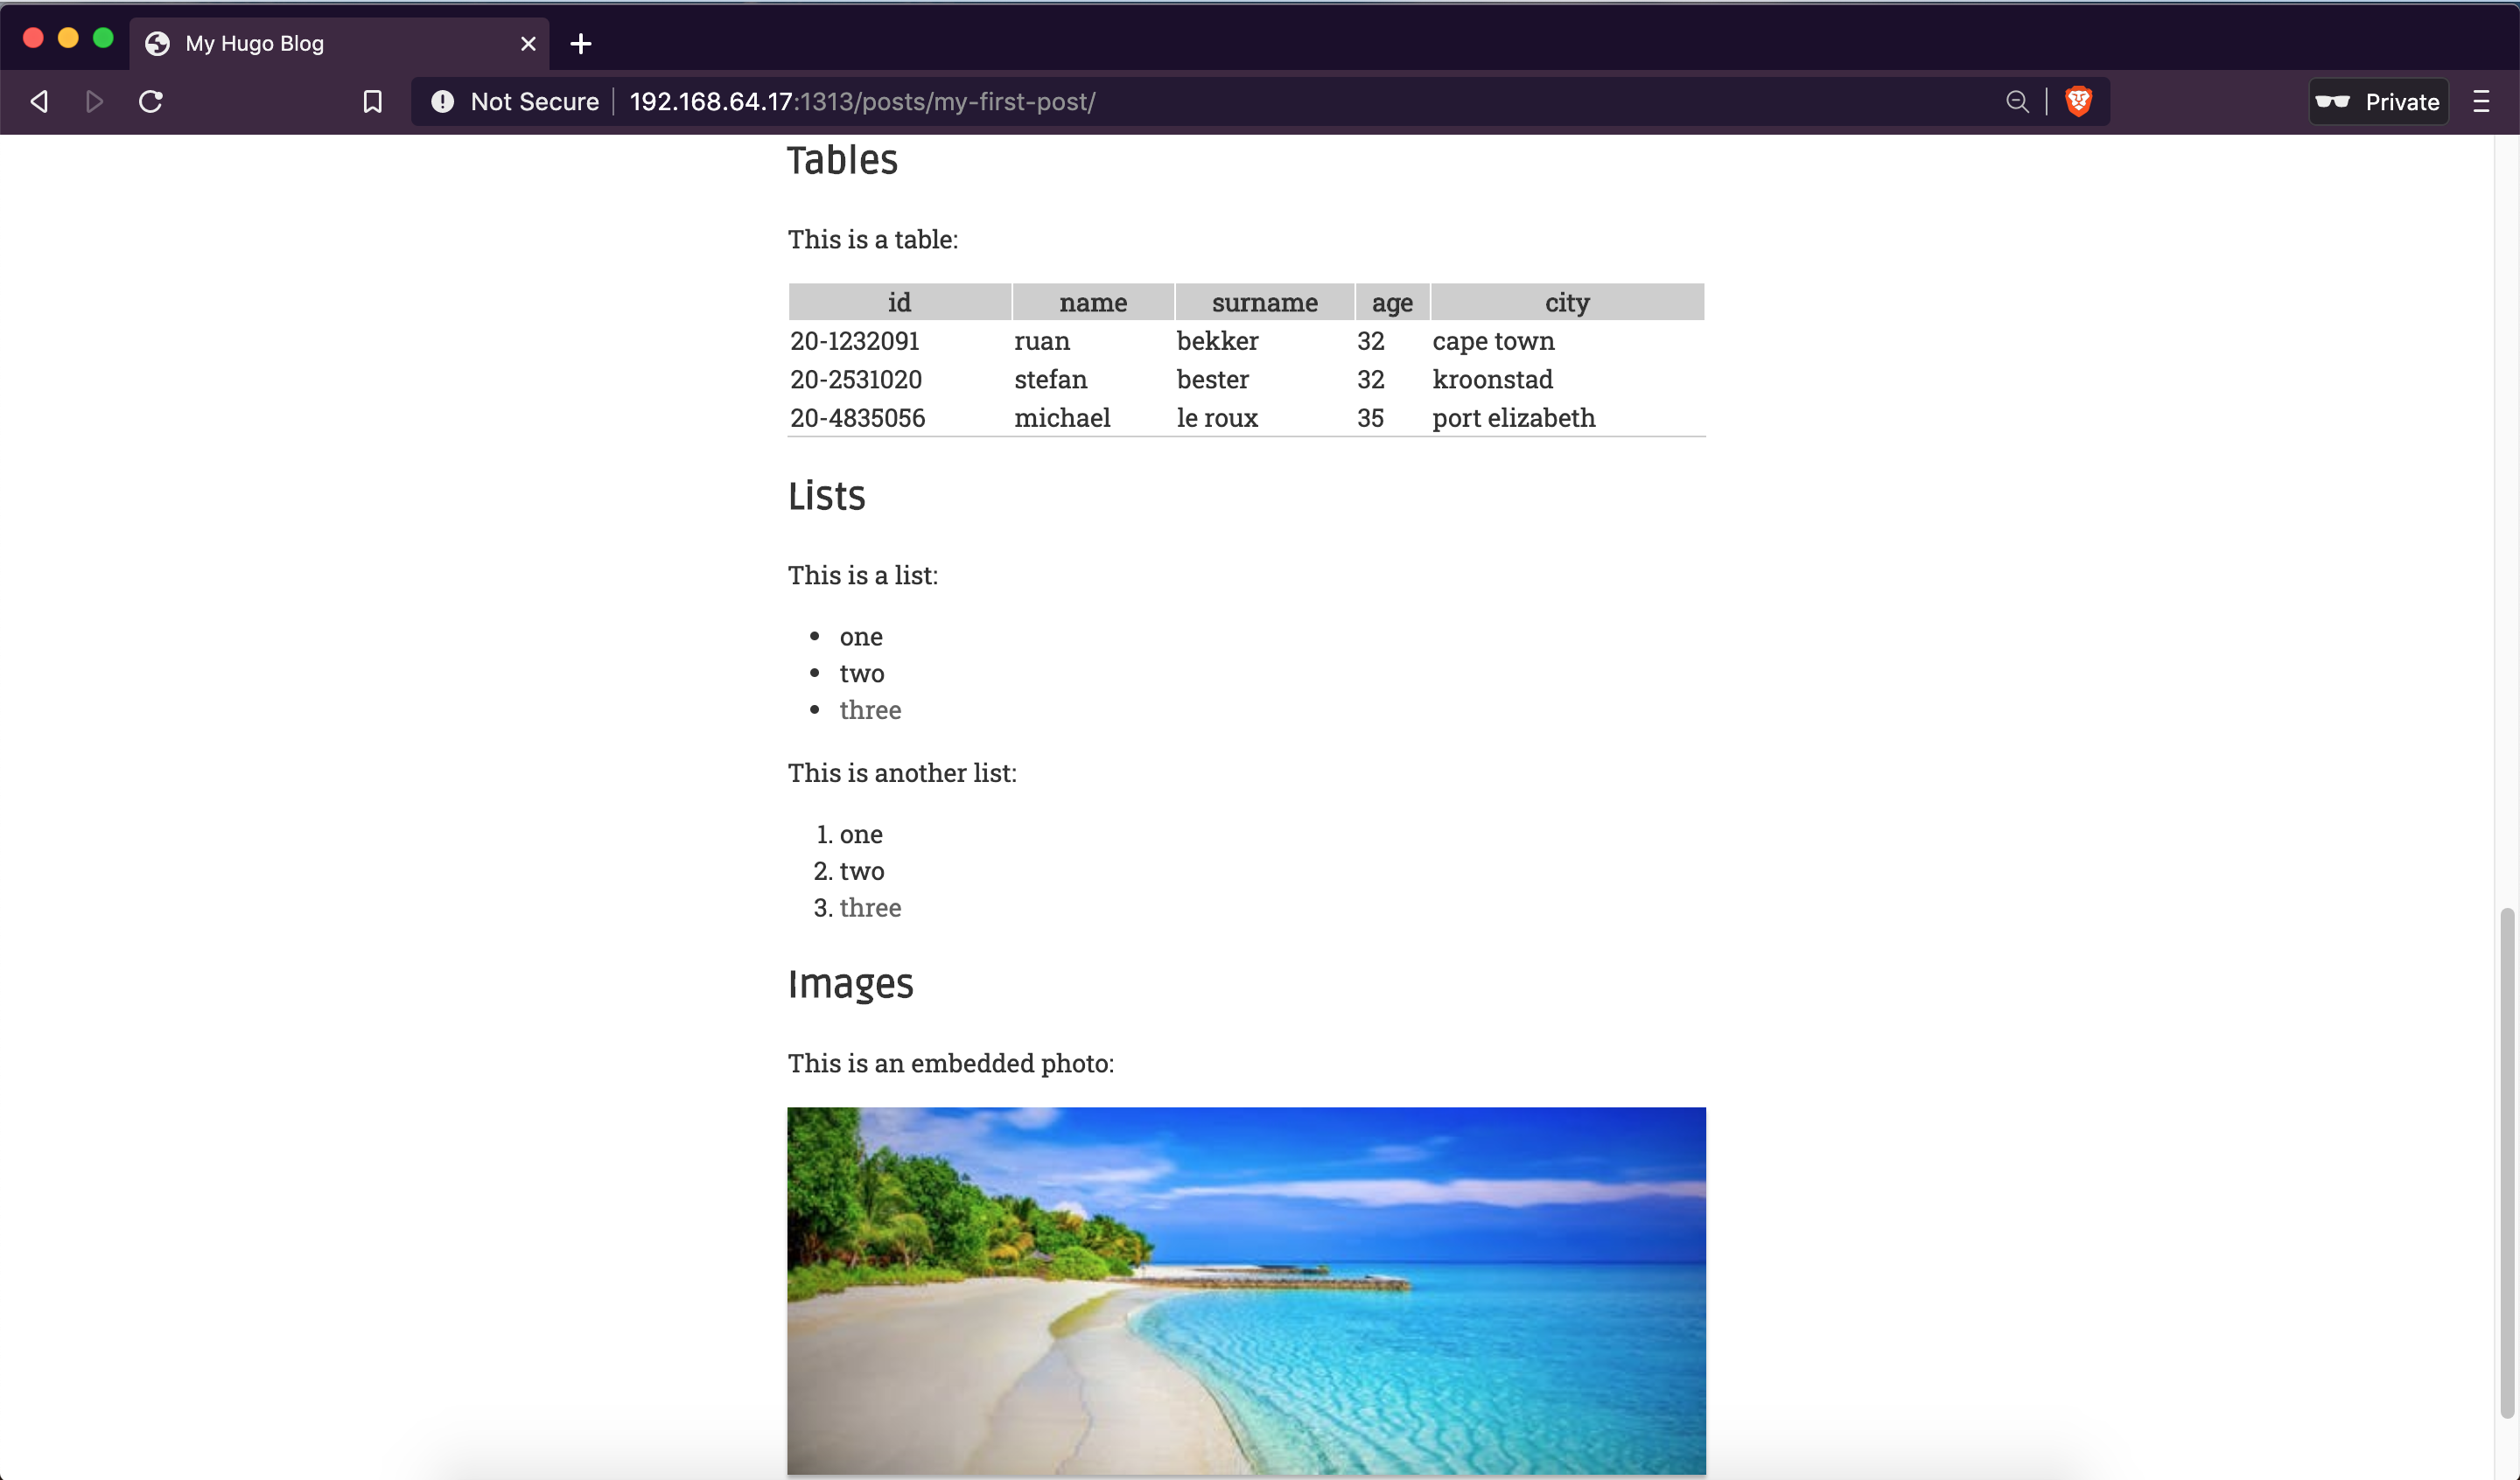
Tables, lists and images:

hugo-blog

Creating Pages

For the pages section (about, getting-started), we first create the directory:

1
$ mkdir content/getting-started

Then create the page under the directory:

1
2
$ hugo new content/getting-started/index.md
content/getting-started/index.md created

The content:

1
2
3
4
5
6
7
8
$ cat content/getting-started/index.md
---
title: "Getting Started"
date: 2020-06-14T16:11:07+02:00
draft: false
---

This is a getting started page

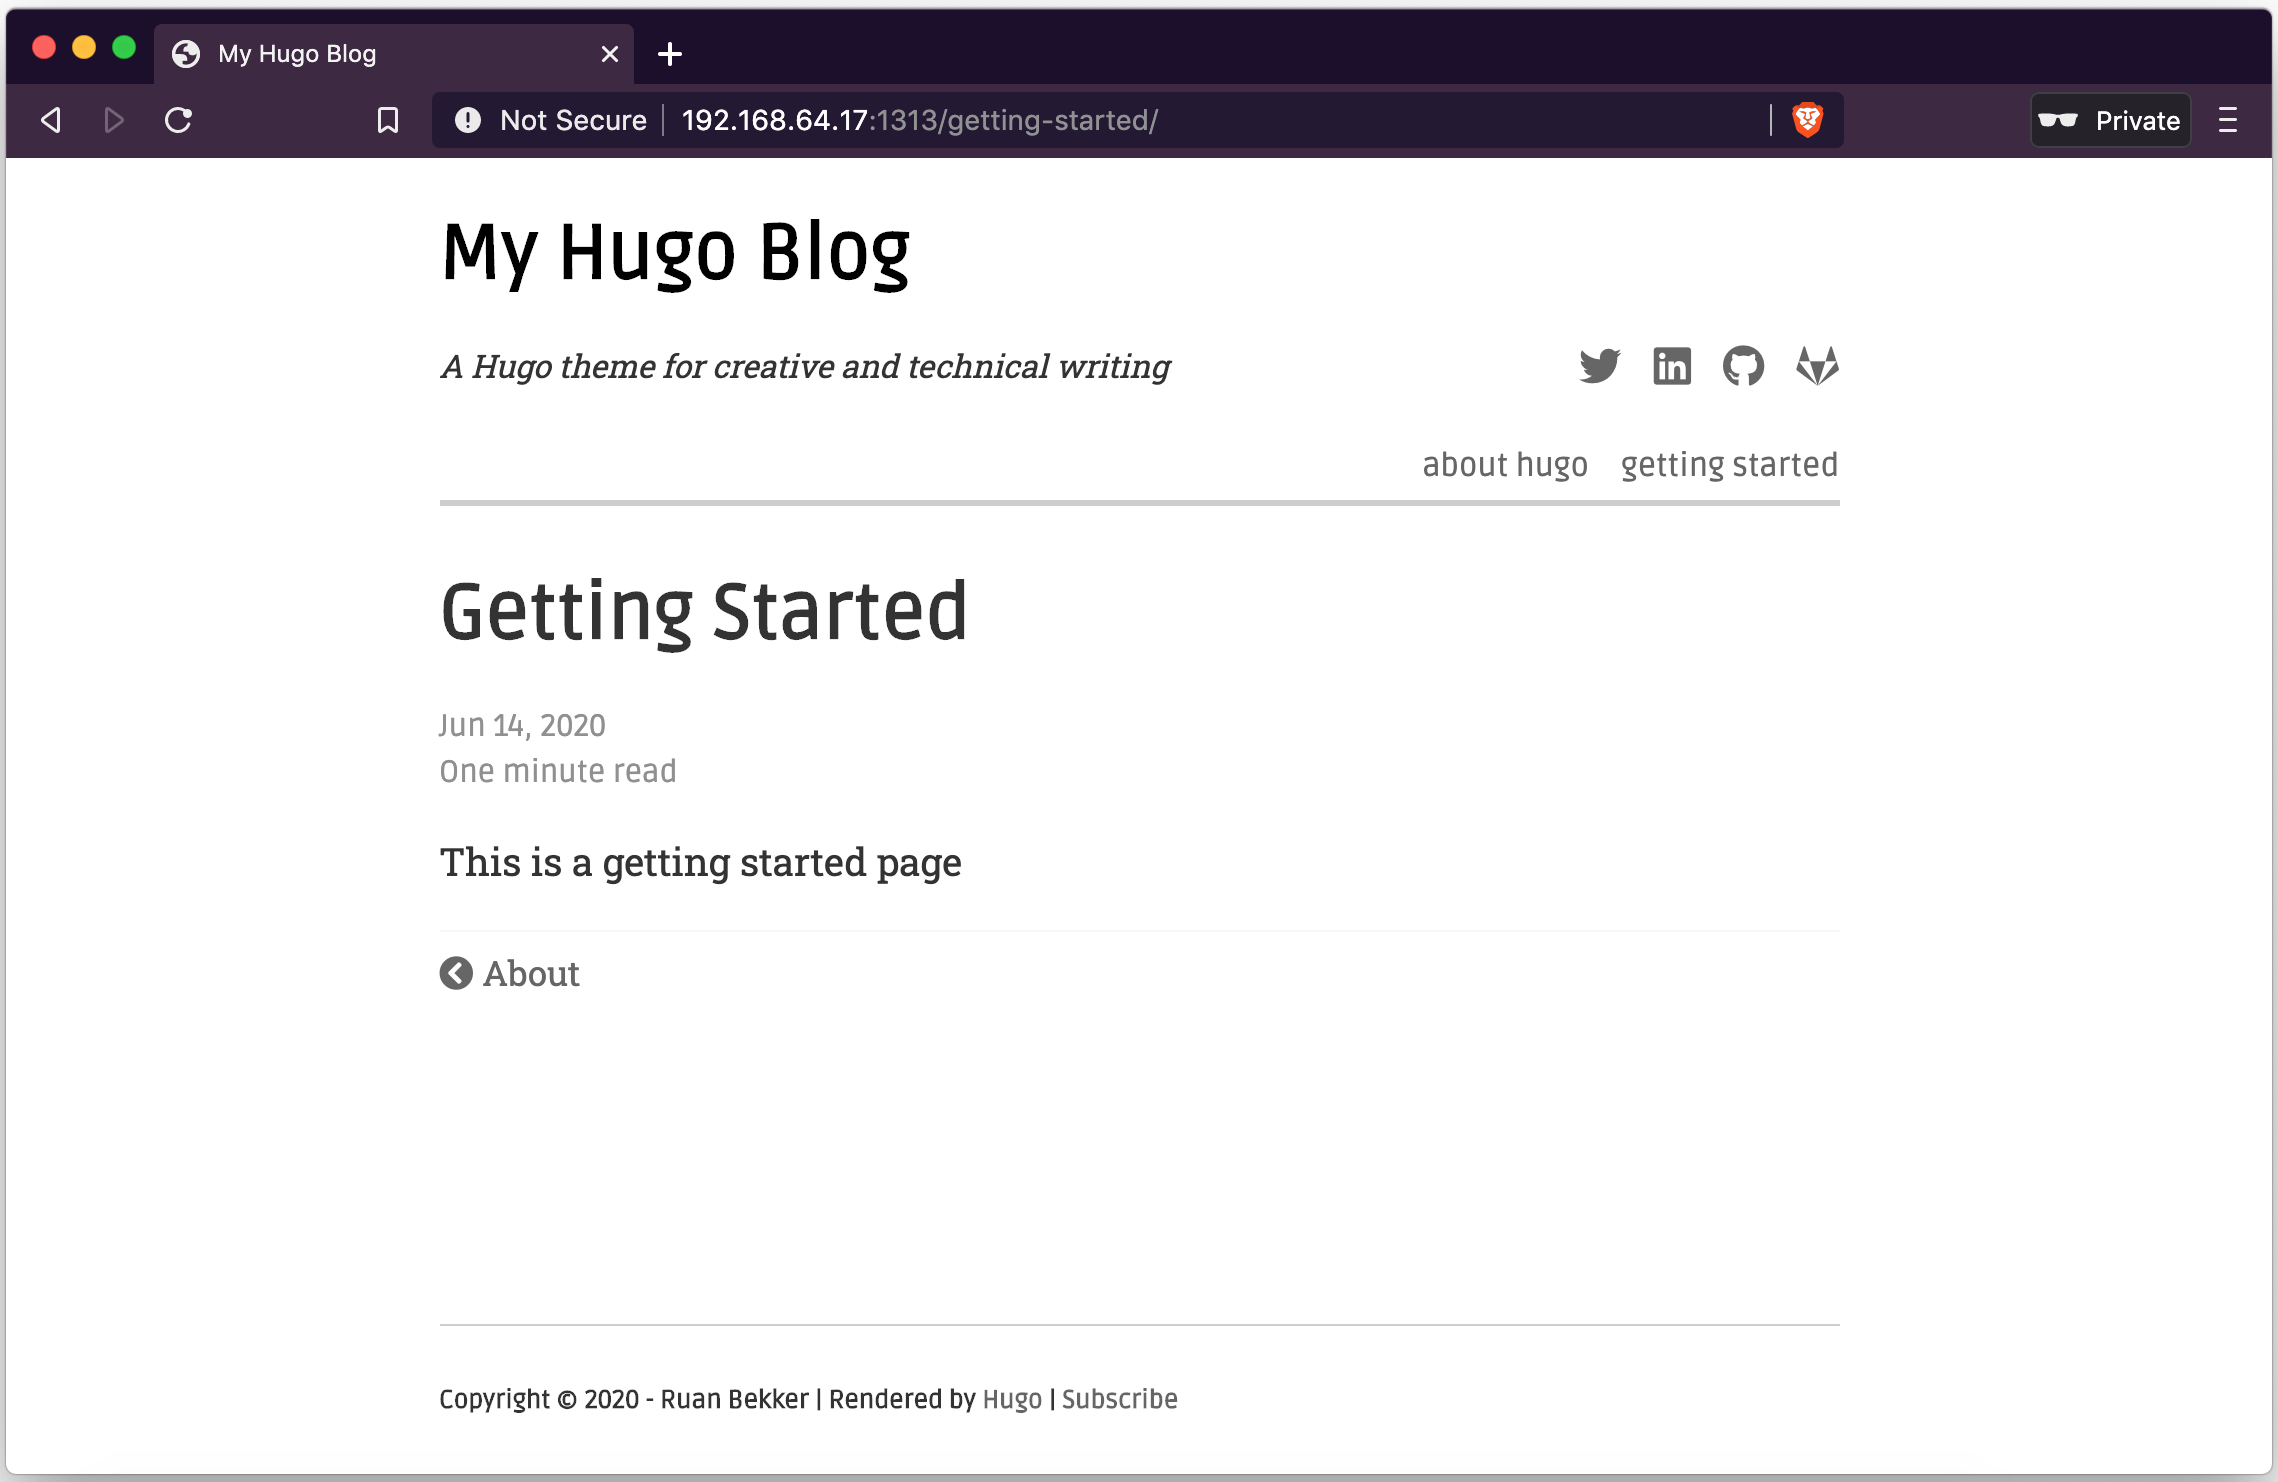
When we start up our server again and select the “getting-started” from the navbar on our home page:

getting-started-page

Production Mode

You can set the flags in your main config as well, but running the server in production mode:

1
2
3
4
5
$ hugo server \
  --baseURL "http://192.168.64.17/" \
  --themesDir=themes --theme=kiera \
  --bind=0.0.0.0 --port=1313 --appendPort=true \
  --buildDrafts --watch --environment production

Thanks

Thanks for reading, feel free to reach out to me on @ruanbekker

Using ProxyJump With SSH for VMs With No Public IPs

ssh-proxy-jump

I have a dedicated server with LXD installed where I have a bunch of system containers running to host a lot of my playground services, and to access the operating system of those lxc containers, I need to SSH to the LXD host, then exec or ssh into that LXC container.

This became tedious and wanted a way to directly ssh to them, as they don’t have public ip addresses, it’s not possible but found its possible to access them using proxyjump.

1
[you] -> [hypervisor] -> [vm on hypervisor]

First step is to create our ssh key:

1
$ ssh-keygen -t rsa

Add the created public key (~/.ssh/id_rsa.pub) on the hypervisor and the target vm’s ~/.ssh/authorized_key files.

Then create the SSH Config on your local workstation (~/.ssh/config):

1
2
3
4
5
6
7
8
9
10
11
12
13
14
Host *
  StrictHostKeyChecking no
  UserKnownHostsFile=/dev/null

Host hypervisor
  Hostname hv.domain.com
  User myuser
  IdentityFile ~/.ssh/id_rsa

Host ctr1
  Hostname 10.37.117.132
  User root
  IdentityFile ~/.ssh/id_rsa
  ProxyJump hypervisor

Now accessing our lxc container ctr1, is possible by doing:

1
2
3
4
$ ssh ctr1
Warning: Permanently added 'x,x' (ECDSA) to the list of known hosts.
Warning: Permanently added '10.37.117.132' (ECDSA) to the list of known hosts.
root@ctr1~ $

Thank you for reading