Ruan Bekker's Blog

From a Curious mind to Posts on Github

HTTPS for Local Development With MiniCA

In this tutorial we will use minica to enable us to run our web applications over HTTPS for local development.

To read more about about minica check out their website.

Generate Certificates

You can use their binary from their github page or use my docker image to generate the certificates to a ./certs directory:

1
$ docker run --user "$(id -u):$(id -g)" -it -v $PWD/certs:/output ruanbekker/minica --domains 192.168.0.20.nip.io

In the case from above, we are generating certificates for the FQDN 192.168.0.20.nip.io. You will find the generated certificates under ./certs/.

Application Stack

We will use docker to create a nginx webserver to serve our content via https using the generated vertificates.

Our docker-compose.yml:

1
2
3
4
5
6
7
8
9
10
11
12
13
version: '3.7'
services:
  nginx:
    image: nginx
    container_name: nginx
    ports:
      - 80:80
      - 443:443
    volumes:
      - ~/personal/docker-minica-nginx/nginx.conf:/etc/nginx/nginx.conf
      - ~/personal/docker-minica-nginx/ssl.conf:/etc/nginx/conf.d/ssl.conf
      - ~/personal/docker-minica-nginx/certs/192.168.0.6.nip.io:/etc/nginx/certs
      - ~/personal/docker-minica-nginx/html/index.html:/usr/share/nginx/html/index.html

Our nginx.conf:

1
2
3
4
5
6
7
8
9
10
11
12
13
14
15
16
17
18
19
20
21
22
23
user  nginx;
worker_processes  1;
error_log  /var/log/nginx/error.log warn;
pid        /var/run/nginx.pid;

events {
    worker_connections  1024;
}

http {
    include       /etc/nginx/mime.types;
    default_type  application/octet-stream;

    log_format  main  '$remote_addr - $remote_user [$time_local] "$request" '
                      '$status $body_bytes_sent "$http_referer" '
                      '"$http_user_agent" "$http_x_forwarded_for"';

    access_log  /var/log/nginx/access.log  main;

    sendfile        on;
    keepalive_timeout  65;
    include /etc/nginx/conf.d/ssl.conf;
}

Our ssl.conf:

1
2
3
4
5
6
7
8
9
10
11
12
13
14
15
16
17
18
server {
    listen 80;
    server_name 192.168.0.6.nip.io;
    return 301 https://$host$request_uri;
}

server {
    listen 443 ssl;
    server_name 192.168.0.6.nip.io;

    ssl_certificate /etc/nginx/certs/cert.pem;
    ssl_certificate_key /etc/nginx/certs/key.pem;

    location / {
        root   /usr/share/nginx/html;
        index  index.html;
    }
}

Our html/index.html:

1
2
3
4
5
6
7
8
9
10
11
12
13
14
15
16
17
18
19
20
21
22
<!DOCTYPE html>
<html lang="en-us">
<head>
    <meta charset="utf-8">
    <link href="https://maxcdn.bootstrapcdn.com/bootstrap/3.3.7/css/bootstrap.min.css" rel="stylesheet" crossorigin="anonymous">
    <script src="https://code.jquery.com/jquery-3.1.1.min.js" crossorigin="anonymous"></script>
    <title>Sample Page</title>
</head>
<body>
    <div class="container-fluid">
        <div class="row">
            <div class="bitProcessor"></div>
            <div class="col-md-12" style="background-color: white; position: absolute; top: 40%;width: 80%;left: 10%;">
                <center>
                    <h1>Hello, World!</h1>
                  <p>This is sample text.</p>
                </center>
            </div>
        </div>
    </div>
</body>
</html>

Import Certificates

We have a certificate ./certs/minica.pem which we need to import and trust on our local workstation, I am using a Mac so it will be Keychain Access.

image

Once you open Keychain Access, select “file”, “import items” and browse and import ./certs/minica.pem, once you are done search for minica:

image

Select the item, file -> get info, expand trust, change “when using this certificate” to Always trust and close.

You will now see the root ca is trusted:

image

Boot the Application Stack

As we have docker-compose.yml in our current working directory, we can use docker-compose to boot our application:

1
2
3
4
$ docker-compose up
Creating network "docker-minica-nginx_default" with the default driver
Creating nginx ... done
Attaching to nginx

Now when we browse to https://192.168.0.6.nip.io we will see:

image

And when we inspect the certificate, we can see its valid:

image

Thank You

Thank you for reading.

Harden Your SSH Security on Linux Servers

In this post we wil be focusing on increasing / hardening our security by adjusting our ssh configuration and applying some iptables firewall rules.

This will be the list of things that we will do:

1
2
3
4
5
6
  - Change the SSH Port
  - Don't allow root to SSH
  - Disable password based authentication
  - Enable key based authentication and only for a singular user
  - Allow our user to sudo
  - Use iptables to block sources trying to DDoS your server

Packages

First let’s install the packages that we need, I’m using Debian so I will be using the apt package manager:

1
2
$ apt update && apt upgrade -y
$ apt install sudo -y

Dedicated User

Let’s create our user james:

1
$ useradd -m -s /bin/bash james

Allow our user to sudo without a password, by running visudo then append the following line:

1
james ALL=(ALL:ALL) NOPASSWD: ALL

SSH Authorized Keys

If you don’t already have a private SSH key, generate one on your client side:

1
$ ssh-keygen -f ~/.ssh/james -t rsa -C "james" -q -N ""

Then copy the public key:

1
$ cat ~/.ssh/james.pub | pbcopy

On your server create the SSH directories:

1
$ mkdir /home/james/.ssh

Now paste your public key into /home/james/.ssh/authorized_keys

Then change the ownership:

1
2
3
$ chmod 700 /home/james/.ssh
$ chmod 644 /home/james/.ssh/authorized_keys
$ chown -R james:james /home/james

SSH Config

Backup your SSH config:

1
$ cp /etc/ssh/sshd_config /etc/ssh_sshd_config.bak

We will be using the SSH port 2914, replace your SSH config with the following and make your adjustments where you need to:

1
2
3
4
5
6
7
8
9
10
11
12
13
14
15
16
17
18
19
20
21
22
23
24
# /etc/ssh/sshd_config
Port 2914
HostKey /etc/ssh/ssh_host_rsa_key
HostKey /etc/ssh/ssh_host_ecdsa_key
HostKey /etc/ssh/ssh_host_ed25519_key
LoginGraceTime 1m
PermitRootLogin no
MaxAuthTries 3
MaxSessions 5
AuthenticationMethods publickey
PubkeyAuthentication yes
AuthorizedKeysFile      /home/james/.ssh/authorized_keys
PasswordAuthentication no
PermitEmptyPasswords no
ChallengeResponseAuthentication no
UsePAM yes
AllowUsers james
DenyUsers root
X11Forwarding yes
PrintMotd no
UseDNS no
PidFile /var/run/sshd.pid
AcceptEnv LANG LC_*
Subsystem       sftp    /usr/lib/openssh/sftp-server

Then save the file and restart SSH:

1
$ systemctl restart sshd

While you are still connected to the shell session, open up a new terminal and try to connect with your new user and private SSH key to ensure that you can connect to your server.

Iptables

We want to drop incoming connections which make more than 10 connection attempts to SSH within 60 seconds.

The tokens get refilled into buckets at 3 per minute and maximum of 3 tokens that can be filled into the bucket.

Let’s create our script:

1
2
$ mkdir -p /opt/scripts
$ touch /opt/scripts/fw.sh

In our script we will place the following content:

1
2
3
4
5
6
7
8
9
10
11
12
#!/usr/bin/env bash
INTERFACE=eth0 # check ifconfig to determine the correct interface
SSH_PORT=2914
CONNECTION_ATTEMPTS=10
CONNECTION_TIME=60
#WHITELIST_IP=x.x.x.x/32 # replace ip and uncomment if you want to whitelist a ip
#iptables -I INPUT -s ${WHITELIST_IP} -p tcp --dport ${SSH_PORT} -i ${INTERFACE} -j ACCEPT # uncomment if you want to use whitelisting
iptables -A INPUT -p tcp --dport ${SSH_PORT} -i ${INTERFACE} -m state --state NEW -m recent  --set
iptables -A INPUT -p tcp --dport ${SSH_PORT} -i ${INTERFACE} -m state --state NEW -m recent  --update --seconds ${CONNECTION_TIME} --hitcount ${CONNECTION_ATTEMPTS} -j DROP
iptables -A INPUT  -i ${INTERFACE} -p tcp --dport ${SSH_PORT} -m state --state NEW -m limit --limit 3/min --limit-burst 3 -j ACCEPT
iptables -A INPUT  -i ${INTERFACE} -p tcp --dport ${SSH_PORT} -m state --state ESTABLISHED -j ACCEPT
iptables -A OUTPUT -o ${INTERFACE} -p tcp --sport ${SSH_PORT} -m state --state ESTABLISHED -j ACCEPT

Now we want to execute this script whenever the server boots, open up /etc/rc.local and append the following line, so that the file looks more or less like:

1
2
3
#!/bin/bash
/opt/scripts/fw.sh
exit 0

Ensure both files are executable:

1
2
$ chmod +x /opt/scripts/fw.sh
$ chmod +x /etc/rc.local

When you are sure everything is in place, reboot:

1
$ reboot

Encrypt and Decrypt Files With Ccrypt

This is a quick post to demonstrate how to encrypt and decrypt files with ccrypt

About

Ccrypt’s description from its project page:

Encryption and decryption depends on a keyword (or key phrase) supplied by the user. By default, the user is prompted to enter a keyword from the terminal. Keywords can consist of any number of characters, and all characters are significant (although ccrypt internally hashes the key to 256 bits). Longer keywords provide better security than short ones, since they are less likely to be discovered by exhaustive search.

Ref: http://ccrypt.sourceforge.net/

Install

For debian based systems, to install ccrypt:

1
$ sudo apt-get install ccrypt

Usage

To encrypt files, write a file to disk:

1
$ echo "ok" > file.txt

Then encrypt the file by providing a password:

1
2
3
$ ccencrypt file.txt
Enter encryption key:
Enter encryption key: (repeat)

It encrypts and only the encrypted file can be found:

1
2
$ ls
file.txt.cpt

Decrypt the file, by providing your password that you encrypted it with:

1
2
$ ccdecrypt file.txt.cpt
Enter decryption key:

View the decrypted file:

1
2
$ cat file.txt
ok

Deploy Loki on Multipass

In this post I will demonstrate how to deploy Grafana Labs’s Loki on Multipass using cloud-init so that you can run your own dev environment and run a couple of queries to get you started.

About

If you haven’t heard of Multipass, it allows you to run Ubuntu VMs on your Mac or Windows workstation.

If you haven’t heard of Loki, as described by Grafana Labs: “Loki is a horizontally-scalable, highly-available, multi-tenant log aggregation system inspired by Prometheus.”

Install Multipass

Head over to multipass.run to get the installer for your operating system, and if you are curious about Multipass, I wrote a beginners guide on Multipass which can be found here

Cloud Init for Loki

We will be making use of cloud-init to bootstrap Loki v2.0.0 to our multipass instance.

V2.0.0 is the current release of the time of writing, so depending on the time when you read this, have a look at the Loki Releases page for the latest version and adjust the cloud-init.yml according to the version if it differs from the one I’m mentioning.

(Optional) If you want to use SSH to your Multipass VM, you can use your existing SSH key or generate a new one, if you want to create a new key, you can follow this post

Copy your public key, in my case ~/.ssh/id_rsa.pub and paste it under the ssh authorized_keys section.

Our cloud-init.yml has a couple of sections, but to break it down it will do the following:

  • We provide it our public ssh key so that we can ssh with our private key
  • Updates the index repository
  • Installs the packages, unzip and wget
  • Creates the loki systemd unit file and places it under /etc/systemd/system/
  • When the vm boots it will create the user loki and creates the loki etc directory
  • Once that completes, we are downloading the loki, logcli and promtail binaries from github
1
2
3
4
5
6
7
8
9
10
11
12
13
14
15
16
17
18
19
20
21
22
23
24
25
26
27
28
29
30
31
32
33
34
35
36
37
38
39
40
41
42
43
44
45
46
#cloud-config
ssh_authorized_keys:
  - ssh-rsa AAAA...Ha9 your-comment

package_update: true

packages:
 - unzip
 - wget

write_files:
  - content: |-
      [Unit]
      Description=Loki
      User=loki
      Group=loki
      Wants=network-online.target
      After=network-online.target
      [Service]
      Type=simple
      Restart=on-failure
      ExecStart=/usr/local/bin/loki -config.file /etc/loki/loki-local-config.yaml
      [Install]
      WantedBy=multi-user.target

    owner: root:root
    path: /etc/systemd/system/loki.service
    permissions: '0644'

bootcmd:
  - useradd --no-create-home --shell /bin/false loki
  - mkdir /etc/loki
  - chown -R loki:loki /etc/loki

runcmd:
 - for app in loki logcli promtail; do wget "https://github.com/grafana/loki/releases/download/v2.0.0/${app}-linux-amd64.zip"; done
 - for app in loki logcli promtail; do unzip "${app}-linux-amd64.zip"; done
 - for app in loki logcli promtail; do mv "${app}-linux-amd64" /usr/local/bin/${app}; done
 - for app in loki logcli promtail; do rm -f "${app}-linux-amd64.zip"; done
 - wget https://raw.githubusercontent.com/grafana/loki/v2.0.0/cmd/loki/loki-local-config.yaml
 - mv ./loki-local-config.yaml /etc/loki/loki-local-config.yaml
 - chown loki:loki /etc/loki/loki-local-config.yaml
 - systemctl daemon-reload
 - systemctl start loki
 - sleep 5
 - echo "this is a test" | promtail --stdin --client.url http://localhost:3100/loki/api/v1/push --client.external-labels=app=cli -server.disable

You will notice that the VM will have loki, logcli and promtail available on it, so you will have an environment to use all of them together.

As you can see once we start loki, we are piping this is a test to Loki using Promtail, so that we can verify that the data is visible in Loki. That step is not required, but just added it to this demo.

Deploy Loki on Multipass

We will provision a Multipass VM using the Ubuntu Focal distribution and spec our VM with 1 CPU, 512MB of Memory and 1GB of disk and then bootstrap our installation of Loki using cloud-init:

1
2
3
4
5
6
7
8
9
10
$ multipass launch focal \
  --name loki \
  --cpus 1 \
  --mem 512m \
  --disk 1G \
  --cloud-init cloud-init.yml

Creating: loki
Waiting for initialization to complete 
Launched: loki

We can validate if our Multipass VM is running:

1
2
3
$ multipass list
Name                    State             IPv4             Image
loki                    Running           192.168.64.19    Ubuntu 20.04 LTS

Test Loki inside the VM

First we will exec into the VM (or SSH), then we will test out Loki inside the VM since we already have logcli available:

1
2
3
4
5
$ multipass exec loki -- bash
To run a command as administrator (user "root"), use "sudo <command>".
See "man sudo_root" for details.

ubuntu@loki:~$

Remembered in our cloud-init, we instructed this command to run:

1
echo "this is a test" | promtail --stdin --client.url http://localhost:3100/loki/api/v1/push --client.external-labels=app=cli -server.disable

So if we use logcli, we can inspect our visible labels:

1
2
3
4
5
$ logcli --quiet labels
__name__
app
hostname
job

And as we expect, we will see the app label from the --client.external-labels=app=cli argument that we passed. We can also look at the values for a given label:

1
2
$ logcli --quiet labels app
cli

Now let’s query our logs using the label selector: {app="cli"}:

1
2
$ logcli --quiet --output raw query '{app="cli"}'
this is a test

If we remove the extra arguments, we will see more verbose output like the following:

1
2
3
4
5
6
7
$ logcli query '{app="cli"}'

http://localhost:3100/loki/api/v1/query_range?direction=BACKWARD&end=1605092055756745122&limit=30&query=%7Bapp%3D%22cli%22%7D&start=1605088455756745122
Common labels: {app="cli", hostname="loki", job="stdin"}
2020-11-11T12:45:20+02:00 {} this is a test
http://localhost:3100/loki/api/v1/query_range?direction=BACKWARD&end=1605091520778438972&limit=30&query=%7Bapp%3D%22cli%22%7D&start=1605088455756745122
Common labels: {app="cli", hostname="loki", job="stdin"}

We can pipe some more output to Loki:

1
$ echo "this is another test" | promtail --stdin --client.url http://localhost:3100/loki/api/v1/push --client.external-labels=app=cli -server.disable

And querying our logs:

1
2
3
$ logcli --quiet --output raw query '{app="cli"}'
this is another test
this is a test

Testing Loki Outside our VM

Let’s exit the VM and test Loki from our local workstation, first you will need to get the logcli for your OS, head over to the releases page and get the binary of your choice.

I will be demonstrating using a mac:

1
2
3
4
$ wget https://github.com/grafana/loki/releases/download/v2.0.0/logcli-darwin-amd64.zip
$ unzip logcli-darwin-amd64.zip
$ sudo mv logcli-darwin-amd64 /usr/local/bin/logcli
$ rm -f logcli-darwin-amd64.zip

Now we need to tell logcli where our Loki server resides, so let’s get the IP address of Loki:

1
2
$ multipass info --all --format json | jq -r '.info.loki.ipv4[]'
192.168.64.19

We can either set the Loki host as an environment variable:

1
$ export LOKI_ADDR=http://192.168.64.19

or you can specify it using the --addr argument:

1
$ logcli --addr="http://192.168.64.19:3100"

For the sake of simplicity and not having to type the --addr the whole time, I will be setting the Loki address as an environment variable:

1
$ export LOKI_ADDR="http://$(multipass info --all --format json | jq -r '.info.loki.ipv4[]'):3100"

And when we inspect our labels using logcli, we can see that we are getting our labels from Loki on our Multipass VM:

1
2
3
4
5
6
$ logcli labels
http://192.168.64.19:3100/loki/api/v1/labels?end=1605093229877731000&start=1605089629877731000
__name__
app
hostname
job

Write Logs to Loki using the Loki Docker Driver

We have used promtail before to pipe logs to Loki and in this example we will be making use of the Loki Docker Logging Plugin to write data to Loki.

If you have docker installed, install the Loki plugin:

1
2
3
4
$ docker plugin install \
  grafana/loki-docker-driver:latest \
  --alias loki \
  --grant-all-permissions

Now we will use a docker container to echo stdout to the loki docker driver, which will send the output to Loki.

Let’s alias a command loki_echo that we will use to send our output to the docker container:

1
$ alias 'loki_echo=docker run --rm -it --log-driver loki --log-opt loki-url="http://192.168.64.19:3100/loki/api/v1/push" --log-opt loki-external-labels="app=echo-container" busybox echo'

So every time we run loki_echo {string} we will run a docker container from the busybox image and pass the {string} as an argument to the echo command inside the container, which will be sent to the loki log driver and land up in Loki.

Let’s push 100 log events to Loki:

1
2
3
4
5
6
7
8
9
10
11
12
13
14
15
16
17
18
19
20
21
22
23
24
$ count=0
$ while [ ${count} != 100 ]
  do
    for color in red blue white silver green;
    do
      loki_echo "there are ${RANDOM} items of ${color} available";
      count=$((count+1))
    done
  done

there are 26890 items of green available
there are 14856 items of red available
there are 31162 items of blue available
there are 23993 items of white available
there are 22310 items of silver available
there are 10700 items of green available
there are 14077 items of red available
there are 20642 items of blue available
there are 31576 items of white available
there are 26053 items of silver available
there are 2973 items of green available
there are 2203 items of red available
there are 8557 items of blue available
...

We can verify how many log events we have with:

1
2
$ logcli query '{app="echo-container"}' --quiet --limit 200 --output raw | wc -l
100

To see how many logs we have with the line “blue” in it:

1
2
$ logcli query '{app="echo-container"} |= "blue"' --quiet --limit 200 --output raw | wc -l
20

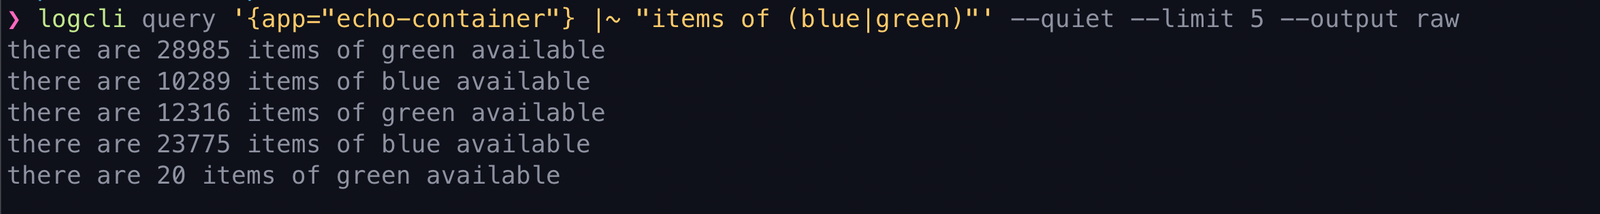
Let’s look for logs with blue or green and limit the results to 5:

1
2
3
4
5
6
$ logcli query '{app="echo-container"} |~ "items of (blue|green)"' --quiet --limit 5 --output raw
there are 28985 items of green available
there are 10289 items of blue available
there are 12316 items of green available
there are 23775 items of blue available
there are 20 items of green available

Teardown

If you followed along, you can terminate your Multipass VM with:

1
$ multipass delete --purge loki

You can get the example code in my multipassfiles github repository

Thanks

Thanks for reading, if you like my content, check out my website or follow me at @ruanbekker on Twitter.

How to Setup Alerting With Loki

image

Recently Grafana Labs announced Loki v2 and its awesome! Definitely check out their blog post on more details.

Loki has a index option called boltdb-shipper, which allows you to run Loki with only a object store and you no longer need a dedicated index store such as DynamoDB. You can extract labels from log lines at query time, which is CRAZY! And I really like how they’ve implemented it, you can parse, filter and format like mad. I really like that.

And then generating alerts from any query, which we will go into today. Definitely check out this blogpost and this video for more details on the features of Loki v2.

What will we be doing today

In this tutorial we will setup a alert using the Loki local ruler to alert us when we have high number of log events coming in. For example, let’s say someone has debug logging enabled in their application and we want to send a alert to slack when it breaches the threshold.

I will simulate this with a http-client container which runs curl in a while loop to fire a bunch of http requests against the nginx container which logs to Loki, so we can see how the alerting works, and in this scenario we will alert to Slack.

And after that we will stop our http-client container to see how the alarm resolves when the log rate comes down again.

All the components are available in the docker-compose.yml on my github repository

Components

Let’s break it down and start with the loki config:

1
2
3
4
5
6
7
8
9
10
11
12
13
...
ruler:
  storage:
    type: local
    local:
      directory: /etc/loki/rules
  rule_path: /tmp/loki/rules-temp
  alertmanager_url: http://alertmanager:9093
  ring:
    kvstore:
      store: inmemory
  enable_api: true
  enable_alertmanager_v2: true

In the section of the loki config, I will be making use of the local ruler and map my alert rules under /etc/loki/rules/ and we are also defining our alertmanager instance where these alerts should be shipped to.

In my rule definition /etc/loki/rules/demo/rules.yml:

1
2
3
4
5
6
7
8
9
10
11
12
13
14
15
16
17
18
19
20
21
groups:
  - name: rate-alerting
    rules:
      - alert: HighLogRate
        expr: |
          sum by (compose_service)
            (rate({job="dockerlogs"}[1m]))
            > 60
        for: 1m
        labels:
            severity: warning
            team: devops
            category: logs
        annotations:
            title: "High LogRate Alert"
            description: "something is logging a lot"
            impact: "impact"
            action: "action"
            dashboard: "https://grafana.com/service-dashboard"
            runbook: "https://wiki.com"
            logurl: "https://grafana.com/log-explorer"

In my expression, I am using LogQL to return per second rate of all my docker logs within the last minute per compose service for my dockerlogs job and we are specifying that it should alert when the threshold is above 60.

As you can see I have a couple of labels and annotations, which becomes very useful when you have dashboard links, runbooks etc and you would like to map that to your alert. I am doing the mapping in my alertmanager.yml config:

1
2
3
4
5
6
7
8
9
10
11
12
13
14
15
16
17
18
19
20
21
22
23
24
25
26
27
28
29
30
route:
...
  receiver: 'default-catchall-slack'
  routes:
  - match:
      severity: warning
    receiver: warning-devops-slack
    routes:
    - match_re:
        team: .*(devops).*
      receiver: warning-devops-slack

receivers:
...
- name: 'warning-devops-slack'
  slack_configs:
    - send_resolved: true
      channel: '__SLACK_CHANNEL__'
      title: ':fire::white_check_mark: []  '
      text: >-
        
          *Description:* 
          *Severity:* ``
          *Graph:* <|:chart_with_upwards_trend:><|:chart_with_upwards_trend:> *Dashboard:* <|:bar_chart:> *Runbook:* <|:spiral_note_pad:>
          *Details:*
           - *:* ``
          
           - *Impact*: 
           - *Receiver*: warning--slack
        

As you can see, when my alert matches nothing it will go to my catchall receiver, but when my label contains devops and the route the alert to my warning-devops-slack receiver, and then we will be parsing our labels and annotations to include the values in our alarm on slack.

Demo

Enough with the background details, and it’s time to get into the action.

All the code for this demonstration will be available in my github repository: github.com/ruanbekker/loki-alerts-docker

The docker-compose will have a container of grafana, alertmanager, loki, nginx and a http-client.

The http-client is curl in a while loop that will just make a bunch of http requests against the nginx container, which will be logging to loki.

Get the source

Get the code from my github repository:

1
2
$ git clone https://github.com/ruanbekker/loki-alerts-docker
$ cd loki-alerts-docker

You will need to replace the slack webhook url and the slack channel where you want your alerts to be sent to. This will take the environment variables and replace the values in config/alertmanager.yml (always check out the script first, before executing it)

1
$ SLACK_WEBHOOK_URL="https://hooks.slack.com/services/xx/xx/xx" SLACK_CHANNEL="#notifications" ./parse_configs.sh

You can double check by running cat config/alertmanager.yml, once you are done, boot the stack:

1
$ docker-compose up -d

Open up grafana:

1
$ open http://grafana.localdns.xyz:3000

Use the initial user and password combination admin/admin and then reset your password:

image

Browse for your labels on the log explorer section, in my example it will be {job="dockerlogs"}:

image

When we select our job=“dockerlogs” label, we will see our logs:

image

As I explained earlier the query that we will be running in our ruler, can be checked what the rate currently is:

1
sum by (compose_project, compose_service) (rate({job="dockerlogs"}[1m]))

Which will look like this:

image

In the configured expression in our ruler config, we have set to alarm once the value goes above 60, we can validate this by running:

1
sum by (compose_project, compose_service) (rate({job="dockerlogs"}[1m])) > 60

And we can verify that this is the case, and by now it should be alarming:

image

Head over to alertmanager:

1
$ open http://alertmanager.localdns.xyz:9093

We can see alertmanager is showing the alarm:

image

When we head over to slack, we can see our notification:

image

So let’s stop our http client:

1
2
$ docker-compose stop http-client
Stopping http-client ... done

Then we can see the logging stopped:

image

And in slack, we should see that the alarm recovered and we should see the notification:

image

Then you can terminate your stack:

1
$ docker-compose down

Pretty epic stuff right? I really love how cost effective Loki is as logging use to be so expensive to run and especially maintain, Grafana Labs are really doing some epic work and my hat goes off to them.

Thanks

I hope you found this useful, feel free to reach out to me on Twitter @ruanbekker or visit me on my website ruan.dev

Sending Slack Messages With Python

In this post I will demonstrate how to send messages to slack using python based on the status of an event.

We will keep it basic, that when something is down or up, it should send a slack message with the status, message, color and embed your grafana dashboard links inside the alert (or any links that you would like).

Create a Webhook

From a previous post on how to use curl to send slack messages I showed how to create your webhook, so you can just follow that post if you want to follow along.

Once you have a webhook, which will look like https://hooks.slack.com/services/xx/yy/zz, you are good to follow to the next step.

Creating the Script

First we need requests:

1
$ pip install requests

Then we will create the slack_notifier.py, just ensure that you replace your slack webhook url and slack channel to yours:

1
2
3
4
5
6
7
8
9
10
11
12
13
14
15
16
17
18
19
20
21
22
23
24
25
26
27
28
29
30
31
32
33
34
35
36
37
38
39
40
41
42
43
44
45
46
47
48
49
50
51
52
53
54
55
56
57
58
59
60
61
62
63
import requests
import sys
import os

SLACK_WEBHOOK_URL = 'https://hooks.slack.com/<your>/<slack>/<webhook>'
SLACK_CHANNEL = "#your-slack-channel"
ALERT_STATE = sys.argv[1]

alert_map = {
    "emoji": {
        "up": ":white_check_mark:",
        "down": ":fire:"
    },
    "text": {
        "up": "RESOLVED",
        "down": "FIRING"
    },
    "message": {
        "up": "Everything is good!",
        "down": "Stuff is burning!"
    },
    "color": {
        "up": "#32a852",
        "down": "#ad1721"
    }
}

def alert_to_slack(status, log_url, metric_url):
    data = {
        "text": "AlertManager",
        "username": "Notifications",
        "channel": SLACK_CHANNEL,
        "attachments": [
        {
            "text": "{emoji} [*{state}*] Status Checker\n {message}".format(
                emoji=alert_map["emoji"][status],
                state=alert_map["text"][status],
                message=alert_map["message"][status]
            ),
            "color": alert_map["color"][status],
            "attachment_type": "default",
            "actions": [
                {
                    "name": "Logs",
                    "text": "Logs",
                    "type": "button",
                    "style": "primary",
                    "url": log_url
                },
                {
                    "name": "Metrics",
                    "text": "Metrics",
                    "type": "button",
                    "style": "primary",
                    "url": metric_url
                }
            ]
        }]
    }
    r = requests.post(SLACK_WEBHOOK_URL, json=data)
    return r.status_code

alert_to_slack(ALERT_STATE, "https://grafana-logs.dashboard.local", "https://grafana-metrics.dashboard.local")

Testing it out

Time to test it out, so let’s assume something is down, then we can react on that event and action the following:

1
$ python slack_notifier.py down

Which will look like the following on slack:

image

And when recovery is in place, we can action the following:

1
$ python slack_notifier.py up

Which will look like this:

image

Thanks

That was a basic example on how you can use python to send slack messages.

Running SSH Commands on AWS EC2 Instances With Python

In this quick post I will demonstrate how to discover a EC2 Instance’s Private IP Address using the AWS API by using Tags then use Paramiko in Python to SSH to the EC2 instance and run SSH commands on the target instance.

Install the required dependencies:

1
2
3
$ virtualenv -p python3 .venv
$ source .venve/bin/activate
$ pip install boto3 paramiko

I have my development profile for aws configured under dev as can seen below:

1
2
3
4
5
6
7
$ aws --profile dev configure list
      Name                    Value             Type    Location
      ----                    -----             ----    --------
   profile                      dev           manual    --profile
access_key     ****************xxxx      assume-role
secret_key     ****************xxxx      assume-role
    region                eu-west-1      config-file    ~/.aws/config

First we need to discover the private ip address from the api by referencing tags, and in this example we will use the Name tag:

1
2
3
4
5
6
7
8
9
10
11
12
13
14
import boto3
ec2 = boto3.Session(profile_name='dev', region_name='eu-west-1').client('ec2')

target_instances = ec2.describe_instances(
    Filters=[{'Name':'tag:Name','Values':['my-demo-ec2-instance']}]
)

ec2_instances = []
for each_instance in target_instances['Reservations']:
    for found_instance in each_instance['Instances']:
        ec2_instances.append(found_instance['PrivateIpAddress'])

# ec2_instances
# ['172.31.2.89']

So we are instantiating a ec2 instance with our configured dev profile, then we describe all our instances using the tag key Name and value my-demo-ec2-instance and then access the private ip address and append it to our ec2_instances list.

Next we want to define the commands that we want to run on the target ec2 instance:

1
2
3
4
5
commands = [
    "echo hi",
    "whoami",
    "hostname"
]

In my case I only have 1 ec2 instance with the name my-demo-ec2-instance, but if you have more you can just loop through the list and perform the actions.

Next we want to establish the SSH connection:

1
2
3
4
k = paramiko.RSAKey.from_private_key_file("/Users/ruan/.ssh/id_rsa")
c = paramiko.SSHClient()
c.set_missing_host_key_policy(paramiko.AutoAddPolicy())
c.connect(hostname=ec2_instances[0], username="ruan", pkey=k, allow_agent=False, look_for_keys=False)

Once our SSH connection has established, we can loop through our commands and execute them:

1
2
3
4
5
for command in commands:
    print("running command: {}".format(command))
    stdin , stdout, stderr = c.exec_command(command)
    print(stdout.read())
    print(stderr.read())

Which will output the folling:

1
2
3
4
5
6
7
8
9
running command: echo hi
b'hi\n'
b''
running command: whoami
b'ruan\n'
b''
running command: hostname
b'ip-172-31-2-89\n'
b''

And then close the SSH connection:

1
c.close()

And the full script will look like this:

1
2
3
4
5
6
7
8
9
10
11
12
13
14
15
16
17
18
19
20
21
22
23
24
25
26
27
28
29
30
31
32
33
import boto3
ssh_username = "ruan"
ssh_key_file = "/Users/ruan/.ssh/id_rsa"

ec2 = boto3.Session(profile_name='dev', region_name='eu-west-1').client('ec2')

target_instances = ec2.describe_instances(
    Filters=[{'Name':'tag:Name','Values':['my-demo-ec2-instance']}]
)

ec2_instances = []
for each_instance in target_instances['Reservations']:
    for found_instance in each_instance['Instances']:
        ec2_instances.append(found_instance['PrivateIpAddress'])

commands = [
    "echo hi",
    "whoami",
    "hostname"
]

k = paramiko.RSAKey.from_private_key_file(ssh_key_file)
c = paramiko.SSHClient()
c.set_missing_host_key_policy(paramiko.AutoAddPolicy())
c.connect(hostname=ec2_instances[0], username=ssh_username, pkey=k, allow_agent=False, look_for_keys=False)

for command in commands:
    print("running command: {}".format(command))
    stdin , stdout, stderr = c.exec_command(command)
    print(stdout.read())
    print(stderr.read())

c.close()

Running Loki Behind Nginx Reverse Proxy

In this tutorial I will demonstrate how to run Loki v2.0.0 behind a Nginx Reverse Proxy with basic http authentication enabled on Nginx and what to do to configure Nginx for websockets, which is required when you want to use tail in logcli via Nginx.

Assumptions

My environment consists of a AWS Application LoadBalancer with a Host entry and a Target Group associated to port 80 of my Nginx/Loki EC2 instance.

Health checks to my EC2 instance are being performed to instance:80/ready

I have a S3 bucket and a DynamoDB table already running in my account which Loki will use. But NOTE that boltdb-shipper is now production ready since v2.0.0, which is awesome, because now you only require a object store such as S3, so you don’t need DynamoDB.

More information on this topic can be found under their changelog

What can you expect from this blogpost

We will go through the following topics:

  • Install Loki v2.0.0 and Nginx
  • Configure HTTP Basic Authentication to Loki’s API Endpoints
  • Bypass HTTP Basic Authentication to the /ready endpoint for our Load Balancer to perform healthchecks
  • Enable Nginx to upgrade websocket connections so that we can use logcli --tail
  • Test out access to Loki via our Nginx Reverse Proxy
  • Install and use LogCLI

Install Software

First we will install nginx and apache2-utils. In my use-case I will be using Ubuntu 20 as my operating system:

1
$ sudo apt update && sudo apt install nginx apache2-utils -y

Next we will install Loki v2.0.0, if you are upgrading from a previous version of Loki, I would recommend checking out the upgrade guide mentioned on their releases page.

Download the package:

1
$ curl -O -L "https://github.com/grafana/loki/releases/download/v2.0.0/loki-linux-amd64.zip"

Unzip the archive:

1
$ unzip loki-linux-amd64.zip

Move the binary to your $PATH:

1
$ sudo mv loki-linux-amd64 /usr/local/bin/loki

And ensure that the binary is executable:

1
$ sudo chmod a+x /usr/local/bin/loki

Configuration

Create the user that will be responsible for running loki:

1
$ useradd --no-create-home --shell /bin/false loki

Create the directory where we will place the loki configuration:

1
$ mkdir /etc/loki

Create the loki configuration file:

1
2
3
4
5
6
7
8
9
10
11
12
13
14
15
16
17
18
19
20
21
22
23
24
25
26
27
28
29
30
31
32
33
34
35
36
37
38
39
40
41
42
43
44
45
46
47
48
49
50
51
52
53
54
55
56
57
58
59
60
61
62
63
64
65
66
67
68
69
70
71
72
$ cat /etc/loki/loki-config.yml
auth_enabled: false

server:
  http_listen_port: 3100
  http_listen_address: 127.0.0.1
  http_server_read_timeout: 1000s
  http_server_write_timeout: 1000s
  http_server_idle_timeout: 1000s
  log_level: info

ingester:
  lifecycler:
    address: 127.0.0.1
    ring:
      kvstore:
        store: inmemory
      replication_factor: 1
    final_sleep: 0s
  chunk_encoding: snappy
  chunk_idle_period: 1h
  chunk_target_size: 1048576
  chunk_retain_period: 30s
  max_transfer_retries: 0

# https://grafana.com/docs/loki/latest/configuration/#schema_config
schema_config:
  configs:
    - from: 2020-05-15
      store: aws
      object_store: s3
      schema: v11
      index:
        prefix: loki-logging-index

storage_config:
  aws:
    http_config:
      idle_conn_timeout: 90s
      response_header_timeout: 0s
    s3: s3://myak:mysk@eu-west-1/loki-logs-datastore

    dynamodb:
      dynamodb_url: dynamodb://myak:mysk@eu-west-1

limits_config:
  enforce_metric_name: false
  reject_old_samples: true
  reject_old_samples_max_age: 168h
  ingestion_rate_mb: 30
  ingestion_burst_size_mb: 60

# https://grafana.com/docs/loki/latest/operations/storage/retention/
# To avoid querying of data beyond the retention period, max_look_back_period config in chunk_store_config
# must be set to a value less than or equal to what is set in table_manager.retention_period
chunk_store_config:
  max_look_back_period: 720h

# https://grafana.com/docs/loki/latest/operations/storage/retention/
table_manager:
  retention_deletes_enabled: true
  retention_period: 720h
  chunk_tables_provisioning:
    inactive_read_throughput: 10
    inactive_write_throughput: 10
    provisioned_read_throughput: 50
    provisioned_write_throughput: 20
  index_tables_provisioning:
    inactive_read_throughput: 10
    inactive_write_throughput: 10
    provisioned_read_throughput: 50
    provisioned_write_throughput: 20

Apply permissions so that the loki user has access to it’s configuration:

1
$ chown -R loki:loki /etc/loki

Create a systemd unit file:

1
2
3
4
5
6
7
8
9
10
11
12
13
14
15
$ cat /etc/systemd/system/loki.service
[Unit]
Description=Loki
Wants=network-online.target
After=network-online.target

[Service]
User=loki
Group=loki
Type=simple
Restart=on-failure
ExecStart=/usr/local/bin/loki -config.file /etc/loki/loki-config.yml

[Install]
WantedBy=multi-user.target

Create the main nginx config:

1
2
3
4
5
6
7
8
9
10
11
12
13
14
15
16
17
18
19
20
21
22
23
24
25
26
27
28
29
30
31
32
33
34
35
36
37
38
39
40
41
42
43
44
45
46
47
48
49
50
51
52
53
54
55
56
57
58
59
60
61
62
63
64
65
66
67
68
69
70
71
72
73
74
$ cat /etc/nginx/nginx.conf
user www-data;
worker_processes auto;
pid /run/nginx.pid;
include /etc/nginx/modules-enabled/*.conf;
worker_rlimit_nofile 100000;

events {
        worker_connections 4000;
        use epoll;
        multi_accept on;
}

http {

  # basic settings
  sendfile on;
  tcp_nopush on;
  tcp_nodelay on;
  keepalive_timeout 65;
  types_hash_max_size 2048;
        open_file_cache_valid 30s;
        open_file_cache_min_uses 2;
        open_file_cache_errors on;

  include /etc/nginx/mime.types;
  default_type application/octet-stream;

        # ssl settings
  ssl_protocols TLSv1 TLSv1.1 TLSv1.2;
  ssl_prefer_server_ciphers on;

  # websockets config
  map $http_upgrade $connection_upgrade {
            default upgrade;
            '' close;
        }

  # logging settings
  access_log off;
  access_log /var/log/nginx/access.log;
  error_log /var/log/nginx/error.log;

  # gzip settings
  gzip on;
      gzip_min_length 10240;
      gzip_comp_level 1;
      gzip_vary on;
      gzip_disable msie6;
      gzip_proxied expired no-cache no-store private auth;
      gzip_types
      text/css
      text/javascript
      text/xml
      text/plain
      text/x-component
      application/javascript
      application/x-javascript
      application/json
      application/xml
      application/rss+xml
      application/atom+xml
      font/truetype
      font/opentype
      application/vnd.ms-fontobject
      image/svg+xml;
      reset_timedout_connection on;
      client_body_timeout 10;
      send_timeout 2;
      keepalive_requests 100000;
        
        # virtual host configs
      include /etc/nginx/conf.d/loki.conf;
}

Create the virtual host config:

1
2
3
4
5
6
7
8
9
10
11
12
13
14
15
16
17
18
19
20
21
22
23
24
25
26
27
28
29
30
31
32
33
34
$ cat /etc/nginx/conf.d/loki.conf
upstream loki {
  server 127.0.0.1:3100;
  keepalive 15;
}

server {
  listen 80;
  server_name loki.localdns.xyz;

  auth_basic "loki auth";
  auth_basic_user_file /etc/nginx/passwords;

  location / {
    proxy_read_timeout 1800s;
    proxy_connect_timeout 1600s;
    proxy_pass http://loki;
    proxy_http_version 1.1;
    proxy_set_header Upgrade $http_upgrade;
    proxy_set_header Connection $connection_upgrade;
    proxy_set_header Connection "Keep-Alive";
    proxy_set_header Proxy-Connection "Keep-Alive";
    proxy_redirect off;
  }

  location /ready {
    proxy_pass http://loki;
    proxy_http_version 1.1;
    proxy_set_header Connection "Keep-Alive";
    proxy_set_header Proxy-Connection "Keep-Alive";
    proxy_redirect off;
    auth_basic "off";
  }
}

As you’ve noticed, we are providing a auth_basic_user_file to /etc/nginx/passwords, so let’s create a user that we will be using to authenticate against loki:

1
$ htpasswd -c /etc/nginx/passwords lokiisamazing

Enable and Start Services

Because we created a systemd unit file, we need to reload the systemd daemon:

1
$ sudo systemctl daemon-reload

Then enable nginx and loki on boot:

1
2
$ sudo systemctl enable nginx
$ sudo systemctl enable loki

Then start or restart both services:

1
2
$ sudo systemctl restart nginx
$ sudo systemctl restart loki

You should see both ports, 80 and 3100 are listening:

1
2
3
$ sudo netstat -tulpn | grep -E '(3100|80)'
tcp        0      0 0.0.0.0:80              0.0.0.0:*               LISTEN      8949/nginx: master
tcp        0      0 127.0.0.1:3100          0.0.0.0:*               LISTEN      23498/loki

Test Access

You will notice that I have a /ready endpoint that I am proxy passing to loki, which bypasses authentication, this has been setup for my AWS Application Load Balancer’s Target Group to perform health checks against.

We can verify if we are getting a 200 response code without passing authentication:

1
2
3
4
5
6
7
8
9
10
$ curl -i http://loki.localdns.xyz/ready
HTTP/1.1 200 OK
Server: nginx/1.14.0 (Ubuntu)
Date: Thu, 29 Oct 2020 09:15:52 GMT
Content-Type: text/plain; charset=utf-8
Content-Length: 6
Connection: keep-alive
X-Content-Type-Options: nosniff

ready

If we try to make a request to Loki’s labels API endpoint, you will notice that we are returned with a 401 unauthorized response:

1
2
3
4
5
6
7
8
$ curl -i http://loki.localdns.xyz/loki/api/v1/labels
HTTP/1.1 401 Unauthorized
Server: nginx/1.14.0 (Ubuntu)
Date: Thu, 29 Oct 2020 09:16:52 GMT
Content-Type: text/html
Content-Length: 204
Connection: keep-alive
WWW-Authenticate: Basic realm="loki auth"

So let’s access the labels API endpoint by passing our basic auth credentials. To leave no leaking passwords behind, create a file and save your password content in that file:

1
2
$ vim /tmp/.pass
-> then enter your password and save the file <-

Expose the content as an environment variable:

1
$ pass=$(cat /tmp/.pass)

Now make a request to Loki’s labels endpoint by passing authentication:

1
2
3
4
5
6
7
8
9
$ curl -i -u lokiisawesome:$pass http://loki.localdns.xyz/loki/api/v1/labels
HTTP/1.1 200 OK
Server: nginx/1.14.0 (Ubuntu)
Date: Thu, 29 Oct 2020 09:20:20 GMT
Content-Type: application/json; charset=UTF-8
Content-Length: 277
Connection: keep-alive

{"status":"success","data":["__name__","aws_account","cluster_name","container_name","environment","filename","job","service","team"]}

Then ensure that your remove the password file:

1
$ rm -rf /tmp/.pass

And unset your pass environment variable, to clean up your tracks:

1
$ unset pass

LogCLI

Now for my favorite part, using logcli to interact with Loki, but more specifically using --tail as it requires websockets, nginx will now be able to upgrade those connections:

Install logcli, in my case I am using a mac, so I will be using darwin:

1
2
3
$ wget https://github.com/grafana/loki/releases/download/v2.0.0/logcli-darwin-amd64.zip
$ unzip logcli-darwin-amd64.zip
$ mv logcli-darwin-amd64 /usr/local/bin/logcli

Set your environment variables for logcli:

1
2
3
$ export LOKI_ADDR=https://loki.yourdomain.com # im doing ssl termination on the aws alb
$ export LOKI_USERNAME=lokiisawesome
$ export LOKI_PASSWORD=$pass 

Now for that sweetness of tailing ALL THE LOGS!! :-D . Let’s first discover the label that we want to select:

1
2
$ logcli labels --quiet container_name | grep deadman
ecs-deadmanswitch-4-deadmanswitch-01234567890abcdefghi

Then tail for the win!

1
2
3
$ logcli query --quiet --output raw --tail '{job="prod/dockerlogs", container_name=~"ecs-deadmanswitch.*"}'
time="2020-10-29T09:03:36Z" level=info msg="timerID: xxxxxxxxxxxxxxxxxxxx"
time="2020-10-29T09:03:36Z" level=info msg="POST - /ping/xxxxxxxxxxxxxxxxxxx"

Awesome right?

Thank You

Hope that you found this useful, make sure to follow Grafana’s blog for more awesome content:

If you liked this content, please make sure to share or come say hi on my website or twitter:

For other content of mine on Loki:

Upload Public SSH Keys Using Ansible

In this post I will demonstrate how you can use ansible to automate the task of adding one or more ssh public keys to multiple servers authorized_keys file.

This will be focused in a scenario where you have 5 new ssh keys that we would want to copy to our bastion hosts authorized_keys file

The User Accounts

We have our bastion server named bastion.mydomain.com where would like to create the following accounts: john, bob, sarah, sam, adam and also upload their personal ssh public keys to those accounts so that they can logon with their ssh private keys.

On my local directory, I have their ssh public keys as:

1
2
3
4
5
~/workspace/sshkeys/john.pub
~/workspace/sshkeys/bob.pub
~/workspace/sshkeys/sarah.pub
~/workspace/sshkeys/sam.pub
~/workspace/sshkeys/adam.pub

They will be referenced in our playbook as key: ".pub') }}" but if they were on github we can reference them as key: https://github.com/.keys, more info on that can be found on the authorized_key_module documentation.

The Target Server

Our inventory for the target server only includes one host, but we can add as many as we want, but our inventory will look like this:

1
2
3
4
5
$ cat inventory.ini
[bastion]
bastion-host ansible_host=34.x.x.x ansible_user=ubuntu ansible_ssh_private_key_file=~/.ssh/ansible.pem ansible_python_interpreter=/usr/bin/python3
[bastion:vars]
ansible_ssh_common_args='-o StrictHostKeyChecking=no -o UserKnownHostsFile=/dev/null'

Test if the target server is reachable using the user ubuntu using our admin accounts ssh key ansible.pem:

1
2
3
4
5
$ ansible -i inventory.ini -m ping bastion
bastion | SUCCESS => {
    "changed": false,
    "ping": "pong"
}

Our Playbook

In this playbook, we will reference the users that we want to create and it will loop through those users, creating them on the target server and also use those names to match to the files on our laptop to match the ssh public keys:

1
2
3
4
5
6
7
8
9
10
11
12
13
14
15
16
17
18
19
20
21
22
23
24
25
26
27
28
29
30
31
32
33
34
35
$ cat playbook.yml
---
- hosts: bastion
  become: yes
  become_user: root
  become_method: sudo
  tasks:
    - name: create local user account on the target server
      user:
        name: ''
        comment: ''
        shell: /bin/bash
        append: yes
        groups: sudo
        generate_ssh_key: yes
        ssh_key_type: rsa
      with_items:
        - john
        - bob
        - sarah
        - sam
        - adam

    - name: upload ssh public key to users authorized keys file
      authorized_key:
        user: ''
        state: present
        manage_dir: yes
        key: ".pub') }}"
      with_items:
        - john
        - bob
        - sarah
        - sam
        - adam

Deploy

Run the playbook:

1
2
3
4
5
6
7
8
9
10
11
12
13
14
15
16
17
18
19
20
21
22
23
$ ansible-playbook -i inventory.ini ssh-setup.yml

PLAY [bastion]

TASK [Gathering Facts]
ok: [bastion-host]

TASK [create local user account on the target server]
changed: [bastion-host] => (item=john)
changed: [bastion-host] => (item=bob)
changed: [bastion-host] => (item=sarah)
changed: [bastion-host] => (item=sam)
changed: [bastion-host] => (item=adam)

TASK [upload ssh public key to users authorized keys file]
changed: [bastion-host] => (item=john)
changed: [bastion-host] => (item=bob)
changed: [bastion-host] => (item=sarah)
changed: [bastion-host] => (item=sam)
changed: [bastion-host] => (item=adam)

PLAY RECAP
bastion-host                   : ok=6    changed=5    unreachable=0    failed=0    skipped=0    rescued=0    ignored=0

Now when we ask one of the users, adam for example, to authenticate with:

1
$ ssh -i ~/.ssh/path_to_his_private_key.pem adamin@bastion.mydomain.com

They should have access to the server.

Thank You

Thanks for reading, for more information on this module check out their documentation:

Easy Ad-Hoc VPNs With Sshuttle

Theres a utility called sshuttle which allows you to VPN via a SSH connection, which is really handy when you quickly want to be able to reach a private range, which is accessible from a public reachable server such as a bastion host.

In this tutorial, I will demonstrate how to install sshuttle on a mac, if you are using a different OS you can see their documentation and then we will use the VPN connection to reach a “prod” and a “dev” environment.

SSH Config

We will declare 2 jump-boxes / bastion hosts in our ssh config:

  • dev-jump-host is a public server that has network access to our private endpoints in 172.31.0.0/16
  • prod-jump-host is a public server that has network access to our private endpoints in 172.31.0.0/16

In this case, the above example is 2 AWS Accounts with the same CIDR’s, and wanted to demonstrate using sshuttle for this reason, as if we had different CIDRs we can setup a dedicated VPN and route them respectively.

1
2
3
4
5
6
7
8
9
10
11
12
13
14
15
16
17
$ cat ~/.ssh/config
Host *
    Port 22
    StrictHostKeyChecking no
    UserKnownHostsFile /dev/null
    ServerAliveInterval 60
    ServerAliveCountMax 30

Host dev-jump-host
    HostName dev-bastion.mydomain.com
    User bastion
    IdentityFile ~/.ssh/id_rsa

Host prod-jump-host
    HostName prod-bastion.mydomain.com
    User bastion
    IdentityFile ~/.ssh/id_rsa

Install sshuttle

Install sshuttle for your operating system:

1
2
3
4
5
# macos
$ brew install shuttle

# debian
$ apt install sshuttle

Usage

To setup a vpn tunnel to route connections to our prod account:

1
$ sshuttle -r prod-jump-host 172.31.0.0/16

Or to setup a vpn tunnel to route connections to our dev account:

1
$ sshuttle -r dev-jump-host 172.31.0.0/16

Once one of your chosen sessions establishes, you can use a new terminal to access your private network, as example:

1
$ nc -vz 172.31.23.40 22

Bash Functions

We can wrap this into functions, so we can use vpn_dev or vpn_prod which aliases to the commands shown below:

1
2
3
4
5
6
7
8
$ cat ~/.functions
vpn_prod(){
  sshuttle -r prod-jump-host 172.31.0.0/16
}

vpn_dev(){
  sshuttle -r dev-jump-host 172.31.0.0/16
}

Now source that to your environment:

1
$ source ~/.functions

Then you should be able to use vpn_dev and vpn_prod from your terminal:

1
2
3
4
$ vpn_prod
[local sudo] Password:
Warning: Permanently added 'xx,xx' (ECDSA) to the list of known hosts.
client: Connected.

And in a new terminal we can connect to a RDS MySQL Database sitting in a private network:

1
2
$ mysql -h my-prod-db.pvt.mydomain.com -u dbadmin -p$pass
mysql>

Sshuttle as a Service

You can create a systemd unit file to run a sshuttle vpn as a service. In this scenario I provided 2 different vpn routes, dev and prod, so you can create 2 seperate systemd unit files, but my case I will only create for prod:

1
2
3
4
5
6
7
8
9
10
11
12
13
14
15
16
17
18
$ cat /etc/systemd/system/vpn_prod.service
[Unit]
Description=ShuttleProdVPN
Wants=network-online.target
After=network-online.target
StartLimitIntervalSec=500
StartLimitBurst=5

[Service]
User=root
Group=root
Type=simple
Restart=on-failure
RestartSec=10s
ExecStart=/usr/bin/sshuttle -r prod-jump-host 172.31.0.0/16

[Install]
WantedBy=multi-user.target

Reload the systemd daemon:

1
$ sudo systemctl daemon-reload

Enable and start the service:

1
2
$ sudo systemctl enable vpn_prod
$ sudo systemctl start vpn_prod

Thank You

Thanks for reading.