Ruan Bekker's Blog

From a Curious mind to Posts on Github

Concourse Pipeline to Build a Docker Image Automatically on Git Commit

In this tutorial we will build a ci pipeline using concourse to build and push a image to dockerhub automatically, whenever a new git commit is made to the master branch.

Our Project Setup

Our Directory Tree:

1
2
3
4
5
6
$ find .
./Dockerfile
./ci
./ci/pipeline.yml
./README.md
./docker-tunnel

The project used in this example is not important, but you can check it out at https://github.com/ruanbekker/docker-remote-tunnel

Our Pipeline

A visual to see how the pipeline will look like in concourse:

Our pipeline definition will consist of 3 resources, github repo, dockerhub image and a slack resource to inform use whether a build has completed.

Then we are specifying that the job should be triggered on a git commit for the master branch, build and push to our dockerhub repo.

Our pipeline definition ci/pipeline.yml:

1
2
3
4
5
6
7
8
9
10
11
12
13
14
15
16
17
18
19
20
21
22
23
24
25
26
27
28
29
30
31
32
33
34
35
36
37
38
39
40
41
42
43
44
45
46
47
48
49
50
51
52
53
54
55
56
57
58
59
60
61
62
63
64
65
66
67
68
69
70
71
72
73
74
75
76
77
78
79
80
81
82
83
84
85
86
87
88
89
90
91
92
93
94
95
96
97
98
99
100
101
102
103
104
105
106
107
108
109
110
111
112
113
114
115
116
117
118
119
120
121
122
123
124
125
126
127
128
129
130
resources:
- name: git-repo
  type: git
  source:
    uri: git@github.com:ruanbekker/docker-remote-tunnel.git
    branch: master
    private_key: ((github_private_key))

- name: docker-remote-tunnel-image
  type: docker-image
  source:
    repository: ruanbekker/docker-remote-tunnel
    tag: test
    username: ((dockerhub_user))
    password: ((dockerhub_password))

- name: slack-alert
  type: slack-notification
  source:
    url: ((slack_notification_url))

resource_types:
  - name: slack-notification
    type: docker-image
    source:
      repository: cfcommunity/slack-notification-resource
      tag: v1.3.0

jobs:
- name: build-cached-image
  plan:
  - get: git-repo
    trigger: true
  - task: build-cached-image-workspace
    config:
      platform: linux
      image_resource:
        type: docker-image
        source:
          repository: rbekker87/build-tools

      outputs:
      - name: workspace
      inputs:
      - name: git-repo

      run:
        path: /bin/sh
        args:
        - -c
        - |
          output_dir=workspace

          cat << EOF > "${output_dir}/Dockerfile"
          FROM alpine

          ADD git-repo /tmp/git-repo
          RUN mv /tmp/git-repo/docker-tunnel /usr/bin/docker-tunnel
          RUN apk --no-cache add screen docker openssl openssh-client apache2-utils
          RUN /usr/bin/docker-tunnel -h
          RUN rm -rf /tmp/git-repo
          EOF

          cp -R ./git-repo "${output_dir}/git-repo"

  - put: docker-remote-tunnel-image
    params:
      build: workspace

    on_failure:
      put: slack-alert
      params:
        channel: '#system_events'
        username: 'concourse'
        icon_emoji: ':concourse:'
        silent: true
        text: |
            *$BUILD_PIPELINE_NAME/$BUILD_JOB_NAME* ($BUILD_NAME) FAILED to build image
            https://ci.domain.com/teams/$BUILD_TEAM_NAME/pipelines/$BUILD_PIPELINE_NAME/jobs/$BUILD_JOB_NAME/builds/$BUILD_NAME
    on_success:
      put: slack-alert
      params:
        channel: '#system_events'
        username: 'concourse'
        icon_emoji: ':concourse:'
        silent: true
        text: |
            *$BUILD_PIPELINE_NAME/$BUILD_JOB_NAME* ($BUILD_NAME) SUCCESS - Image has been published
            https://ci.domain.com/teams/$BUILD_TEAM_NAME/pipelines/$BUILD_PIPELINE_NAME/jobs/$BUILD_JOB_NAME/builds/$BUILD_NAME

- name: test
  plan:
  - get: docker-remote-tunnel-image
    passed: [build-cached-image]
    trigger: true
  - get: git-repo
    passed: [build-cached-image]
  - task: run-tests
    image: docker-remote-tunnel-image
    config:
      platform: linux
      inputs:
      - name: git-repo
      run:
        dir: git-repo
        path: sh
        args:
        - /usr/bin/docker-tunnel
        - --help

    on_failure:
      put: slack-alert
      params:
        channel: '#system_events'
        username: 'concourse'
        icon_emoji: ':concourse:'
        silent: true
        text: |
            *$BUILD_PIPELINE_NAME/$BUILD_JOB_NAME* ($BUILD_NAME) FAILED - Testing image failure
            https://ci.domain.com/teams/$BUILD_TEAM_NAME/pipelines/$BUILD_PIPELINE_NAME/jobs/$BUILD_JOB_NAME/builds/$BUILD_NAME
    on_success:
      put: slack-alert
      params:
        channel: '#system_events'
        username: 'concourse'
        icon_emoji: ':concourse:'
        silent: true
        text: |
            *$BUILD_PIPELINE_NAME/$BUILD_JOB_NAME* ($BUILD_NAME) SUCCESS - Testing image Succeeded
            https://ci.domain.com/teams/$BUILD_TEAM_NAME/pipelines/$BUILD_PIPELINE_NAME/jobs/$BUILD_JOB_NAME/builds/$BUILD_NAME

Note that our secret information is templatized and saved in our local credentials.yml which should never be stored in version control:

1
2
3
4
5
6
7
slack_notification_url: https://api.slack.com/aaa/bbb/ccc
dockerhub_user: myuser
dockerhub_password: mypasswd
github_private_key: |-
        -----BEGIN RSA PRIVATE KEY-----
        some-secret-data
        -----END RSA PRIVATE KEY------

Set the Pipeline:

Now that we have our pipeline definition, credentials and application code (stored in version control), go ahead and set the pipeline, which will save the pipeline configuration in concourse:

1
2
# pipeline name: my-docker-app-pipeline
$ fly -t scw sp -n main -c pipeline.yml -p my-docker-app-pipeline -l credentials.yml

Now the pipeline is saved on concourse but in a paused state, go ahead and unpause the pipeline:

1
$ fly -t scw up -p my-docker-app-pipeline

Test your Pipeline

Make a commit to master and head over to concourse and look at it go:

Thanks for reading, make sure to check out my other posts on #concourse

Ship Your Logs to Elasticsearch With Filebeat

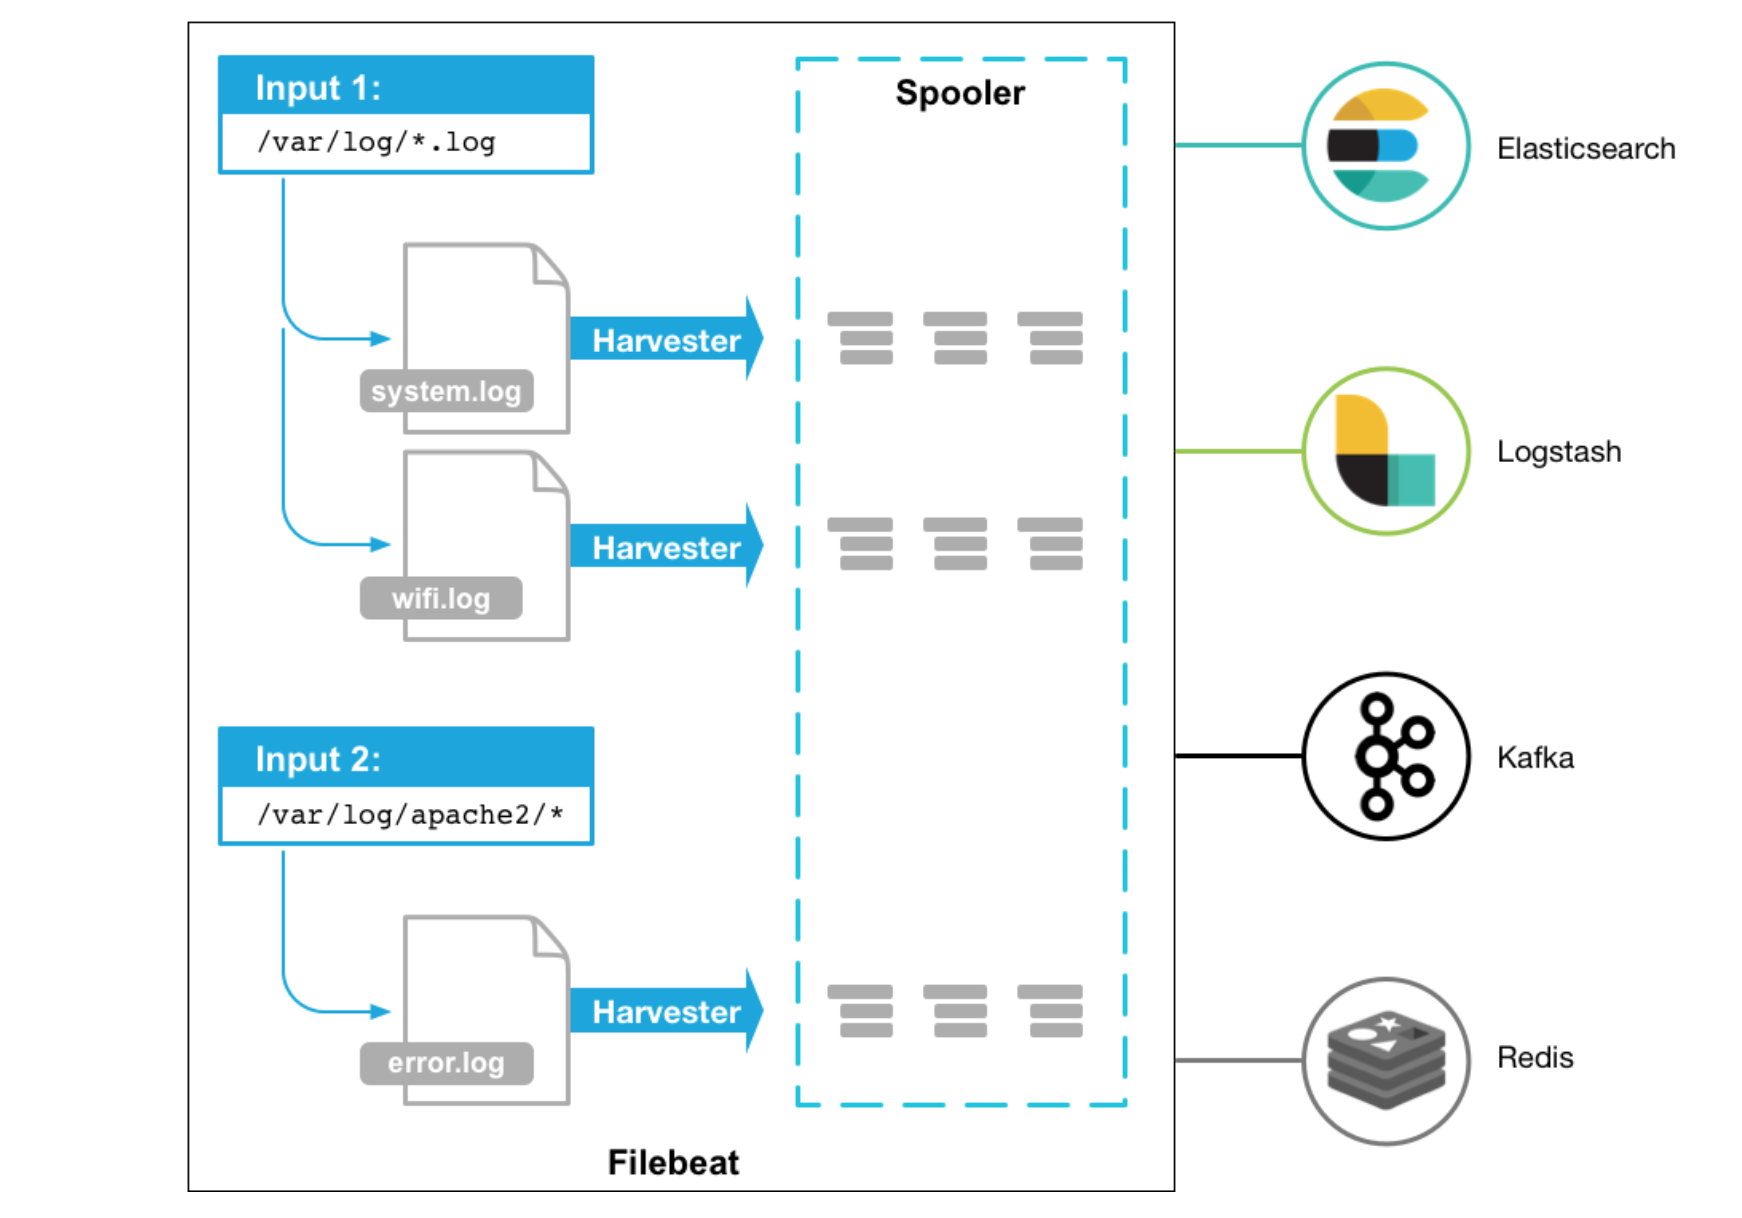
Filebeat by Elastic is a lightweight log shipper, that ships your logs to Elastic products such as Elasticsearch and Logstash. Filbeat monitors the logfiles from the given configuration and ships the to the locations that is specified.

Filebeat Overview

Filebeat runs as agents, monitors your logs and ships them in response of events, or whenever the logfile receives data.

Below is a overview (credit: elastic.co) how Filebeat works

Installing Filebeat

Let’s go ahead and install Filebeat. I will be using version 6.7 as that will be the same version that I am running on my Elasticsearch. To check the version of your elasticsearch cluster:

1
$ curl http://127.0.0.1:9200/_cluster/health?pretty # i have es running locally

Install the dependencies:

1
$ apt install wget apt-transport-https -y

Get the public signing key:

1
$ wget -qO - https://artifacts.elastic.co/GPG-KEY-elasticsearch | sudo apt-key add -

Get the repository definition:

1
$ echo "deb https://artifacts.elastic.co/packages/6.x/apt stable main" | tee -a /etc/apt/sources.list.d/elastic-6.x.list

Update the repositories:

1
$ apt update && apt upgrade -y

Install Filebeat and enable the service on boot:

1
2
$ apt install filebeat -y
$ systemctl enable filebeat

Configure Filebeat

Let’s configure our main configuration in filebeat, to specify our location where the data should be shipped to (in this case elasticsearch) and I will also like to set some extra fields that will apply to this specific server.

Open up /etc/filebeat/filebeat.yml and edit the following:

1
2
3
4
5
6
7
8
9
10
11
12
13
14
15
16
17
18
19
20
21
22
23
24
25
26
27
28
29
filebeat.inputs:

- type: log
  enabled: false
  paths:
    - /var/log/nginx/*.log

filebeat.config.modules:
  path: ${path.config}/modules.d/*.yml
  reload.enabled: false

setup.template.settings:
  index.number_of_shards: 3

fields:
  blog_name: sysadmins
  service_type: webserver
  cloud_provider: aws

setup.kibana:
  host: "http://localhost:5601"
  username: "elastic"
  password: "changeme"

output.elasticsearch:
  hosts: ["localhost:9200"]
  protocol: "http"
  username: "elastic"
  password: "changeme"

Above, just setting my path to nginx access logs, some extra fields, including that it shoulds seed kibana with example visualizations and the output configuration of elasticsearch.

Filebeat Modules

Filebeat comes with modules that has context on specific applications like nginx, mysql etc. Lets enable system (syslog, auth, etc) and nginx for our web server:

1
2
$ filebeat modules enable system
$ filebeat modules enable nginx

Example of my /etc/filebeat/modules.d/system.yml configuration:

1
2
3
4
5
6
7
8
- module: system
  syslog:
    enabled: true
    var.paths: ["/var/log/syslog"]

  auth:
    enabled: true
    var.paths: ["/var/log/auth.log"]

Example of my /etc/filebeat/modules.d/nginx.yml configuration:

1
2
3
4
5
6
7
8
- module: nginx
  access:
    enabled: true
    var.paths: ["/var/log/nginx/access.log"]

  error:
    enabled: true
    var.paths: ["/var/log/nginx/error.log"]

Now setup the templates

1
$ filebeat setup

Then restart filebeat:

1
$ /etc/init.d/filebeat restart

You can have a look at the logs, should you need to debug:

1
tail -f /var/log/filebeat/filebeat

Your data should now be shipped to elasticsearch, by default under the filebeat-YYYY.mm.dd index pattern.

1
2
3
$ curl 'http://127.0.0.1:9200/_cat/indices/filebeat*?v'
health status index                     uuid                   pri rep docs.count docs.deleted store.size pri.store.size
green  open   filebeat-6.7.1-2019.03.27 CBdV7adjRKypN1wguwuHDA   3   1     453220            0    230.2mb        115.9mb

Kibana

You can head over to Kibana at http://localhost:5601 (in this case) to visualize the data that is ingested into your filebeat index. I will write a tutorial on how to graph up most common dashboards later this week.

Thats it for now :D

Resources:

How to Deploy a Docker Swarm Cluster on Scaleway With Terraform

We will deploy a 3 node docker swarm cluster with terraform on scaleway. I have used the base source code from this repository but tweaked the configuration to my needs.

Pre-Requisites

Ensure terraform and jq is instaled:

1
2
$ brew install terraform
$ brew install jq

Terraform

You can have a look at the linked source at the top for the source code, but below I will provide each file that will make up our terraform deployment.

Ource main.tf

1
2
3
4
5
6
7
8
9
10
11
12
13
14
15
16
17
18
19
20
21
provider "scaleway" {
  region = "${var.region}"
}

data "scaleway_bootscript" "debian" {
  architecture = "x86_64"
  name = "x86_64 mainline 4.15.11 rev1"
}

data "scaleway_image" "debian_stretch" {
  architecture = "x86_64"
  name         = "Debian Stretch"
}

data "template_file" "docker_conf" {
  template = "${file("conf/docker.tpl")}"

  vars {
    ip = "${var.docker_api_ip}"
  }
}

The outputs.tf

1
2
3
4
5
6
7
8
9
10
11
12
13
14
15
16
17
18
19
output "swarm_manager_public_ip" {
  value = "${scaleway_ip.swarm_manager_ip.0.ip}"
}

output "swarm_manager_private_ip" {
  value = "${scaleway_server.swarm_manager.0.private_ip}"
}

output "swarm_workers_public_ip" {
  value = "${concat(scaleway_server.swarm_worker.*.name, scaleway_server.swarm_worker.*.public_ip)}"
}

output "swarm_workers_private_ip" {
  value = "${concat(scaleway_server.swarm_worker.*.name, scaleway_server.swarm_worker.*.private_ip)}"
}

output "workspace" {
  value = "${terraform.workspace}"
}

Our security-groups.tf

1
2
3
4
5
6
7
8
9
10
11
12
13
14
15
16
17
18
19
20
21
22
23
24
25
26
27
28
29
30
31
32
33
34
35
36
37
38
39
40
41
42
43
44
45
46
47
48
49
resource "scaleway_security_group" "swarm_managers" {
  name        = "swarm_managers"
  description = "Allow HTTP/S and SSH traffic"
}

resource "scaleway_security_group_rule" "ssh_accept" {
  security_group = "${scaleway_security_group.swarm_managers.id}"

  action    = "accept"
  direction = "inbound"
  ip_range  = "0.0.0.0/0"
  protocol  = "TCP"
  port      = 22
}

resource "scaleway_security_group_rule" "http_accept" {
  security_group = "${scaleway_security_group.swarm_managers.id}"

  action    = "accept"
  direction = "inbound"
  ip_range  = "0.0.0.0/0"
  protocol  = "TCP"
  port      = 80
}

resource "scaleway_security_group_rule" "https_accept" {
  security_group = "${scaleway_security_group.swarm_managers.id}"

  action    = "accept"
  direction = "inbound"
  ip_range  = "0.0.0.0/0"
  protocol  = "TCP"
  port      = 443
}

resource "scaleway_security_group" "swarm_workers" {
  name        = "swarm_workers"
  description = "Allow SSH traffic"
}

resource "scaleway_security_group_rule" "ssh_accept_workers" {
  security_group = "${scaleway_security_group.swarm_workers.id}"

  action    = "accept"
  direction = "inbound"
  ip_range  = "0.0.0.0/0"
  protocol  = "TCP"
  port      = 22
}

Our variables.tf

1
2
3
4
5
6
7
8
9
10
11
12
13
14
15
16
17
18
19
20
21
22
23
variable "docker_version" {
  default = "18.06.3~ce~3-0~debian"
}

variable "region" {
  default = "ams1"
}

variable "manager_instance_type" {
  default = "START1-M"
}

variable "worker_instance_type" {
  default = "START1-M"
}

variable "worker_instance_count" {
  default = 2
}

variable "docker_api_ip" {
  default = "127.0.0.1"
}

Our managers.tf

1
2
3
4
5
6
7
8
9
10
11
12
13
14
15
16
17
18
19
20
21
22
23
24
25
26
27
28
29
30
31
32
33
34
35
36
37
38
39
40
41
42
43
44
45
46
47
48
49
50
51
52
53
54
55
56
57
58
59
resource "scaleway_ip" "swarm_manager_ip" {
  count = 1
}

resource "scaleway_server" "swarm_manager" {
  count          = 1
  name           = "${terraform.workspace}-manager-${count.index + 1}"
  image          = "${data.scaleway_image.debian_stretch.id}"
  type           = "${var.manager_instance_type}"
  bootscript     = "${data.scaleway_bootscript.debian.id}"
  security_group = "${scaleway_security_group.swarm_managers.id}"
  public_ip      = "${element(scaleway_ip.swarm_manager_ip.*.ip, count.index)}"

  volume {
    size_in_gb = 50
    type       = "l_ssd"
  }

  provisioner "remote-exec" {
    script = "scripts/mount-disk.sh"
  }

  connection {
    type = "ssh"
    user = "root"
    private_key = "${file("~/.ssh/id_rsa")}"
  }

  provisioner "remote-exec" {
    inline = [
      "mkdir -p /etc/systemd/system/docker.service.d",
    ]
  }

  provisioner "file" {
    content     = "${data.template_file.docker_conf.rendered}"
    destination = "/etc/systemd/system/docker.service.d/docker.conf"
  }

  provisioner "file" {
    source      = "scripts/install-docker-ce.sh"
    destination = "/tmp/install-docker-ce.sh"
  }

  provisioner "file" {
    source      = "scripts/local-persist-plugin.sh"
    destination = "/tmp/local-persist-plugin.sh"
  }

  provisioner "remote-exec" {
    inline = [
      "chmod +x /tmp/install-docker-ce.sh",
      "/tmp/install-docker-ce.sh ${var.docker_version}",
      "docker swarm init --advertise-addr ${self.private_ip}",
      "chmod +x /tmp/local-persist-plugin.sh",
      "/tmp/local-persist-plugin.sh"
    ]
  }
}

Our workers.tf

1
2
3
4
5
6
7
8
9
10
11
12
13
14
15
16
17
18
19
20
21
22
23
24
25
26
27
28
29
30
31
32
33
34
35
36
37
38
39
40
41
42
43
44
45
46
47
48
49
50
51
52
53
54
55
56
57
58
59
60
61
62
63
64
65
66
67
68
69
70
71
72
73
74
75
76
77
78
79
80
81
82
83
84
85
86
87
88
89
90
91
92
93
94
95
96
97
98
99
100
101
102
103
104
105
106
107
108
109
110
111
resource "scaleway_ip" "swarm_worker_ip" {
  count = "${var.worker_instance_count}"
}

resource "scaleway_server" "swarm_worker" {
  count          = "${var.worker_instance_count}"
  name           = "${terraform.workspace}-worker-${count.index + 1}"
  image          = "${data.scaleway_image.debian_stretch.id}"
  type           = "${var.worker_instance_type}"
  bootscript     = "${data.scaleway_bootscript.debian.id}"
  security_group = "${scaleway_security_group.swarm_workers.id}"
  public_ip      = "${element(scaleway_ip.swarm_worker_ip.*.ip, count.index)}"

  volume {
    size_in_gb = 50
    type       = "l_ssd"
  }

  provisioner "remote-exec" {
    script = "scripts/mount-disk.sh"
  }

  connection {
    type = "ssh"
    user = "root"
    private_key = "${file("~/.ssh/id_rsa")}"
  }

  provisioner "remote-exec" {
    inline = [
      "mkdir -p /etc/systemd/system/docker.service.d",
    ]
  }

  provisioner "file" {
    content     = "${data.template_file.docker_conf.rendered}"
    destination = "/etc/systemd/system/docker.service.d/docker.conf"
  }

  provisioner "file" {
    source      = "scripts/install-docker-ce.sh"
    destination = "/tmp/install-docker-ce.sh"
  }

  provisioner "file" {
    source      = "scripts/local-persist-plugin.sh"
    destination = "/tmp/local-persist-plugin.sh"
  }

  provisioner "remote-exec" {
    inline = [
      "chmod +x /tmp/install-docker-ce.sh",
      "/tmp/install-docker-ce.sh ${var.docker_version}",
      "docker swarm join --token ${data.external.swarm_tokens.result.worker} ${scaleway_server.swarm_manager.0.private_ip}:2377",
      "chmod +x /tmp/local-persist-plugin.sh",
      "/tmp/local-persist-plugin.sh",
    ]
  }

  provisioner "remote-exec" {
    when = "destroy"

    inline = [
      "docker node update --availability drain ${self.name}",
    ]

    on_failure = "continue"

    connection {
      type = "ssh"
      user = "root"
      host = "${scaleway_ip.swarm_manager_ip.0.ip}"
    }
  }

  provisioner "remote-exec" {
    when = "destroy"

    inline = [
      "docker swarm leave",
    ]

    on_failure = "continue"
  }

  provisioner "remote-exec" {
    when = "destroy"

    inline = [
      "docker node rm --force ${self.name}",
    ]

    on_failure = "continue"

    connection {
      type = "ssh"
      user = "root"
      host = "${scaleway_ip.swarm_manager_ip.0.ip}"
    }
  }
}

data "external" "swarm_tokens" {
  program = ["./scripts/fetch-tokens.sh"]

  query = {
    host = "${scaleway_ip.swarm_manager_ip.0.ip}"
  }

  depends_on = ["scaleway_server.swarm_manager"]
}

Our config for the docker daemon: conf/docker.tpl

1
2
3
4
5
6
7
8
9
10
[Service]
ExecStart=
ExecStart=/usr/bin/dockerd -H fd:// \
  -H tcp://${ip}:2375 \
  --storage-driver=overlay2 \
  --dns 8.8.4.4 --dns 8.8.8.8 \
  --log-driver json-file \
  --log-opt max-size=50m --log-opt max-file=10 \
  --experimental=true \
  --metrics-addr 172.17.0.1:9323

Our script to mount our additional disk: scripts/mount-disk.sh

1
2
3
4
5
6
#!/bin/bash
apt update
apt install xfsprogs attr -y
mkfs -t xfs /dev/vdb
echo "/dev/vdb /mnt xfs defaults 0 0" >> /etc/fstab
mount -a

Our script to install docker: scripts/install-docker-ce.sh

1
2
3
4
5
6
7
8
9
10
#!/usr/bin/env bash

DOCKER_VERSION=$1
DEBIAN_FRONTEND=noninteractive apt-get -qq update
apt-get -qq install apt-transport-https ca-certificates curl software-properties-common
curl -fsSL https://download.docker.com/linux/debian/gpg | sudo apt-key add -
add-apt-repository "deb [arch=amd64] https://download.docker.com/linux/debian $(lsb_release -cs) stable"

apt-get -q update -y
apt-get -q install -y docker-ce=$DOCKER_VERSION containerd.io

Our script that retrieves the swarm tokens: scripts/fetch-tokens.sh

1
2
3
4
5
6
7
8
9
10
11
12
13
14
15
#!/usr/bin/env bash

# Processing JSON in shell scripts
# https://www.terraform.io/docs/providers/external/data_source.html#processing-json-in-shell-scripts

set -e

# Extract "host" argument from the input into HOST shell variable
eval "$(jq -r '@sh "HOST=\(.host)"')"

MANAGER=$(ssh -o StrictHostKeyChecking=no -o UserKnownHostsFile=/dev/null root@$HOST docker swarm join-token manager -q)
WORKER=$(ssh -o StrictHostKeyChecking=no -o UserKnownHostsFile=/dev/null root@$HOST docker swarm join-token worker -q)

# produce a json object containing the tokens
jq -n --arg manager "$MANAGER" --arg worker "$WORKER" '{"manager":$manager,"worker":$worker}'

Our script to install the local-persist docker volume plugin: scripts/local-persist-plugin.sh

1
2
3
#!/usr/bin/env bash
set -e
curl -fsSL https://raw.githubusercontent.com/CWSpear/local-persist/master/scripts/install.sh | bash

Deploy your Swarm

Note that we will be deploying 3x SMART1-M servers with Debian Stretch. At this moment the image id is the one of debian stretch but may change in the future. If you want to change the distro, update the install script, and the terraform files.

Generate API Token on Scaleway then export it to your current shell:

1
2
export SCALEWAY_ORGANIZATION="<organization-id>"
export SCALEWAY_TOKEN="<secret>"

Make sure that your ssh private key is the intended one as in the config, in my example: ~/.ssh/id_rsa and that they are allowed in your servers authorized_keys file

Create a new workspace:

1
$ terraform new workspace swarm

Pull down the providers and initialize:

1
$ terraform init

Deploy!

1
2
3
4
5
6
7
8
9
10
11
12
13
14
15
16
17
18
19
20
21
22
23
$ terraform apply
...
...
scaleway_server.swarm_worker[0]: Creation complete after 4m55s (ID: xx-xx-xx-xx-xx)

Apply complete! Resources: 14 added, 0 changed, 0 destroyed.
Outputs:

swarm_manager_private_ip = 10.21.x.x
swarm_manager_public_ip = 51.xx.xx.xx
swarm_workers_private_ip = [
    swarm-worker-1,
    swarm-worker-2,
    10.20.xx.xx,
    10.20.xx.xx,
]
swarm_workers_public_ip = [
    swarm-worker-1,
    swarm-worker-2,
    51.xx.xx.xx,
    51.xx.xx.xx,
]
workspace = swarm

Once your deployment is done you will be prompted with the public/private ip addresses of your nodes as seen above, you can also manually retrieve them:

1
$ terraform terraform output

Or for a specific node, such as the manager:

1
2
$ terraform terraform output swarm-manager
51.xx.xx.xx

Go ahead and ssh to your manager nodes and list the swarm nodes, boom, easy right.

1
2
3
4
5
$ docker node ls
ID                            HOSTNAME            STATUS              AVAILABILITY        MANAGER STATUS      ENGINE VERSION
2696o0vrt93x8qf2gblbfc8pf *   swarm-manager       Ready               Active              Leader              18.09.3
72ava7rrp2acnyadisg52n7ym     swarm-worker-1      Ready               Active                                  18.09.3
sy2otqn20qe9jc2v9io3a21jm     swarm-worker-2      Ready               Active                                  18.09.3

When you want to destroy the environment:

1
$ terraform destroy -force

References:

Big thanks goes to @stefanprodan

Deploy Scaleway Servers via the API in Python

A quick post on how to deploy Scaleway Servers via their API using Python.

API Documentation

Scaleway has great API Documentation available, so for deeper info have a look at the link provided.

Python

Our python script has a function create_server that expects a server name, server size, the tag and the linux distribution:

1
2
3
4
5
6
7
8
9
10
11
12
13
14
15
16
17
18
19
20
21
22
23
24
25
26
27
28
29
30
31
32
33
34
35
36
37
38
39
40
41
42
43
44
45
46
47
48
49
50
51
52
53
54
55
56
57
58
59
60
61
import requests
import json
import time

SCW_API_KEY = "<your-api-key>"
SCW_OGRA_ID = "<your-organization-id>"
SCW_REGION = "ams1"
SCW_COMPUTE_API_URL = "https://cp-{region}.scaleway.com/{resource}".format(region=SCW_REGION, resource='servers')
SCW_VOLUME_API_URL = "https://cp-{region}.scaleway.com/{resource}".format(region=SCW_REGION, resource='volumes')
SCW_HEADERS = {"X-Auth-Token": SCW_API_KEY, "Content-Type": "application/json"}
SCW_IMAGES = {"ubuntu/18": "6a601340-19c1-4ca7-9c1c-0704bcc9f5fe", "debian/stretch": "710ff1fa-0d16-4f8f-93ac-0647c44fa21d"}

def get_status(server_id):
  response = requests.get(SCW_COMPUTE_API_URL + "/" + server_id, headers=SCW_HEADERS)
  state = response.json()
  return state

def create_server(instance_name, instance_type, instance_tag, os_distro):
  count = 0
  compute_payload = {
      "name": instance_name,
      "image": SCW_IMAGES[os_distro],
      "commercial_type": instance_type,
      "tags": [instance_tag],
      "organization": SCW_OGRA_ID
  }

  print("creating server")
  r_create = requests.post(SCW_COMPUTE_API_URL, json=compute_payload, headers=SCW_HEADERS)
  server_id = r_create.json()["server"]["id"]
  action_payload = {"action": "poweron"}
  r_start = requests.post(SCW_COMPUTE_API_URL + "/" + server_id + "/action", json=action_payload, headers=SCW_HEADERS)
  r_describe = requests.get(SCW_COMPUTE_API_URL + "/" + server_id, headers=SCW_HEADERS)

  server_state = get_status(server_id)['server']['state']
  while server_state != "running":

    if count > 90:
      r_delete = requests.delete(SCW_COMPUTE_API_URL + "/" + server_id, json=action_payload, headers=SCW_HEADERS)
      return {"message": "error", "description": "task timed out while waiting for server to boot"}

    count += 1
    print("waiting for server to become ready")
    time.sleep(10)
    server_state = get_status(server_id)['server']['state']

  time.sleep(5)
  resp = get_status(server_id)["server"]
  output = {
      "id": resp["id"],
      "hostname": resp["hostname"],
      "instance_type": resp["commercial_type"],
      "public_ip": resp["public_ip"]["address"],
      "private_ip": resp["private_ip"],
      "status": resp["state"]
  }
  return output


response = create_server("swarm-manager", "START1-M", "swarm", "ubuntu/18")
print(response)

Deploying a server with the hostname: swarm-manager, instance-size: START1-M, tag: swarm and os distribution: ubuntu/18:

1
2
3
4
5
6
$ python scw.py
creating server
waiting for server to become ready
{'status': u'running', 'hostname': u'swarm-manager', 'public_ip': u'51.x.x.x', 'instance_type': u'START1-M', 'private_ip': u'10.x.x.x', 'id': u'xx-xx-xx-xx-xx'

For more info on Scaleway please do check them out: https://www.scaleway.com}

Setup NRPE Client and Server for Monitoring Remote Services in Nagios

If you have not setup the Nagios Server have a look at that link to setup the Nagios server.

Nagios NRPE

Nagios Remote Plugin Executor (NRPE) allows you to remotely execute Nagios plugins on other linux systems. This allows you to monitor remote machine metrics (disk usage, CPU, local listening services, etc.).

NRPE has 2 sections:

  • The nagios server side.
  • The client side.

For nagios to execute remote plugins, the client configuration needs to allow the nrpe server which will be nagios.

Download, extract, configure and install NRPE server:

1
2
3
4
5
6
7
8
9
$ wget 'https://github.com/NagiosEnterprises/nrpe/releases/download/nrpe-3.2.1/nrpe-3.2.1.tar.gz'
$ tar -xvf nrpe-3.2.1.tar.gz
$ cd nrpe-3.2.1
$ ./configure --enable-command-args --with-nagios-user=nagios --with-nagios-group=nagcmd --with-ssl=/usr/bin/openssl --with-ssl-lib=/usr/lib/x86_64-linux-gnu
$ make all
$ make install
$ make install-init
$ make install-config
$ systemctl enable nrpe.service

Installing NRPE on the client side:

1
2
3
$ apt update && apt install nagios-nrpe-server -y
$ systemctl enable nagios-nrpe-server
$ systemctl start nagios-nrpe-server

Allow your nagios server ip in /etc/nagios/nrpe.cfg:

1
allowed_hosts=nagios.ip.in.here

Restart NRPE on the client:

1
$ systemctl restart nagios-nrpe-server

Ensure that the check_nrpe plugin is configured and available in the commands.cfg configuration for the nagios server:

1
2
3
4
5
6
$ vi /usr/local/nagios/etc/objects/commands.cfg

define command {
    command_name check_nrpe
    command_line $USER1$/check_nrpe -H $HOSTADDRESS$ -c $ARG1$
}

Check this out how to create a python nrpe nagios plugin to check disk space on the client host

Monitor Your First Host and Services With Nagios

If you have not setup the Nagios Server have a look at that link to setup the Nagios server.

Configure Nagios to Monitor our first Host

I like to setup an isolated path for my custom host/service configigurations. First we will declare the configuration path for our servers.

Open up: /usr/local/nagios/etc/nagios.cfg and add a new cfg_dir:

1
cfg_dir=/usr/local/nagios/etc/servers

Now, create the directory:

1
$ mkdir /usr/local/nagios/etc/servers

Configure your email address for notifications in /usr/local/nagios/etc/objects/contacts.cfg and configure:

1
email     youremail@yourdomain.com;

Let’s say we want to configure a web server named web01 that sits at the location 10.10.10.10:

1
$ vi /usr/local/nagios/etc/servers/webservers.cfg

First we define our host configuration:

  1. We are using the linux-server template that is defined in /usr/local/nagios/etc/objects/templates.cfg
  2. We set the hostname, alias and address as well as notification prediods
1
2
3
4
5
6
7
8
9
10
define host {
    use                      linux-server
    host_name                WEB01
    alias                    WEB01
    address                  10.10.10.10
    max_check_attempts       5
    check_period             24x7
    notification_interval    30
    notification_period      24x7
}

While you have the config open, we want to define the services that we would like to monitor, and associate the services to the host that we defined.

In this example, we want to ping the server and check port tcp 22 and 80. Ensure that your web server is allowing the mentioned ports from the nagios server ip.

In the config, we are declaring the following:

  1. Use the generic-service template
  2. Map the hostname which the service should be associated to
  3. The description that you will see in nagios
  4. Use the check_ping / check_ssh / check_http plugin and set the thresholds for ok, warning, critical
1
2
3
4
5
6
7
8
9
10
11
12
13
14
15
16
17
18
19
20
21
22
define service {
    use                    generic-service
    host_name              WEB01
    service_description    PING
    check_command          check_ping!100.0,20%!500.0,60%
}

define service {
    use                      generic-service
    host_name                WEB01
    service_description      SSH
    check_command            check_ssh
    notifications_enabled    1
}

define service {
    use                      generic-service
    host_name                WEB01
    service_description      HTTP
    check_command            check_http
    notifications_enabled    1
}

Save the config, test the config:

1
$ /usr/local/nagios/bin/nagios -v /usr/local/nagios/etc/nagios

If you don’t see any errors, go ahead and restart to apply the configs:

1
2
$ systemctl restart nagios
$ systemctl restart apache2

Head over to nagios user interface at http://nagios-ip/nagios and you should see that the services are scheduled to be checked and should be reflecting in a minute or two.

Up Next

Next up, Setup the NRPE Server and Client to monitor remote systems using the nrpe plugin.

How to Setup the NagiosGraph Plugin on Nagios Monitoring Server

If you have not setup the Nagios Server have a look at that link to setup the Nagios server.

NagiosGraph

In this post we will setup the nagiosgraph plugin to graph performance data of our monitored host and services.

Download and Install

Download the nagiosgraph plugin and extract:

1
2
$ wget 'https://downloads.sourceforge.net/project/nagiosgraph/nagiosgraph/1.5.2/nagiosgraph-1.5.2.tar.gz' -O nagiosgraph-1.5.2.tar.gz
$ tar -xvf nagiosgraph-1.5.2.tar.gz

Install dependencies and install the nagiosgraph plugin:

1
2
3
4
5
6
7
8
9
10
11
12
13
14
15
16
17
18
19
20
21
22
23
24
25
26
27
28
29
30
31
$ apt install libnet-snmp-perl libsensors4 libsnmp-base libtalloc2 libtdb1 libwbclient0  snmp whois mrtg  libcgi-pm-perl librrds-perl libgd-perl libnagios-object-perl nagios-plugins-contrib
$ ./install.pl --check-prereq
$ ./install.pl --layout standalone --prefix /usr/local/nagiosgraph


Destination directory (prefix)? [/usr/local/nagiosgraph]
Location of configuration files (etc-dir)? [/usr/local/nagiosgraph/etc]
Location of executables? [/usr/local/nagiosgraph/bin]
Location of CGI scripts? [/usr/local/nagiosgraph/cgi]
Location of documentation (doc-dir)? [/usr/local/nagiosgraph/doc]
Location of examples? [/usr/local/nagiosgraph/examples]
Location of CSS and JavaScript files? [/usr/local/nagiosgraph/share]
Location of utilities? [/usr/local/nagiosgraph/util]
Location of state files (var-dir)? [/usr/local/nagiosgraph/var]
Location of RRD files? [/usr/local/nagiosgraph/var/rrd]
Location of log files (log-dir)? [/usr/local/nagiosgraph/var/log]
Path of log file? [/usr/local/nagiosgraph/var/log/nagiosgraph.log]
Path of CGI log file? [/usr/local/nagiosgraph/var/log/nagiosgraph-cgi.log]
Base URL? [/nagiosgraph]
URL of CGI scripts? [/nagiosgraph/cgi-bin]
URL of CSS file? [/nagiosgraph/nagiosgraph.css]
URL of JavaScript file? [/nagiosgraph/nagiosgraph.js]
URL of Nagios CGI scripts? [/nagios/cgi-bin]
Path of Nagios performance data file? [/tmp/perfdata.log]
username or userid of Nagios user? [nagios]
username or userid of web server user? [www-data]
Modify the Nagios configuration? [n] y
Path of Nagios configuration file? [/usr/local/nagios/etc/nagios.cfg]
Path of Nagios commands file? [/usr/local/nagios/etc/objects/commands.cfg]
Modify the Apache configuration? [n] y
Path of Apache configuration directory? /etc/apache2/sites-enabled

Ensure that your nagiosgraph configuration under apache: /etc/apache2/sites-enabled/nagiosgraph.conf has the following config (might be standard)

Ensure the following configuration is set under nagios main config:

1
2
3
4
5
6
7
8
$ vi /usr/local/nagios/etc/nagios.cfg

process_performance_data=1 
service_perfdata_file=/usr/local/nagios/var/service-perfdata.log 
service_perfdata_file_template=$LASTSERVICECHECK$||$HOSTNAME$||$SERVICEDESC$||$SERVICEOUTPUT$||$SERVICEPERFDATA$ 
service_perfdata_file_mode=a 
service_perfdata_file_processing_interval=30 
service_perfdata_file_processing_command=process-service-perfdata-for-nagiosgraph

Ensure that we have the following commands in place for nagiosgraph:

1
2
3
4
5
6
$ vi /usr/local/nagios/etc/objects/commands.cfg

define command {
  command_name process-service-perfdata-for-nagiosgraph
  command_line /usr/local/nagiosgraph/bin/insert.pl
}

Create the template graphed-service, this will be mapped to each service that needs to be graphed in nagiosgraph:

1
2
3
4
5
6
7
$ vi /usr/local/nagios/etc/objects/templates.cfg

define service {
      name              graphed-service
      action_url        /nagiosgraph/cgi-bin/show.cgi?host=$HOSTNAME$&service=$SERVICEDESC$' onMouseOver='showGraphPopup(this)' onMouseOut='hideGraphPopup()' rel='/nagiosgraph/cgi-bin/showgraph.cgi?host=$HOSTNAME$&service=$SERVICEDESC$&period=week&rrdopts=-w+450+-j
      register        0
      }

Next configure the services that needs to be graphed on nagios graph. Note, we only need to append the service template that we defined in our template configuration from above:

Note, if you have not checked out Nagios Server Setup post, in that post the inital configuration of the below config is explained.

1
2
3
4
5
6
7
8
9
10
11
12
13
14
15
16
17
18
19
20
21
22
23
24
25
26
27
28
29
30
31
32
33
34
35
$ vi /usr/local/nagios/etc/servers/vpn.cfg

define host {
    use                      linux-server
    host_name                WEB01
    alias                    WEB01
    address                  10.10.10.10
    max_check_attempts       5
    check_period             24x7
    notification_interval    30
    notification_period      24x7
}

define service {
    use                    generic-service,graphed-service
    host_name              WEB01
    service_description    PING
    check_command          check_ping!100.0,20%!500.0,60%
}

define service {
    use                      generic-service,graphed-service
    host_name                WEB01
    service_description      SSH
    check_command            check_ssh
    notifications_enabled    1
}

define service {
    use                      generic-service,graphed-service
    host_name                WEB01
    service_description      HTTP
    check_command            check_http
    notifications_enabled    1
}

Test the nagios config and restart if there are no warnings:

1
2
3
$ /usr/local/nagios/bin/nagios -v /usr/local/nagios/etc/nagios.cfg
$ systemctl restart nagios
$ systemctl restart apache2

Access your nagios server at http://nagios-ip/nagios and you will find that the graph icon next to the service will open the graph in a new tab, like the screenshot below:

Up Next

Next, Monitor your first Server with Nagios

How to Setup a Nagios Monitoring Server

Good old nagios! Nagios is a great Open Source Monitoring Server that monitors your servers and services/applications that is hosted on top of them, and has the ability to notify in the event when they go down.

I’ve been using Nagios for the last 7 years and worked for 3 business that chose Nagios as their preferred server monitoring solution.

All Nagios related posts are grouped under the #nagios category.

What we are doing today

Today we will setup a Nagios server and its plugins. The plugins helps to check different endpoints, such as custom tcp checks, ssh, snmp etc.

In this nagios tutorial series, I will publish a couple of post which will include:

  • Setup the Nagios Server and its Plugins - this post
  • Setup the NRPE Server and NRPE Client Server (this is nice for local ports or custom checks)
  • Setup Nagiosgraph (Graph performance data and add it as extra host configuration)
  • Setup a custom Bash and Python Nagios Plugin for Custom Checks
  • Setup a Telegram / Slack Plugin

Installing Dependencies:

Go ahead and install all the dependencies needed by nagios and add the nagios user and group:

1
2
3
4
5
6
7
8
$ apt update
$ apt install build-essential libgd-dev openssl libssl-dev unzip apache2 -y
$ apt install autoconf gcc libc6 make wget unzip apache2 php libapache2-mod-php7.2 libgd-dev
$ apt install libmcrypt-dev libssl-dev bc gawk dc build-essential libnet-snmp-perl gettext
$ apt install libcarp-clan-perl rrdtool php-rrd libssl1.0-dev
$ useradd nagios
$ groupadd nagcmd
$ usermod -a -G nagcmd nagios

Install Nagios

Download the nagios tarball from their website, have a look at https://www.nagios.org/downloads/ for the latest version.

1
$ wget -O nagios.tar.gz 'https://assets.nagios.com/downloads/nagioscore/releases/nagios-4.4.3.tar.gz?__hstc=118811158.7bdae752f04b6d927ddf150ae1ce5c71.1552389135285.1552394646569.1552410974898.3&__hssc=118811158.1.1552410974898&__hsfp=2323916385#_ga=2.246938692.1332751653.1552389134-913645931.1552389134'

Extract the archive:

1
2
$ tar xpf nagios*.tar.gz
$ cd nagios-4.4.3/

Configure with nagios user and nagcmd group, install and change the ownership of the generated data:

1
2
3
4
5
6
7
8
$ ./configure --with-nagios-group=nagios --with-command-group=nagcmd
$ make -j4 all
$ make install
$ make install-commandmode
$ make install-init
$ make install-config
$ /usr/bin/install -c -m 644 sample-config/httpd.conf /etc/apache2/sites-available/nagios.conf
$ usermod -a -G nagcmd www-data

Install Nagios Plugins

Get the nagios plugins tarball, extract and install:

1
2
3
4
5
6
$ wget nagios-plugins.tar.gz 'https://nagios-plugins.org/download/nagios-plugins-2.2.1.tar.gz#_ga=2.250909126.1332751653.1552389134-913645931.1552389134'
$ tar xpf nagios-plugins*.tar.gz
$ cd nagios-plugins-2.2.1
$ ./configure --with-nagios-user=nagios --with-nagios-group=nagcmd --with-openssl
$ make -j4
$ make install

Access Nagios

Enable apache modules:

1
2
$ a2enmod rewrite
$ a2enmod cgi

Setup basic auth for logging onto nagios:

1
$ htpasswd -c /usr/local/nagios/etc/htpasswd.users nagiosadmin

Setup a symlink for apache’s nagios configuration

The configuration for the above will look more or less like the following:

1
2
3
4
5
6
7
8
9
$ cat /etc/apache2/sites-enabled/nagios.conf

...
         Require all granted
         AuthName "Nagios Access"
         AuthType Basic
         AuthUserFile /usr/local/nagios/etc/htpasswd.users
         Require valid-user
...

Create the systemd unit file for nagios /etc/systemd/system/nagios.service

1
2
3
4
5
6
7
8
9
10
11
12
[Unit]
Description=Nagios
BindTo=network.target

[Install]
WantedBy=multi-user.target

[Service]
Type=simple
User=nagios
Group=nagcmd
ExecStart=/usr/local/nagios/bin/nagios /usr/local/nagios/etc/nagios.cfg

Reload the daemon:

1
$ systemctl daemon-reload

Enable the service:

1
$ systemctl enable /etc/systemd/system/nagios.service

Ensure nagios is started:

1
2
$ systemctl restart nagios
$ systemctl restart apache2

Access nagios on http://nagios-ip/nagios with the credentials that you configured earlier.

Up Next

In the next posts I will cover the following:

  1. Setup NagiosGraph for monitoring performance data
  2. Show you how to create a custom nagios plugin in python
  3. Create a Custom Notification service to send notifications to Telegram (or any API)

Setup a Reverse Proxy on Nginx for Your Backend Applications

Nginx is a great product! And today we will use nginx to setup a http reverse proxy to access our backend applications.

Our Setup

We will have a flask backend application listening on 127.0.0.1:5000 and our nginx reverse proxy will listen on 0.0.0.0:80 which will proxy requests through to our flask upstream.

Our Backend Application

Our Flask application:

1
2
3
4
5
6
7
8
9
from flask import Flask
app = Flask(__name__)

@app.route('/')
def index():
    return 'Hello'

if __name__ == '__main__':
    app.run(host='127.0.0.1', port=5000)

Nginx

Install nginx:

1
$ apt install nginx -y

Our main nginx configuration:

1
2
3
4
5
6
7
8
9
10
11
12
13
14
15
16
17
18
19
20
21
22
23
24
25
26
27
28
29
# /etc/nginx/nginx.conf
user www-data;
worker_processes auto;
pid /run/nginx.pid;
include /etc/nginx/modules-enabled/*.conf;

events {
    worker_connections 768;
}

http {
    sendfile on;
    tcp_nopush on;
    tcp_nodelay on;
    keepalive_timeout 65;
    types_hash_max_size 2048;
    server_names_hash_bucket_size 64;

    include /etc/nginx/mime.types;
    default_type application/octet-stream;
    ssl_protocols TLSv1 TLSv1.1 TLSv1.2; # Dropping SSLv3, ref: POODLE
    ssl_prefer_server_ciphers on;
    access_log /var/log/nginx/access.log;
    error_log /var/log/nginx/error.log;
    gzip on;
    gzip_disable "msie6";

    include /etc/nginx/conf.d/backend-*.conf;
}

Our application’s configuration:

1
2
3
4
5
6
7
8
9
10
11
12
13
14
15
16
17
18
19
20
21
# /etc/nginx/conf.d/backend-flask.conf
upstream backend_flask {
    server 127.0.0.1:5000;
}

server {
    listen 80 default_server;
    listen [::]:80;
    server_name _;
  
    location / {
        include proxy_params;
        proxy_http_version 1.1;
        proxy_read_timeout 90;
        proxy_set_header X-Real-IP $remote_addr;
        proxy_set_header Upgrade $http_upgrade;
        proxy_set_header Connection "upgrade";
        proxy_pass http://backend_flask;
        proxy_buffering off;
    }
}

Restart nginx and enable nginx on boot:

1
2
$ systemctl restart nginx
$ systemctl enable nginx

Test your Application:

Access your server on port 80 and you should receive the response from your flask application:

1
2
$ curl http://nginx-public-ip:80/
Hello

Resoures

Create Users Databases and Granting Access for Users on PostgreSQL

Short tutorial on how to create databases on postgresql, creating users and granting permissions so that the users has access to the created database.

Create and Apply Permissions

Logon to postgresL

1
2
$ sudo -u postgres psql
psql=>

Create the database mydb:

1
psql=> create database mydb;

Create the user dba and assign a password:

1
psql=> create user concourse with encrypted password 'sekretpw';

Grant all privileges for the user on the database:

1
2
psql=> grant all privileges on database concourse1 to concourse;
psql=> \q

Allowing Remote Conenctions

If you want to allow remote connections, you would first need to change the config that the server listens on all interfaces:

1
2
# /etc/postgresql/10/main/postgresql.conf 
listen_addresses = '0.0.0.0'

We also the need to update the trust relationship, in this case we will only want one user to access one database from any source:

1
2
3
# /etc/postgresql/10/main/pg_hba.conf
# TYPE  DATABASE        USER            ADDRESS                 METHOD
hostnossl mydb        dba     0.0.0.0/0       trust

After the config is in place, restart the server:

1
$ /etc/init.d/postgresql restart

PostgreSQL Client

From a remote source, test the connection to your server:

1
2
3
4
5
6
$ psql --host postgres.example.com --username dba --dbname mydb --password
Password:
psql (11.1, server 10.5 (Ubuntu 10.5-1.pgdg16.04+1))
Type "help" for help.

mydb=>