Elasticsearch Index templates allow you to define templates that will automatically be applied on index creation time. The templates can include both settings and mappings..
What are we doing?
We want to create a template on how we would a target index to look like. It should consist of 1 primary shard and 2 replica shards and we want to update the mapping that we can make use of text and keyword string fields.
So then whenever we create an index which matches our template, the template will be applied on index creation.
String Fields
We will make use of the following string fields in our mappings which will be included in our templates:
Text:
A field to index full-text values, such as the body of an email or the description of a product. These fields are analyzed, that is they are passed through an analyzer to convert the string into a list of individual terms before being indexed. The analysis process allows Elasticsearch to search for individual words within each full text field
Keyword":
A field to index structured content such as email addresses, hostnames, status codes, zip codes or tags.
They are typically used for filtering (Find me all blog posts where status is published), for sorting, and for aggregations. Keyword fields are only searchable by their exact value
Note about templates:
Couple of things to keep in mind:
12
1. Templates gets referenced on index creation and does not affect existing indexes
2. When you update a template, you need to specify the exact template, the payload overwrites the whole template
View your current templates in your cluster:
1234
$ curl -XGET http://localhost:9200/_cat/templates?v
name                          index_patterns             order      version
.monitoring-kibana            [.monitoring-kibana-6-*]   0          6020099
filebeat-6.3.1                [filebeat-6.3.1-*]         1
Create the template foobar_docs which will match any indexes matching foo-* and bar-* which will inherit index settings of 1 primary shards and 2 replica shards and also apply a mapping template shown below:
$ curl -XGET http://localhost:9200/_cat/indices/test-2018.07.20?v
health status index           uuid                   pri rep docs.count docs.deleted store.size pri.store.size
green  open   test-2018.07.20 -5XOfl0GTEGeHycTwL51vQ   5   1          0            0        2kb          1.1kb
We can also inspect the template like shown below:
View our current index, as you can see the index is unaffected of the template change as only new indexes will retrieve the update of the template:
123
$ curl -XGET http://localhost:9200/_cat/indices/foo-2018.07.20?v
health status index          uuid                   pri rep docs.count docs.deleted store.size pri.store.size
yellow open   foo-2018.07.20 ol1pGugrQCKd0xES4R6oFg   1   2          2            0     20.4kb         10.2kb
Create a new index to verify that the template’s config is pulled into the new index:
View the elasticsearch indexes to verify the behavior:
1234
$ curl -XGET http://localhost:9200/_cat/indices/foo-2018.07.*?v
health status index              uuid                   pri rep docs.count docs.deleted store.size pri.store.size
yellow open   foo-2018.07.20     ol1pGugrQCKd0xES4R6oFg   1   2          2            0     20.4kb         10.2kb
green  open   foo-2018.07.20-new g6Ii8jtKRFa1zDVB2IsDBQ   2   1          0            0       920b           460b
At times you may find that the indexes in your cluster are not queried that often but you still want them around. But you also want to reduce the resource footprint by reducing the number of shards, and perhaps increase the refresh interval.
For refresh interval, if new data comes in and we dont care to have it available near real time, we can set the refresh interval for example to 60 seconds, so the index will only have the data available every 60 seconds. (default: 1s)
Reindexing Elasticsearch Indexes
In this example we will use the scenario where we have daily indexes with 5 primary shards and 1 set of replicas and we would like to create a weekly index with 1 primary shard, 1 replica and the refresh interval of 60 seconds, and reindex the previous weeks data into our weekly index.
Create the target weekly index with the mentioned configuration:
$ curl -s -XGET 'http://127.0.0.1:9200/_cat/indices/my-index-2019.01.01*?v'
health status index                    uuid                   pri rep docs.count docs.deleted store.size pri.store.size
green  open   my-index-2019.01.01      wbFEJCApSpSlbOXzb1Tjxw   5   1      22007            0      6.6mb          3.2mb
green  open   my-index-2019.01.02      cbDmJR7pbpRT3O2x46fj20   5   1      28031            0      7.2mb          3.4mb
..
green  open   my-index-2019.01.01-07   mJR7pJ9O4T3O9jzyI943ca   1   1          0            0       466b           233b
Create the reindex job, specify the source indexes and the destination index where the data must be reindexed to:
If the response is 0 then all the tasks completed and we can have a look at our index again:
123456
$ curl -s -XGET 'http://127.0.0.1:9200/_cat/indices/my-index-2019.01.0*?v'
health status index                    uuid                   pri rep docs.count docs.deleted store.size pri.store.size
green  open   my-index-2019.01.01      wbFEJCApSpSlbOXzb1Tjxw   5   1      22007            0      6.6mb          3.2mb
green  open   my-index-2019.01.02      cbDmJR7pbpRT3O2x46fj20   5   1      28031            0      7.2mb          3.4mb
..
green  open   my-index-2019.01.01-07   mJR7pJ9O4T3O9jzyI943ca   1   1     322007            0     45.9mb         22.9mb
Now that we can verify that the reindex tasks finished and we can see the aggregated result in our target index, we can delete our source indexes:
Resize your Elasticsearch Index with fewer Primary Shards by using the Shrink API.
In Elasticsearch, every index consists of multiple shards and every shard in your elasticsearch cluster contributes to the usage of your cpu, memory, file descriptors etc. This definitely helps for performance in parallel processing. As for an example with time series data, you would write and read a lot to an index with ie the current date.
If that index drops in requests and only read from the index every now and then, we dont need that many shards anymore and if we have multiple indexes, they may build up and take up unessacary compute power.
For a scenario where we want to reduce the size of our indexes, we can use the Shrink API to reduce the number of primary shards.
The Shrink API
The shrink index API allows you to shrink an existing index into a new index with fewer primary shards. The requested number of primary shards in the target index must be a factor of the number of shards in the source index. For example an index with 8 primary shards can be shrunk into 4, 2 or 1 primary shards or an index with 15 primary shards can be shrunk into 5, 3 or 1. If the number of shards in the index is a prime number it can only be shrunk into a single primary shard. Before shrinking, a (primary or replica) copy of every shard in the index must be present on the same node.
Steps on Shrinking:
Create the target index with the same definition as the source index, but with a smaller number of primary shards.
Then it hard-links segments from the source index into the target index.
Finally, it recovers the target index as though it were a closed index which had just been re-opened.
Reduce the Primary Shards of an Index.
As you may know, you can only set the Primary Shards on Index Creation time and Replica Shards you can set on the fly.
In this example we have a source index: my-index-2019.01.10 with 5 primary shards and 1 replica shard, which gives us 10 shards for that index, that we would like to shrink to an index named: archive_my-index-2019.01.10 with 1 primary shard and 1 replica shard, which will give us 2 shards for that index.
Have a look at your index:
12345
$ curl -XGET "http://127.0.0.1:9200/_cat/indices/my-index-2019.01.*?v"
health status index                                     uuid                   pri rep docs.count docs.deleted store.size pri.store.size
green  open   my-index-2019.01.10                       xAijUTSevXirdyTZTN3cuA   5   1   80795533            0      5.9gb          2.9gb
green  open   my-index-2019.01.11                       yb8Cjy9eQwqde8mJhR_vlw   5   5   80590481            0      5.7gb          2.8gb
...
And have a look at the nodes, as we will relocate the shards to a specific node:
1234
$ curl http://127.0.0.1:9200/_cat/nodes?v
ip            heap.percent ram.percent cpu load_1m load_5m load_15m node.role master name
x.x.x.x             8          98   0    0.04    0.03     0.01 m         -      3E9yp60
x.x.x.x            65          99   4    0.43    0.23     0.36 di        -      znFrs18
In this demonstration we only have 2 nodes with a replication factor of 1, which means a index’s shards will always reside on both nodes. In a case with more nodes, we need to ensure that we choose a node where a primary index reside on.
Look at the shards api, by passing the index name to get the index to shard allocation:
123456789101112
$ curl http://127.0.0.1:9200/_cat/shards/my-index-2019.01.10?v'
index               shard prirep state   docs  store ip       node
my-index-2019.01.10 2     p      STARTED  193  101mb x.x.x.x  Lq9P7eP
my-index-2019.01.10 2     r      STARTED  193  101mb x.x.x.x  F5edOwK
my-index-2019.01.10 4     p      STARTED  197  101mb x.x.x.x  Lq9P7eP
my-index-2019.01.10 4     r      STARTED  197  101mb x.x.x.x  F5edOwK
my-index-2019.01.10 3     r      STARTED  184  101mb x.x.x.x  Lq9P7eP
my-index-2019.01.10 3     p      STARTED  184  101mb x.x.x.x  F5edOwK
my-index-2019.01.10 1     r      STARTED  180  101mb x.x.x.x  Lq9P7eP
my-index-2019.01.10 1     p      STARTED  180  101mb x.x.x.x  F5edOwK
my-index-2019.01.10 0     p      STARTED  187  101mb x.x.x.x  Lq9P7eP
my-index-2019.01.10 0     r      STARTED  187  101mb x.x.x.x  F5edOwK
You can also pass aliases as your table columns for output:
1234
$ curl -s -XGET "http://127.0.0.1:9200/_cat/recovery/my-index-2019.01.10?v&detailed=true&h=index,shard,time,ty,st,shost,thost,f,fp,b,bp"
index                            shard time  ty   st   shost         thost        f  fp     b         bp
my-index-2019.01.10              0     23.3s peer done x.x.x.x x.x.x.x 15 100.0% 635836677 100.0%
...
When the job is done, have a look at your indexes:
1234
$ curl -XGET "http://127.0.0.1:9200/_cat/indices/*my-index-2019.01.10?v"
health status index                                     uuid                   pri rep docs.count docs.deleted store.size pri.store.size
green  open   archive_my-index-2019.01.10               PAijUTSeRvirdyTZTN3cuA   1   1   80795533            0      5.9gb          2.9gb
green  open   my-index-2019.01.10                       Cb8Cjy9CQwqde8mJhR_vlw   5   1   80795533            0      2.9gb          2.9gb
Remove the block on your old index in order to make it writable:
Note:, On AWS Elasticsearch Service, if you dont remove the block and you trigger a redeployment, you will end up with something like this. Shard may still be constraint to a node.
Both gitea and drone is built on golang runs on multiple platforms including a raspberry pi and its super lightweight. Oh yes, and its awesome!
In this tutorial we will see how we can implement our own git service and cicd platform by setting up gitea and drone on docker and commit a python flask application to gitea and build a pipeline on drone.
Some definition
Gitea: will be your self hosted git server
Drone Server: will be server being responsible for the web service, repositories, secrets, users, etc.
Drone Agent: will be the workers that runs your builds, jobs etc.
Server Confguration
We will change our host’s ssh port to something else as our git server’s ssh method will be listening on port 22 and we would like to add our ssh key to gitea so that we can commit to our git server via ssh.
Change your server’s ssh port to 2222, by opening /etc/ssh/sshd_config and edit the port to 2222 then restart sshd with:
1
$ /etc/init.d/sshd restart
Your ssh connection will still be established, but you can exit and ssh to your server by specifying the new port:
Below is the docker-compose file for our deployment. Note that we are running a postgres database which gitea will be configured on, you can also use other databases like mysql, sqlite etc. Visit their documentation for more info.
Our SSH_DOMAIN will be the domain that gets used for things like cloning a repository. When you register your gitea account, you will use the same credentials to logon to drone.
Deploy your stack:
1
$ docker-compose up -d
Register on Gitea
When your deployment is done, access your gitea server which should be available on http://your-docker-ip:3000/ complete the registration, if you decide to go with postgres your username/password will be postgres and your host will be gitea-db:5432.
Make sure to complete the administrator account to get your admin credentials.
Setup SSH Key and Repo
Generate a ssh key that you will use for communicating to git over ssh. If you have already have an ssh key you can skip this step.
12
$ ssh-keygen -t rsa
# use the defaults
Login on gitea, once you are logged in, head over to profile / settings / ssh keys: http://your-docker-ip:3000/user/settings/keys.
Add a new ssh key, go back to your terminal and copy the public key which we will provide to gitea:
12
$ cat ~/.ssh/id_rsa.pub
<copy the contents to your clipboard>
Paste your public key and provide a descriptive title.
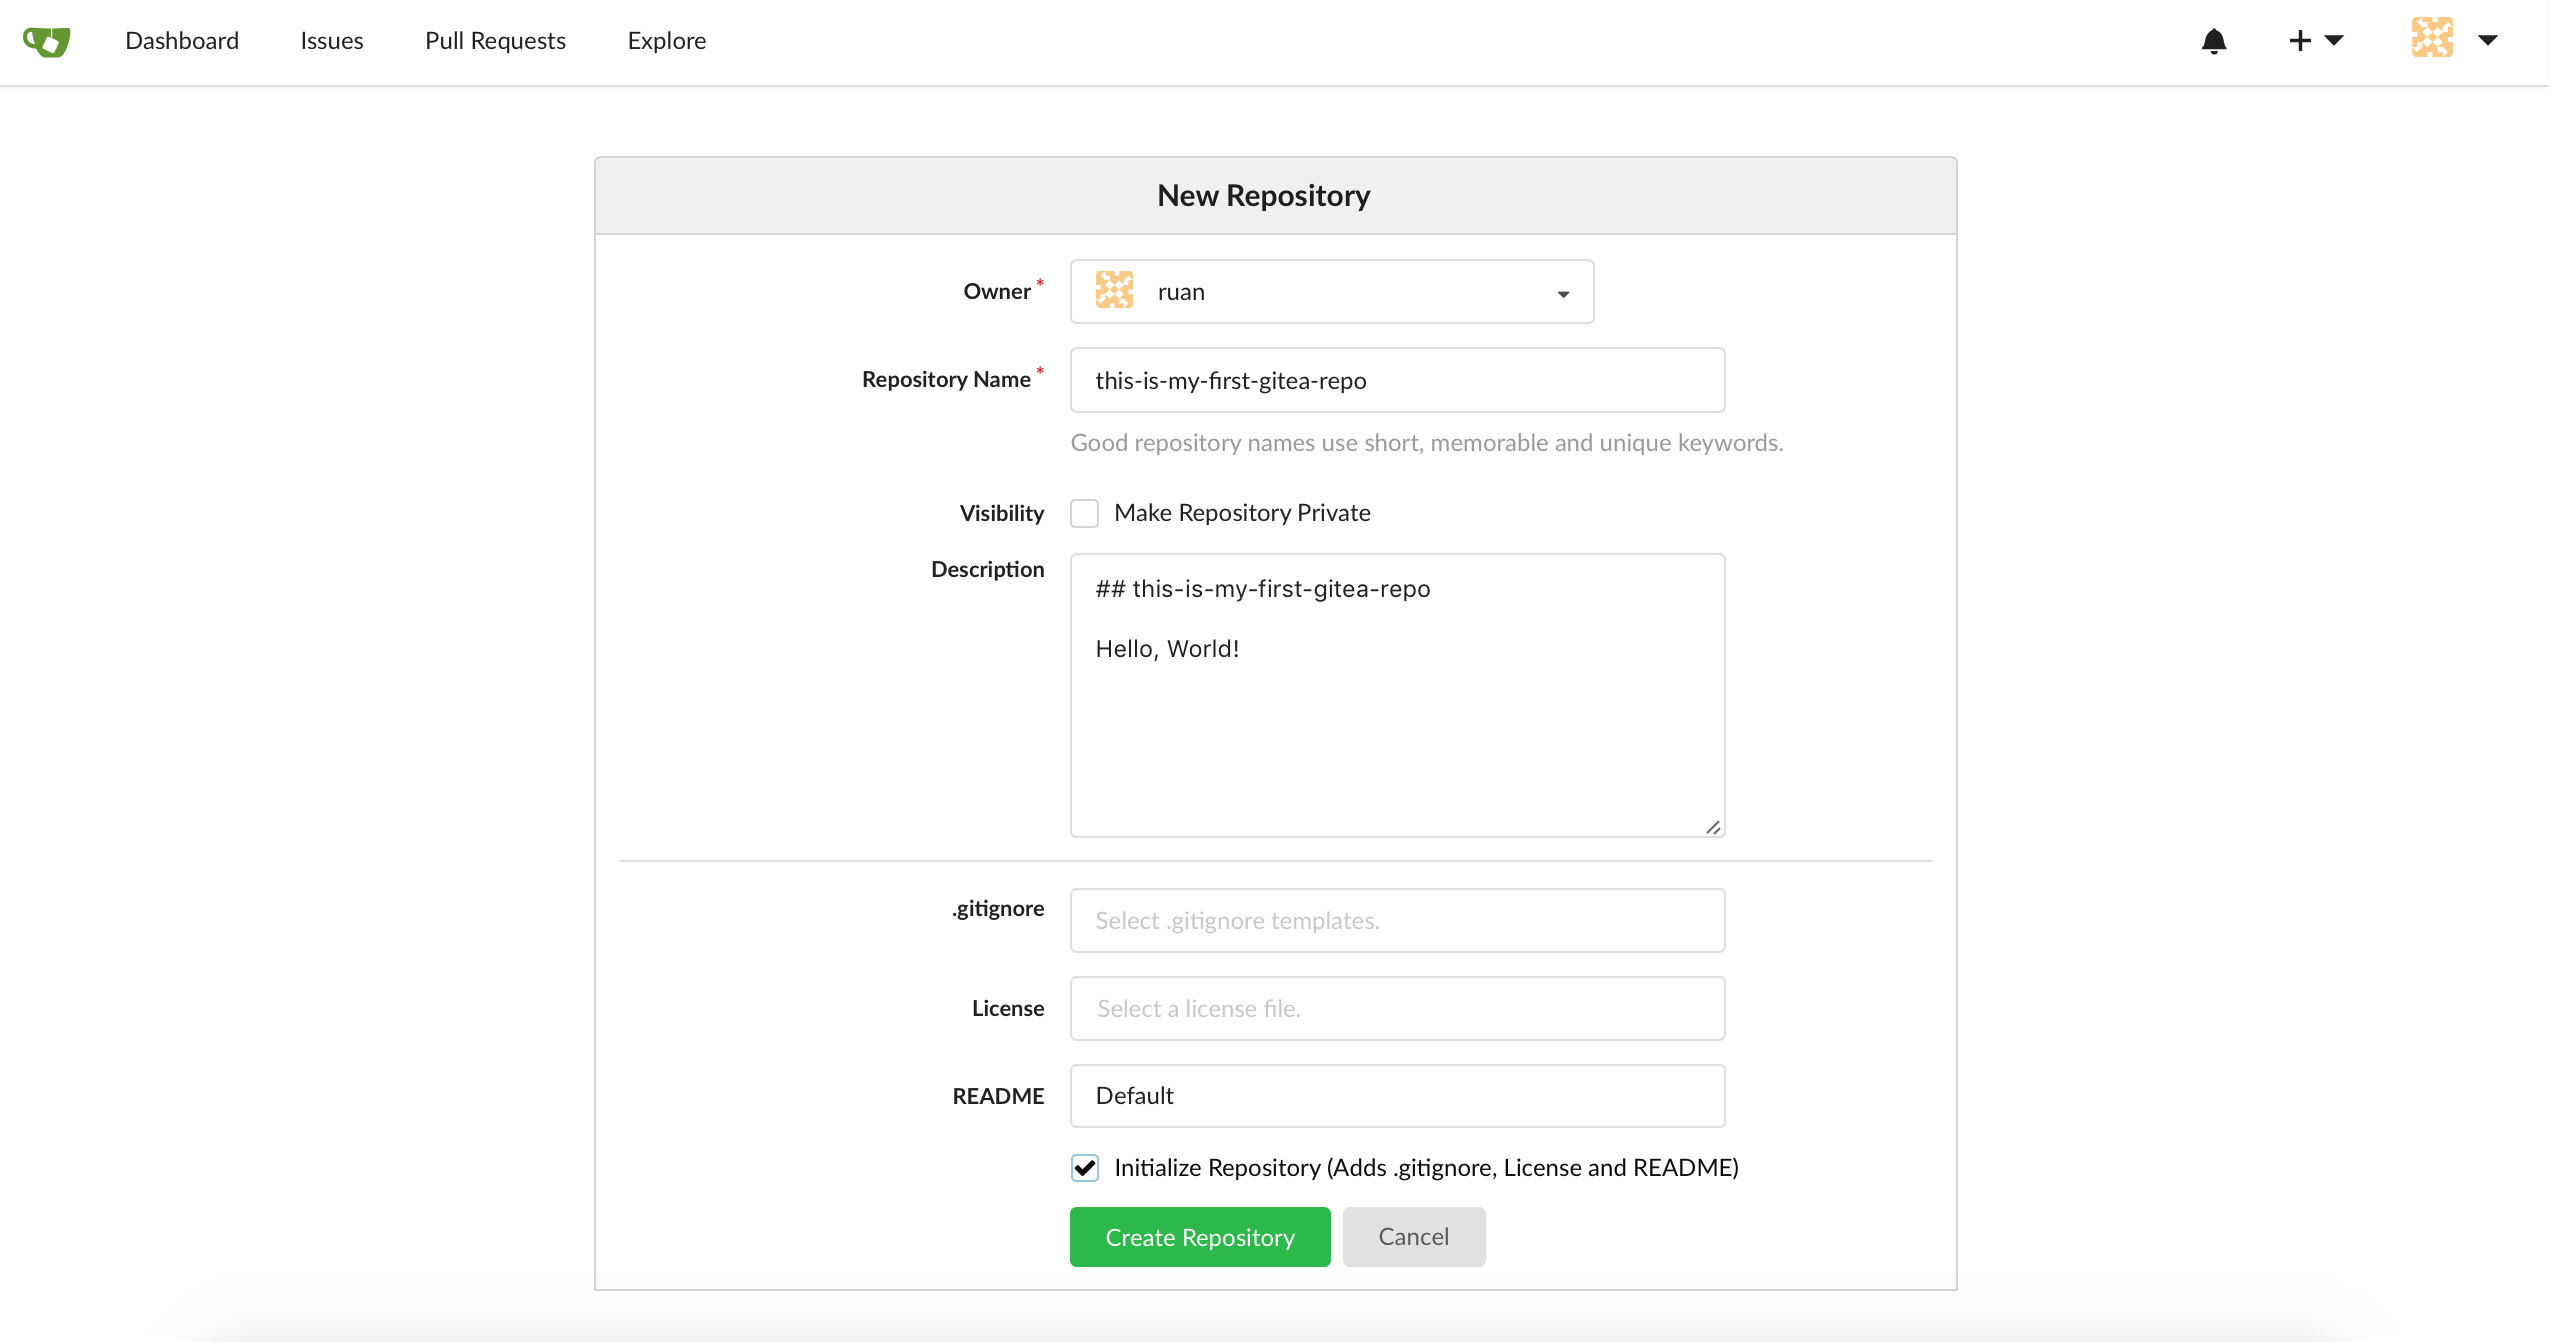
Head back to your dashboard and create your first repository:
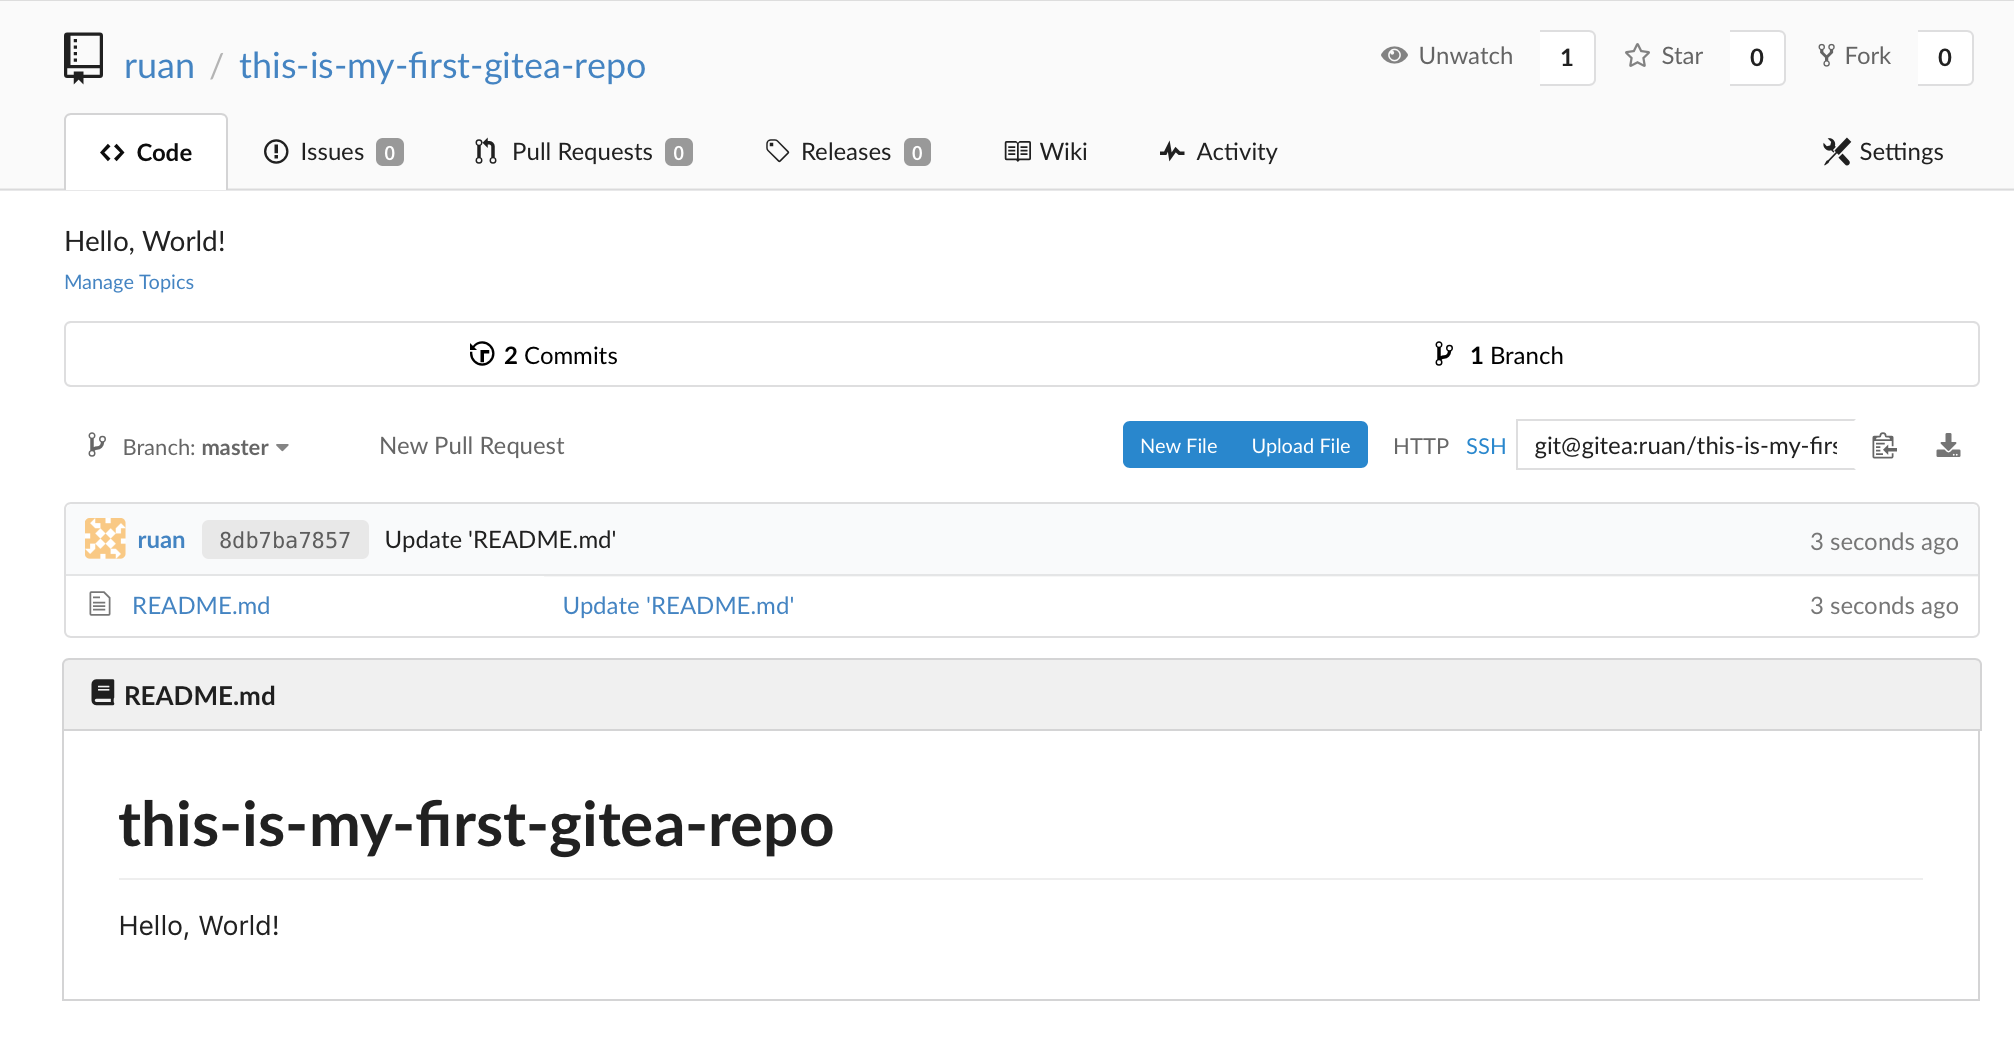
It should look more or less like this:
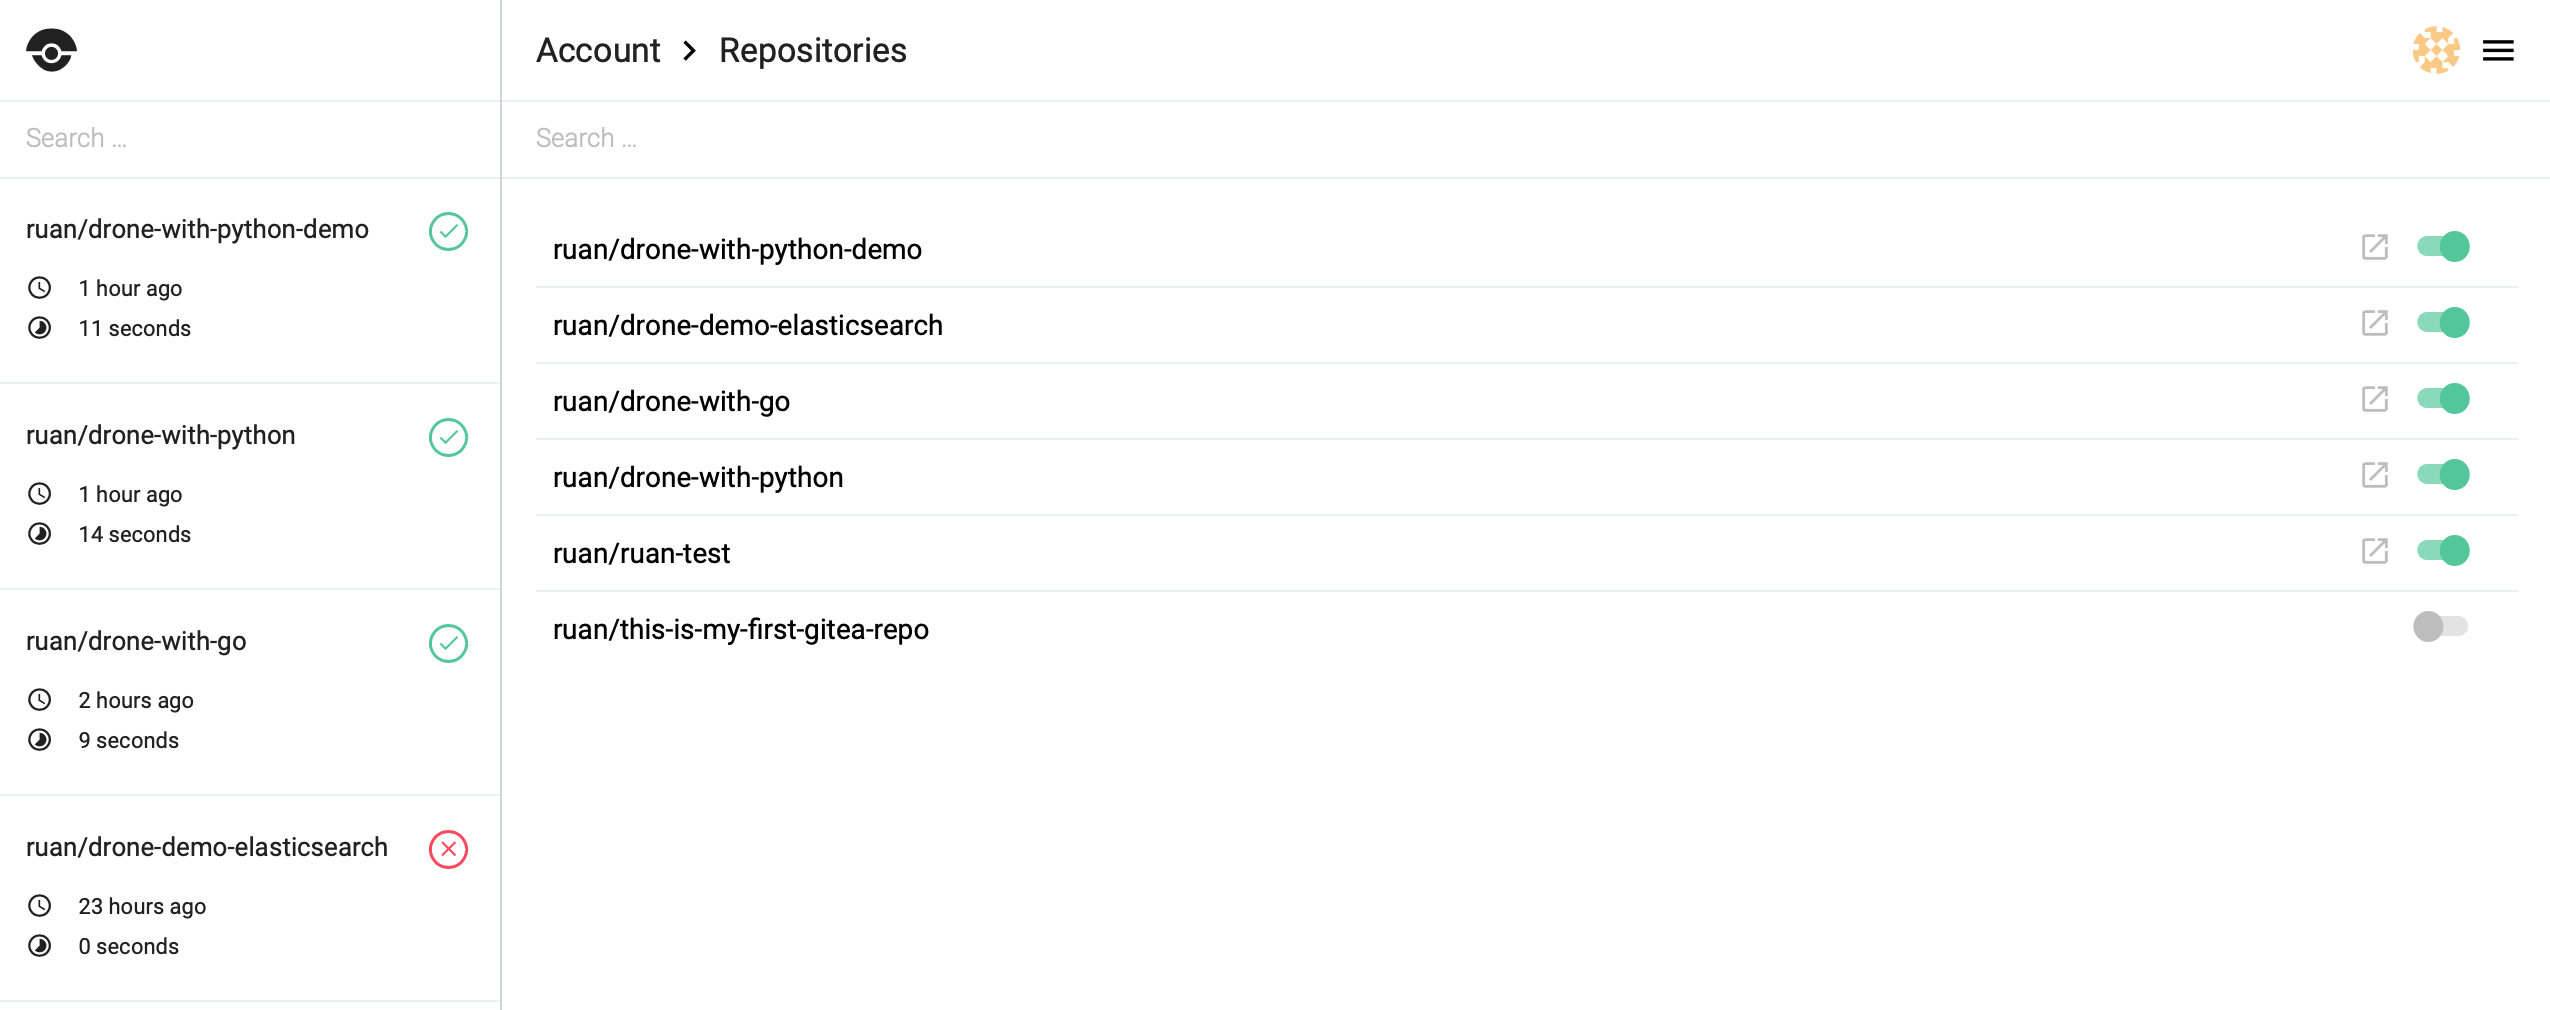
Enable Repo on Drone
Head over to drone and select the repositores on the right hand side http://:80/account/repos and enable your repository by toggline the selector, it should look more or less like this:
Once its enabled head back to gitea.
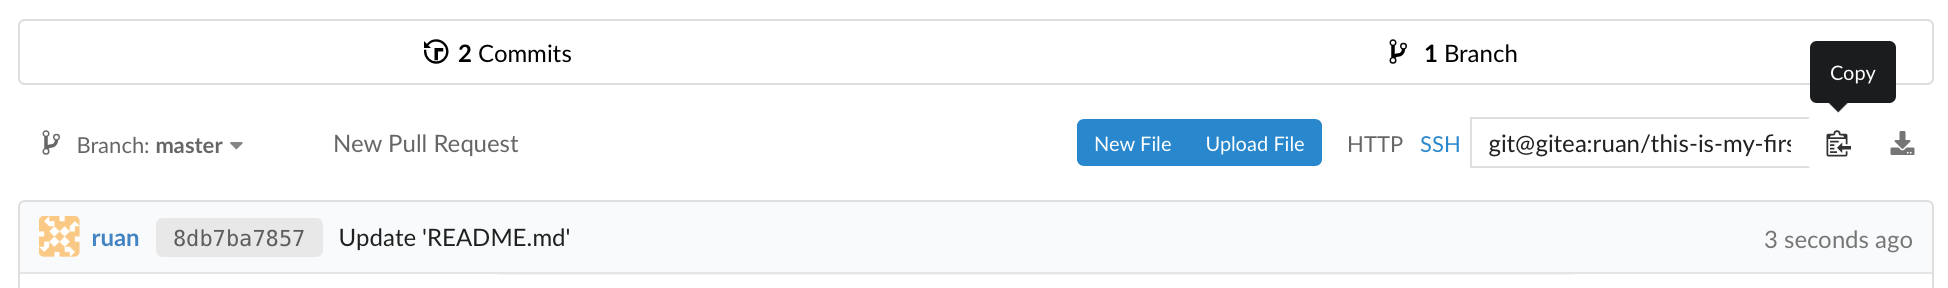
Clone the repository
On your repository select ssh and copy the ssh link for your repository:
Then from your terminal add your private ssh key to your ssh agent and clone the repository:
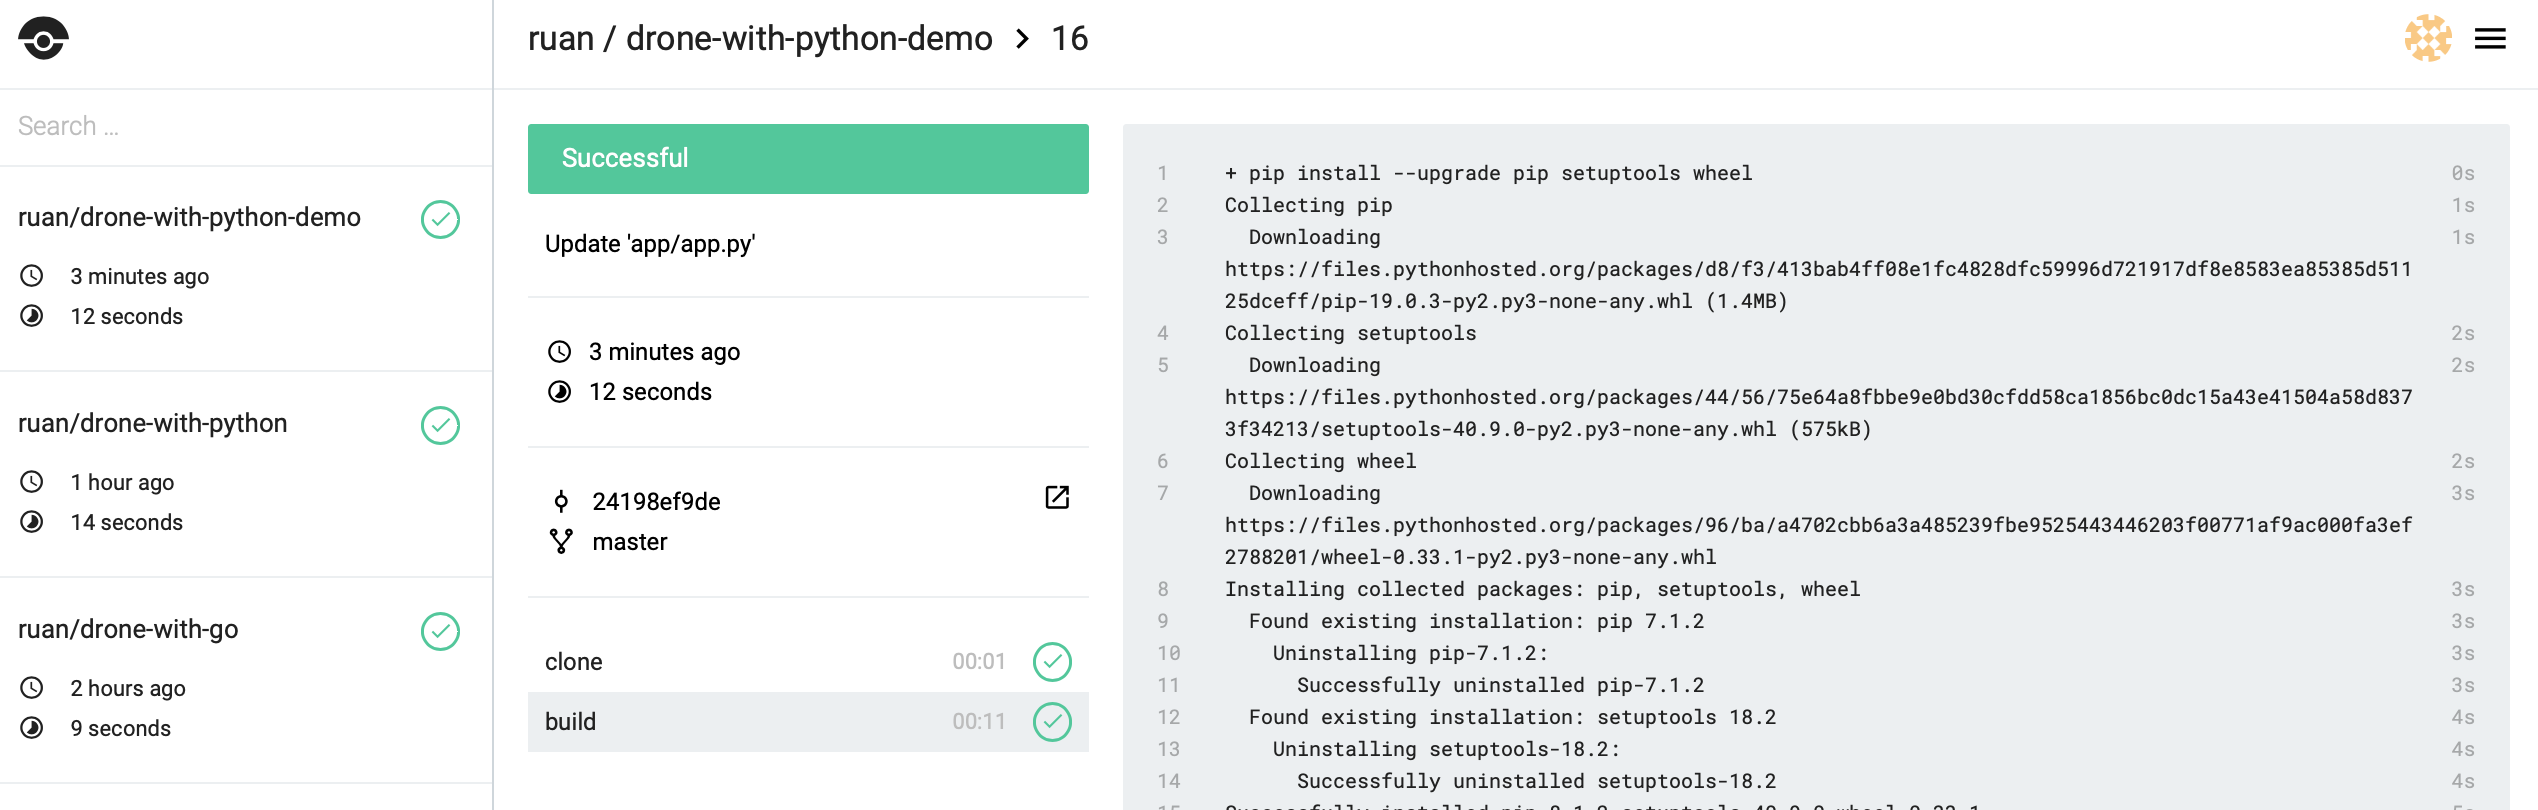
Head over to drone and look at the builds, you should see your build running at http://<docker-ip>:80/<user>/<repo-name>:
If everything ran as expected you should see that it passed.
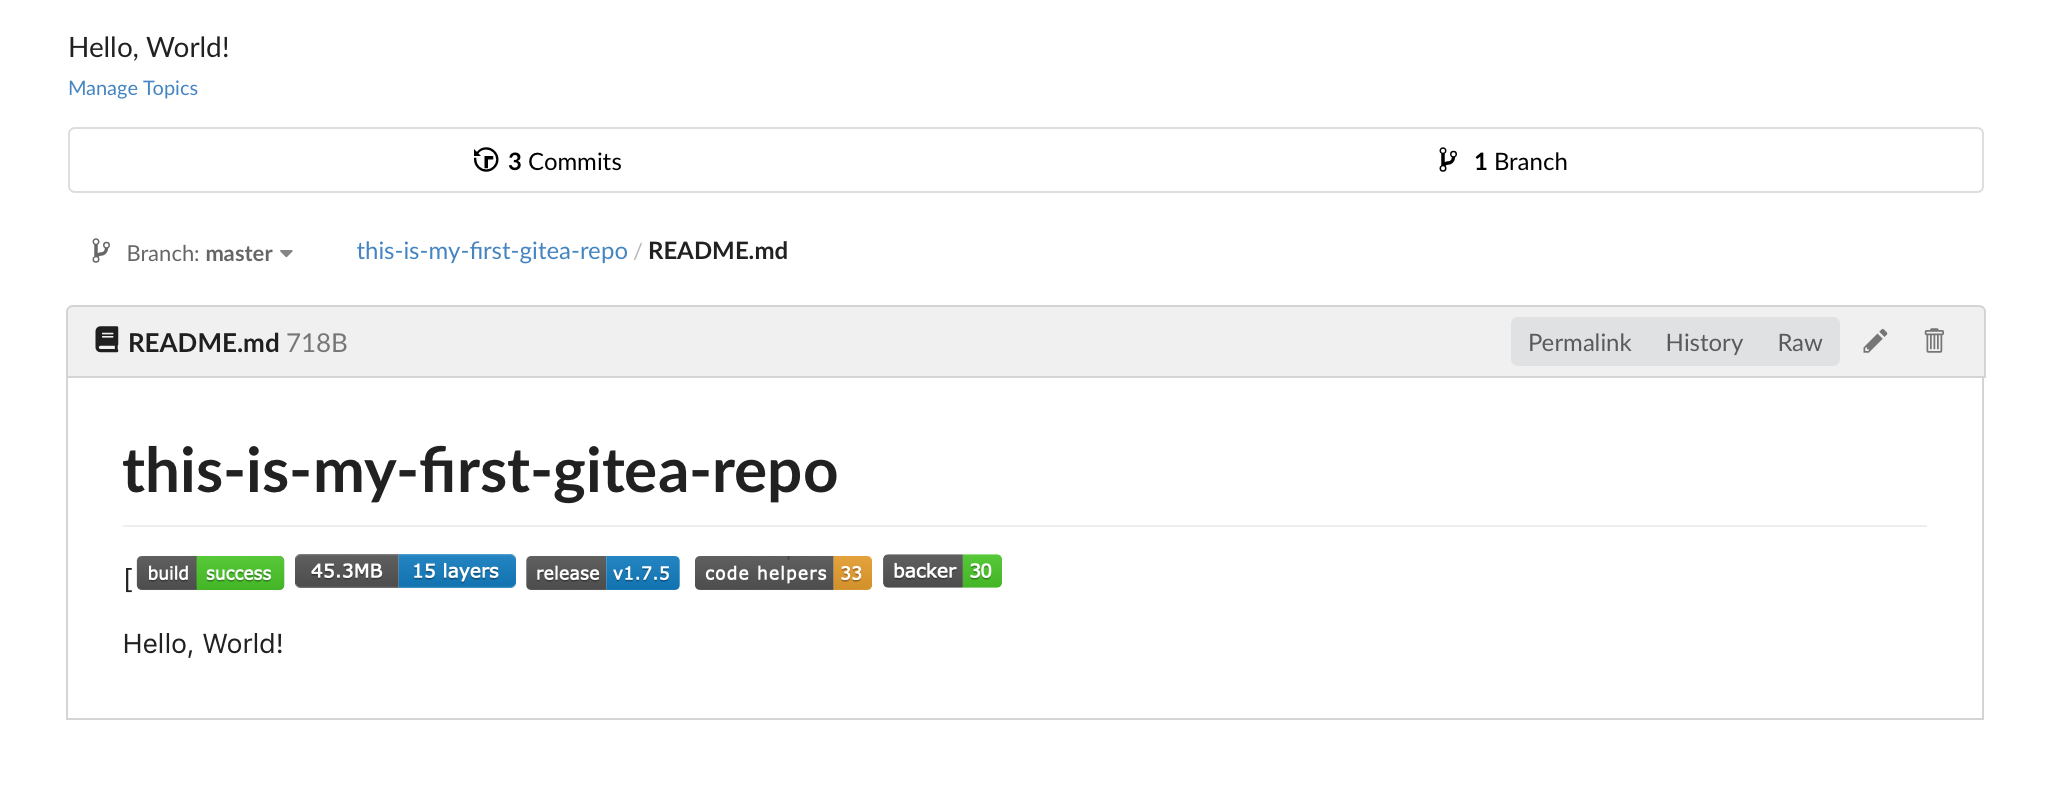
Build Status Badges
You can also include the build status badges from drone which will look like:
You can use the drone api: http://drone-ip:80/api/badges/<your-user>/<your-repo>/status.svg
12345
[[](https://microbadger.com/images/gitea/gitea "Get your own image badge on microbadger.com")[](https://github.com/go-gitea/gitea/releases/latest)[](https://www.codetriage.com/go-gitea/gitea)[](https://opencollective.com/gitea)
Overall gitea and drone is really amazing and quite impressed with it, especially from the low memory footprint and that its so easy to work with.
In this tutorial I will show you how to build really small docker containers for golang applications. And I mean the difference between 310MB down to 2MB
But Alpine..
So we thinking lets go with alpine right? Yeah sure lets build a small, app running on go with alpine.
Our application code:
app.go
12345678910111213141516171819202122232425
packagemainimport("fmt""math/rand""time")funcmain(){lekkewords:=[]string{"dog","cat","fish","giraffe","moo","spider","lion","apple","tree","moon","snake","mountain lion","trooper","burger","nasa","yes",}rand.Seed(time.Now().UnixNano())varzelengthint=len(lekkewords)varindexnumint=rand.Intn(zelength-1)word:=lekkewords[indexnum]fmt.Println("Number of words:",zelength)fmt.Println("Selected index number:",indexnum)fmt.Println("Selected word is:",word)}
Our Dockerfile:
Dockerfile
1234567
FROM golang:alpine
WORKDIR$GOPATH/src/mylekkepackage/mylekkeapp/
COPY app.go .
RUN go build -o /go/app
CMD["/go/app"]
Let’s package our app to an image:
Dockerfile
1
❯ docker build -t mygolangapp:using-alpine .
Inspect the size of our image, as you can see it being 310MB
Dockerfile
123
❯ docker images "mygolangapp:*"REPOSITORY TAG IMAGE ID CREATED SIZE
mygolangapp using-alpine eea1d7bde218 About a minute ago 310MB
Just make sure it actually works:
Dockerfile
1234
❯ docker run mygolangapp:using-alpine
Number of words: 16Selected index number: 11Selected word is: mountain lion
But for something just returning random selected text, 310MB is a bit crazy.
Multi Stage Builds
As Go binaries are self-contained, we can make use of docker’s multi stage builds, where we can build our application on alpine and use the binary on a scratch image:
Our multi stage Dockerfile:
Dockerfile.mult
1234567891011
FROM golang:alpine AS builder
WORKDIR$GOPATH/src/mylekkepackage/mylekkeapp/
COPY app.go .
RUN go build -o /go/app
FROM scratch
COPY --from=builder /go/app /go/app
CMD["/go/app"]
❯ docker images "mygolangapp:*"REPOSITORY TAG IMAGE ID CREATED SIZE
mygolangapp using-multistage 31474c61ba5b 15 seconds ago 2.01MB
mygolangapp using-alpine eea1d7bde218 2 minutes ago 310MB
Run the app:
Dockerfile.mult
1234
❯ docker run mygolangapp:using-multistage
Number of words: 16Selected index number: 5Selected word is: spider
In this tutorial we will setup a reverse proxy using nginx to translate and load balance traffic through to our elasticsearch nodes. We will also protect our elasticsearch cluster with basic auth and use letsencrypt to retrieve free ssl certificates.
We want to allow certain requests to be bypassed from authentication such as getting status from the cluster and certain requests we want to enforce authentication, such as indexing and deleting data.
Install Nginx:
Install nginx and the dependency package to create basic auth:
1
$ apt install nginx apache2-utils -y
Configure Nginx for Reverse Proxy
We want to access our nginx proxy on port 80: 0.0.0.0:80 and the requests should be proxied through to elasticsearch private addresses: 10.0.0.10:9200 and 10.0.0.11:9200. Traffic will be load balanced between our 2 nodes.
Now make requests to elasticsearch via your nginx reverse proxy:
123
$ curl -H 'Content-Type: application/json' -u 'admin:admin' http://myproxy.domain.com/_cat/indices?v
health status index uuid pri rep docs.count docs.deleted store.size pri.store.size
green open first-index 1o6yM7tCSqagqoeihKM7_g 5130 40.6kb 20.3kb
Letsencrypt SSL Certificates
Add free SSL Certificates to your reverse proxy. Install certbot:
$ certbot --manual certonly -d myproxy.domain.com -m my@email.com --preferred-challenges dns --agree-tos

Obtaining a new certificate
Performing the following challenges:
dns-01 challenge for myproxy.domain.com
You will be prompted to make a dns change, since we requested the dns challenge. While this screen is here, we can go our dns provider and make the TXT record change as shown below:
1234567891011121314151617181920212223
Please deploy a DNS TXT record under the name
_acme-challenge.myproxy.domain.com with the following value:

xLP4y_YJvdAK7_aZMJ50gkudTDeIC3rX0x83aNJctGw

Before continuing, verify the record is deployed.
Press Enter to Continue
Waiting for verification...
Cleaning up challenges

IMPORTANT NOTES:
 - Congratulations! Your certificate and chain have been saved at:
   /etc/letsencrypt/live/myproxy.domain.com/fullchain.pem
   Your key file has been saved at:
   /etc/letsencrypt/live/myproxy.domain.com/privkey.pem
   Your cert will expire on 2019-07-01. To obtain a new or tweaked
   version of this certificate in the future, simply run certbot
   again. To non-interactively renew *all* of your certificates, run
   "certbot renew"
 - If you like Certbot, please consider supporting our work by:

   Donating to ISRG / Let's Encrypt:   https://letsencrypt.org/donate
   Donating to EFF:                    https://eff.org/donate-le
Update Nginx Config
Now that we have our ssl certificates, we need to update our nginx config to enable ssl, redirect http to https and point the ssl certificates and ssl private keys to the certificates that we retrieved from letsencrypt.
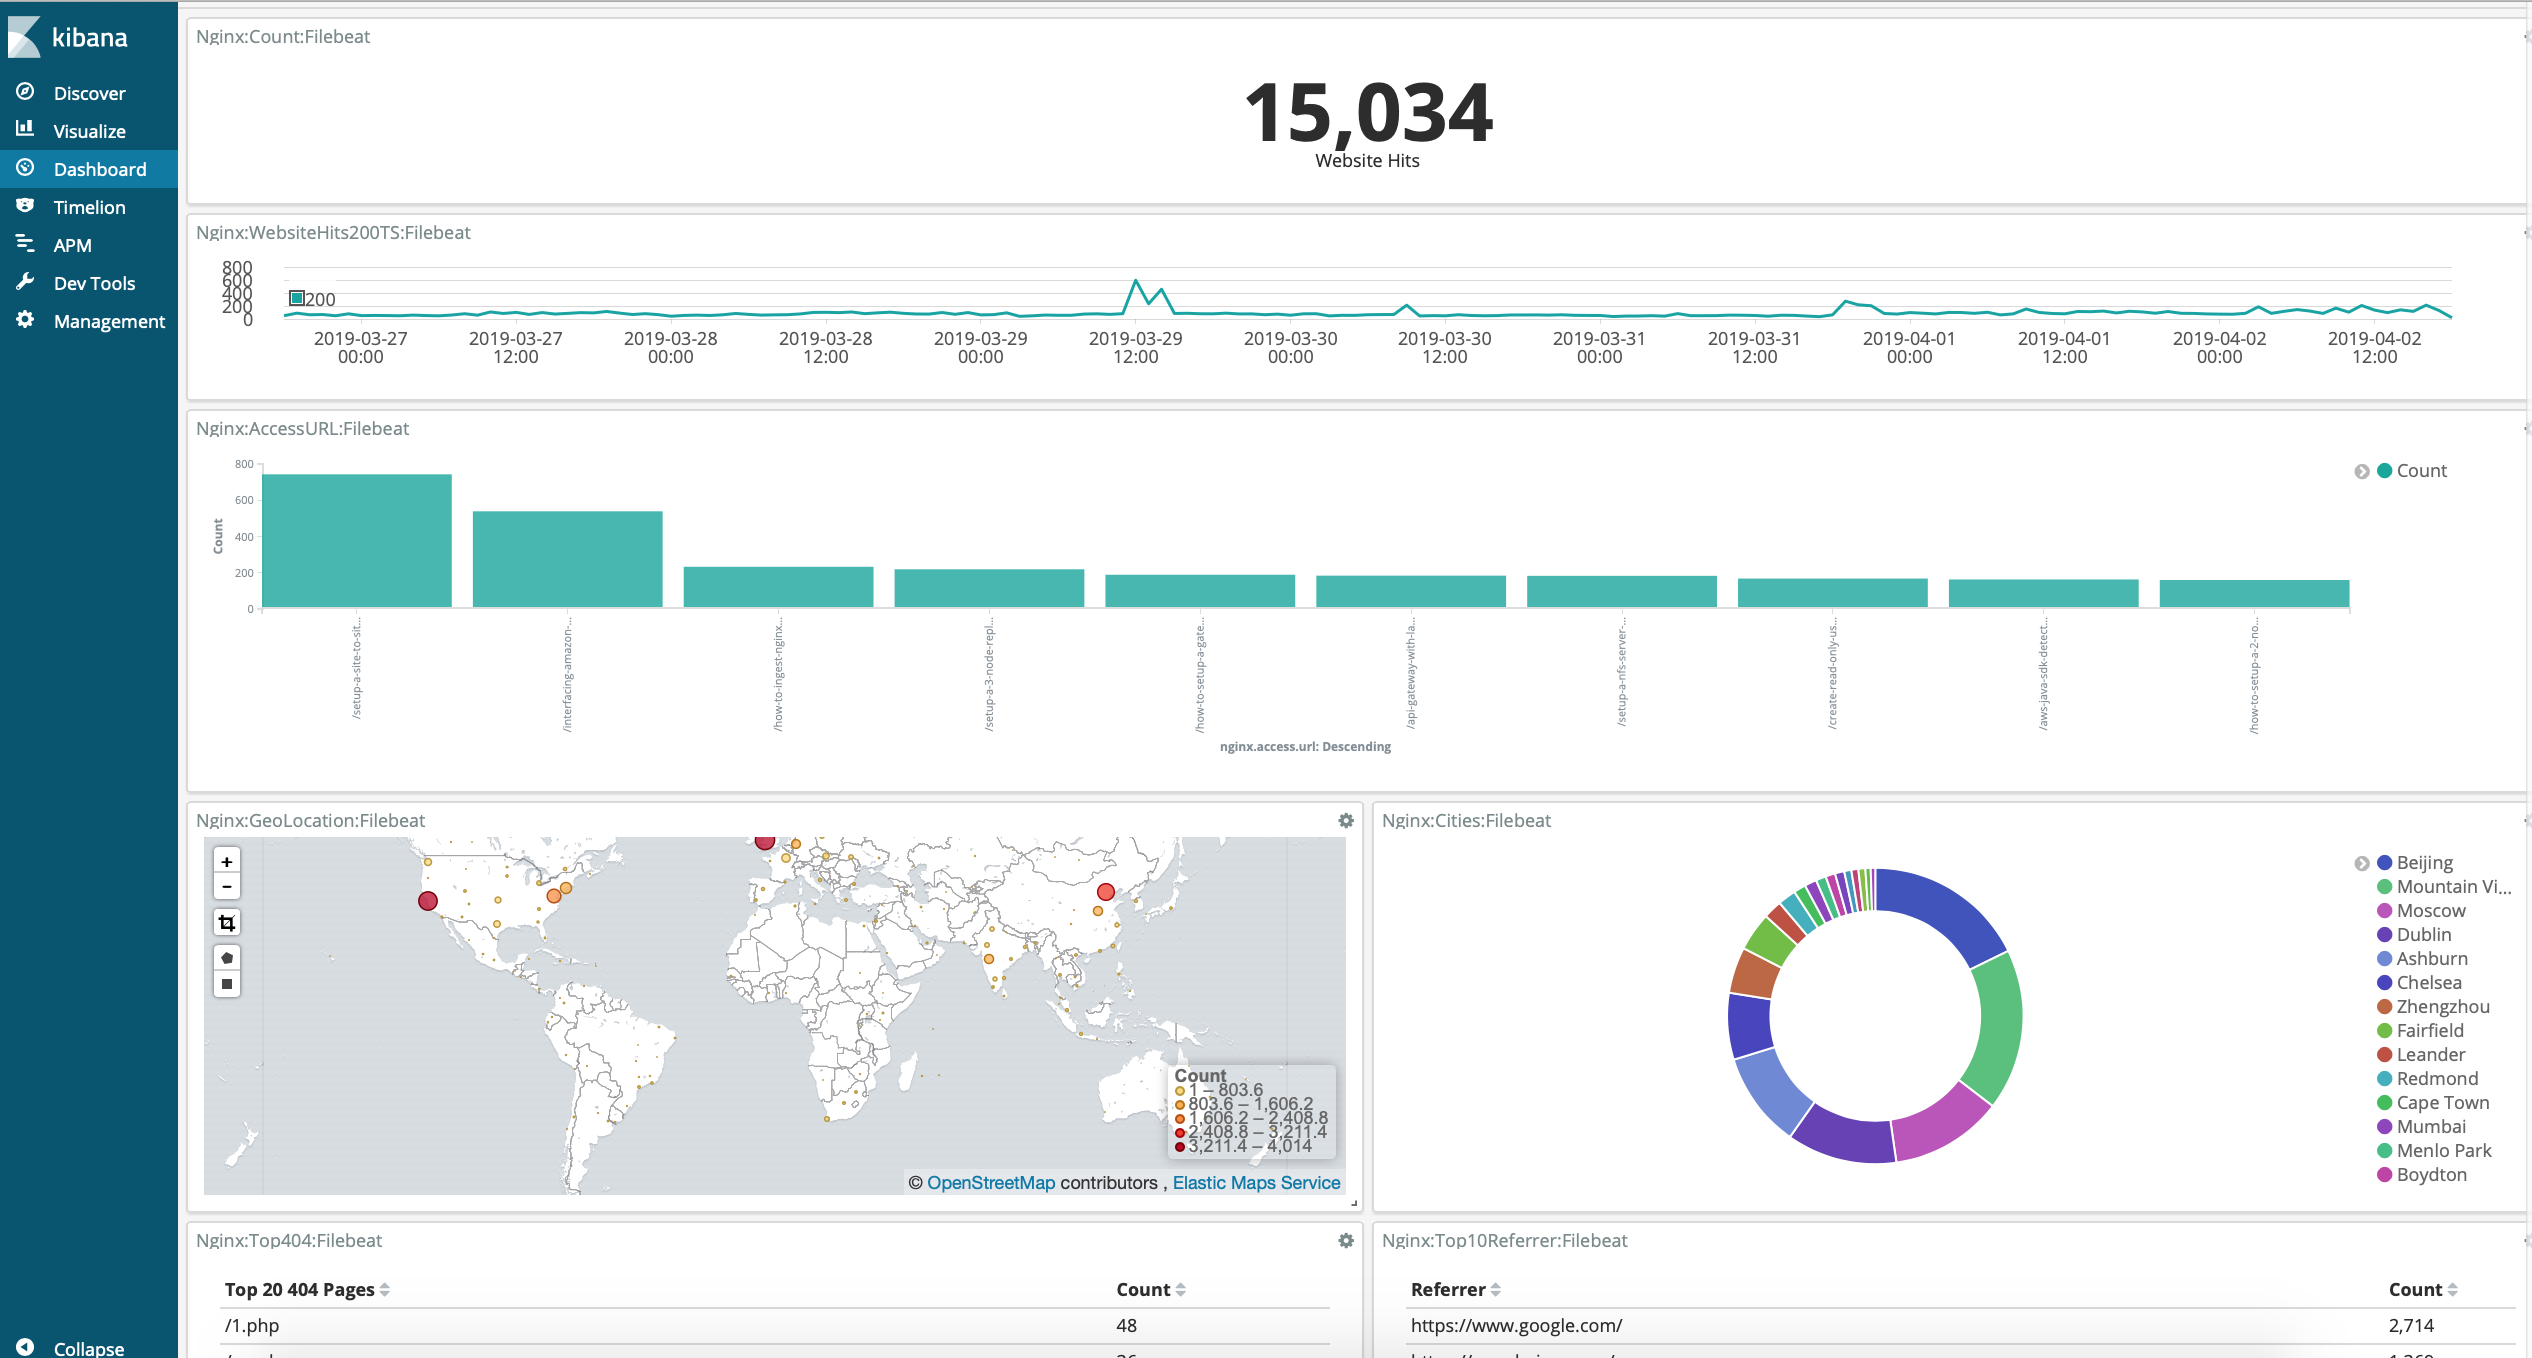
In this tutorial we will setup a Basic Kibana Dashboard for a Web Server that is running a Blog on Nginx.
What do we want to achieve?
We will setup common visualizations to give us an idea on how our blog/website is doing.
In some situations we need to create visualizations to understand the behavior of our log data in order to answer these type of questions:
Number
Scenario
1
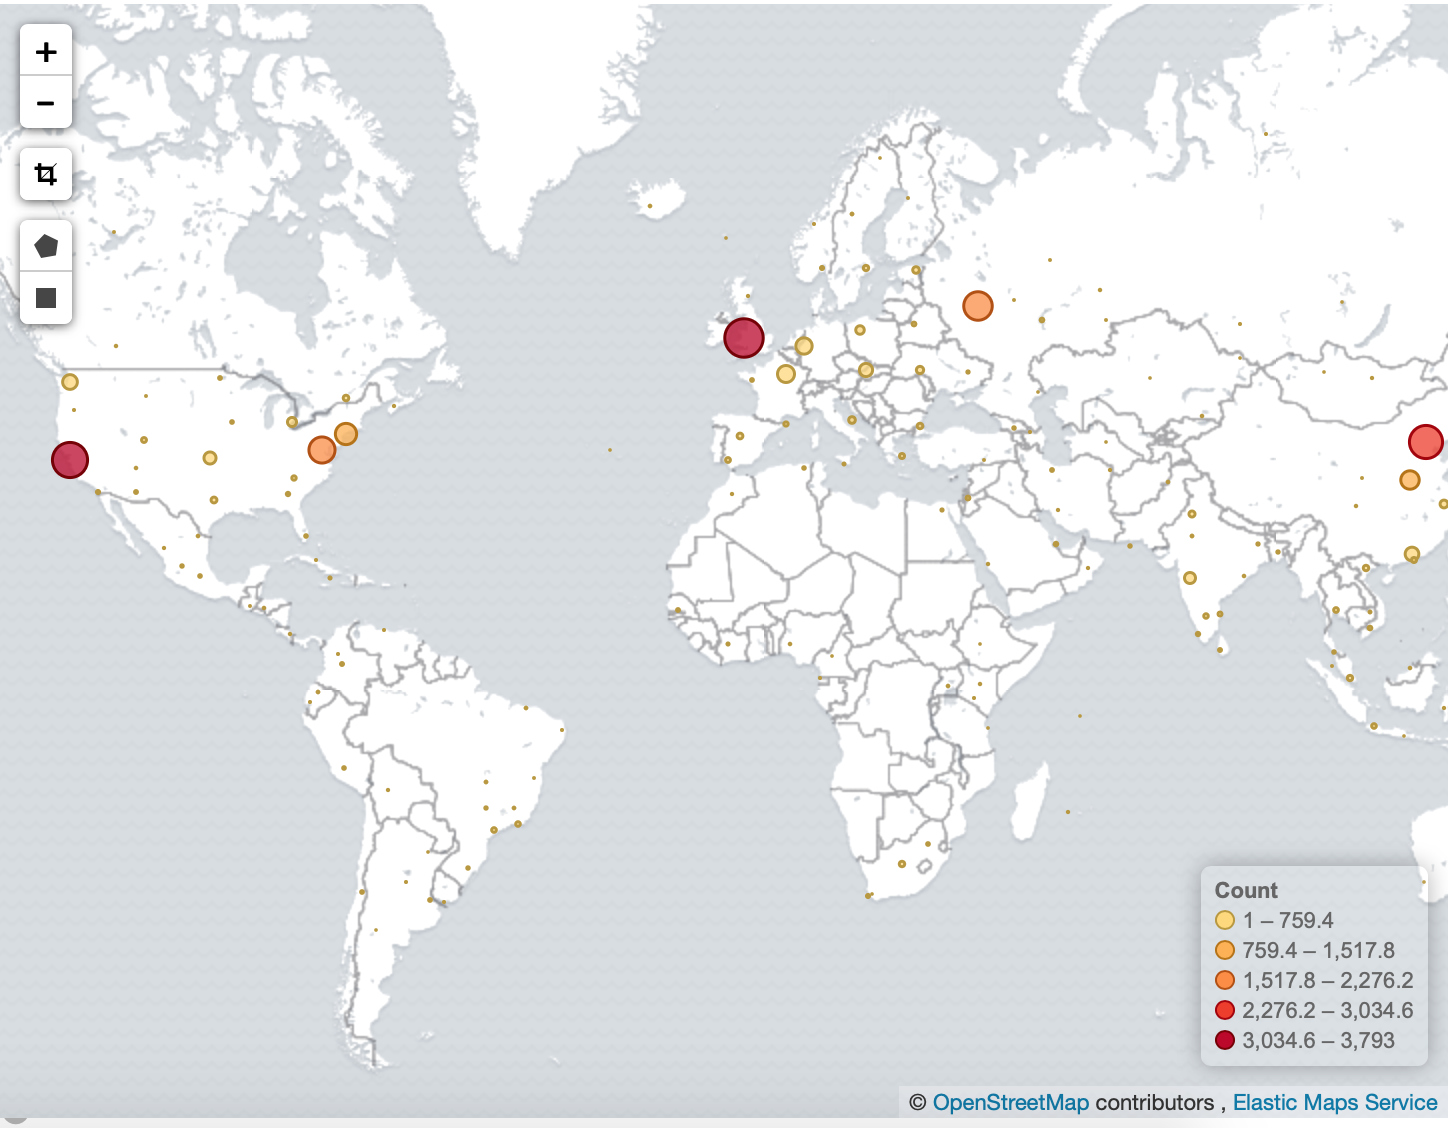
Geographical map to see where people are connecting from
2
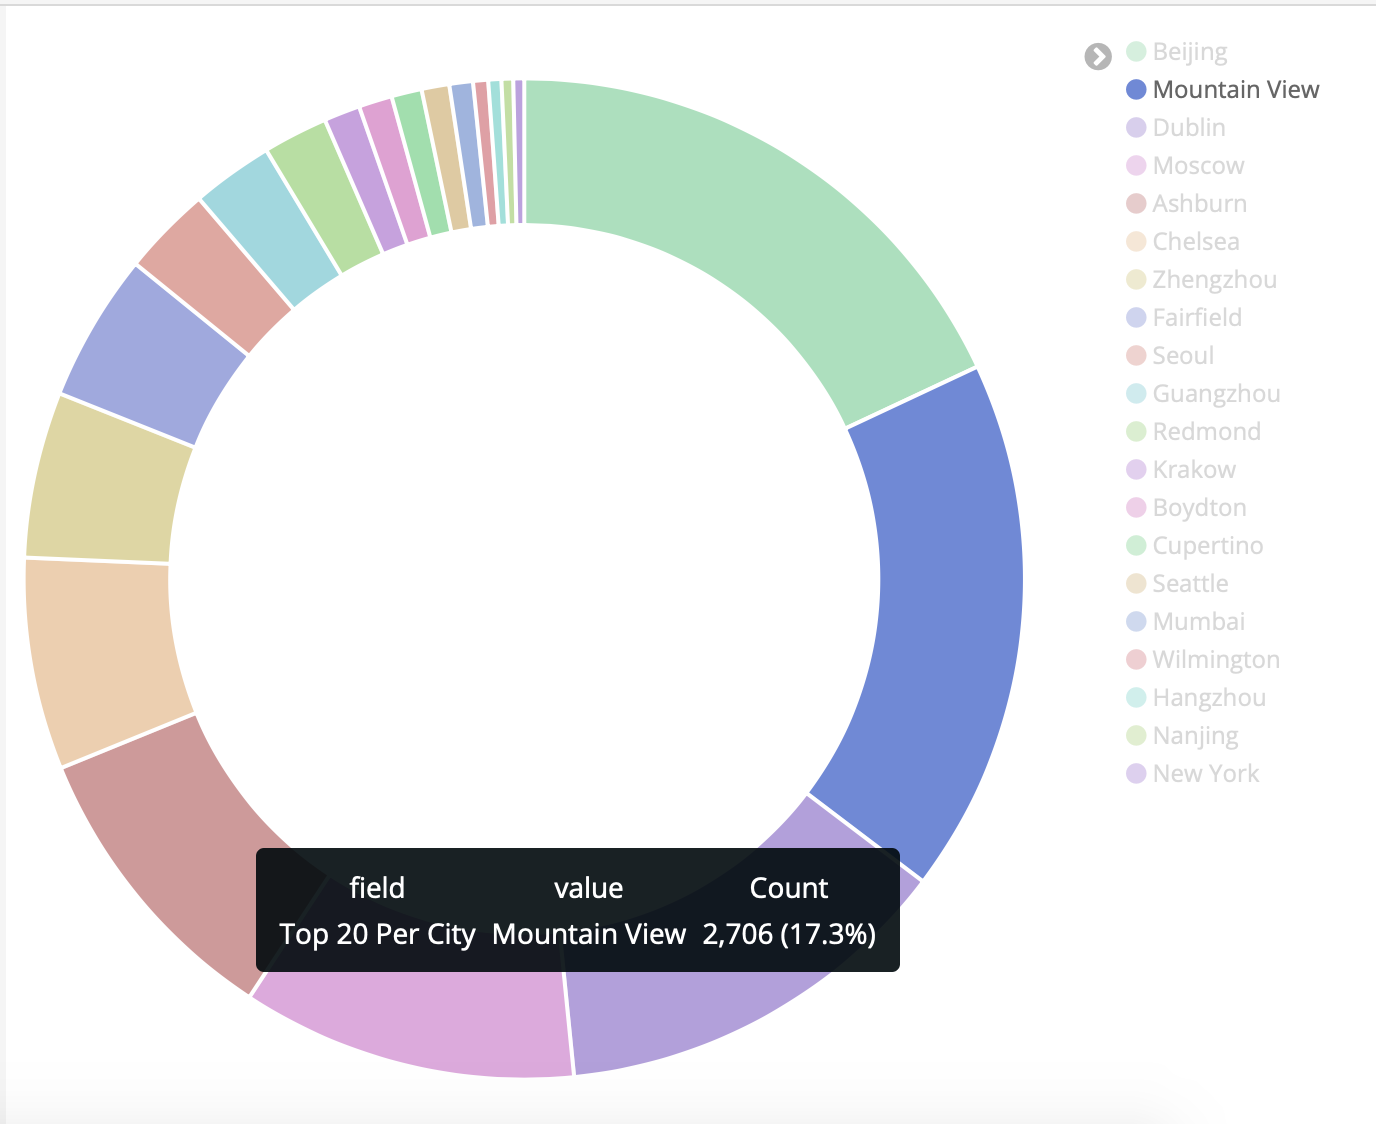
Piechart that represents the percentage of cities accessing my blog
3
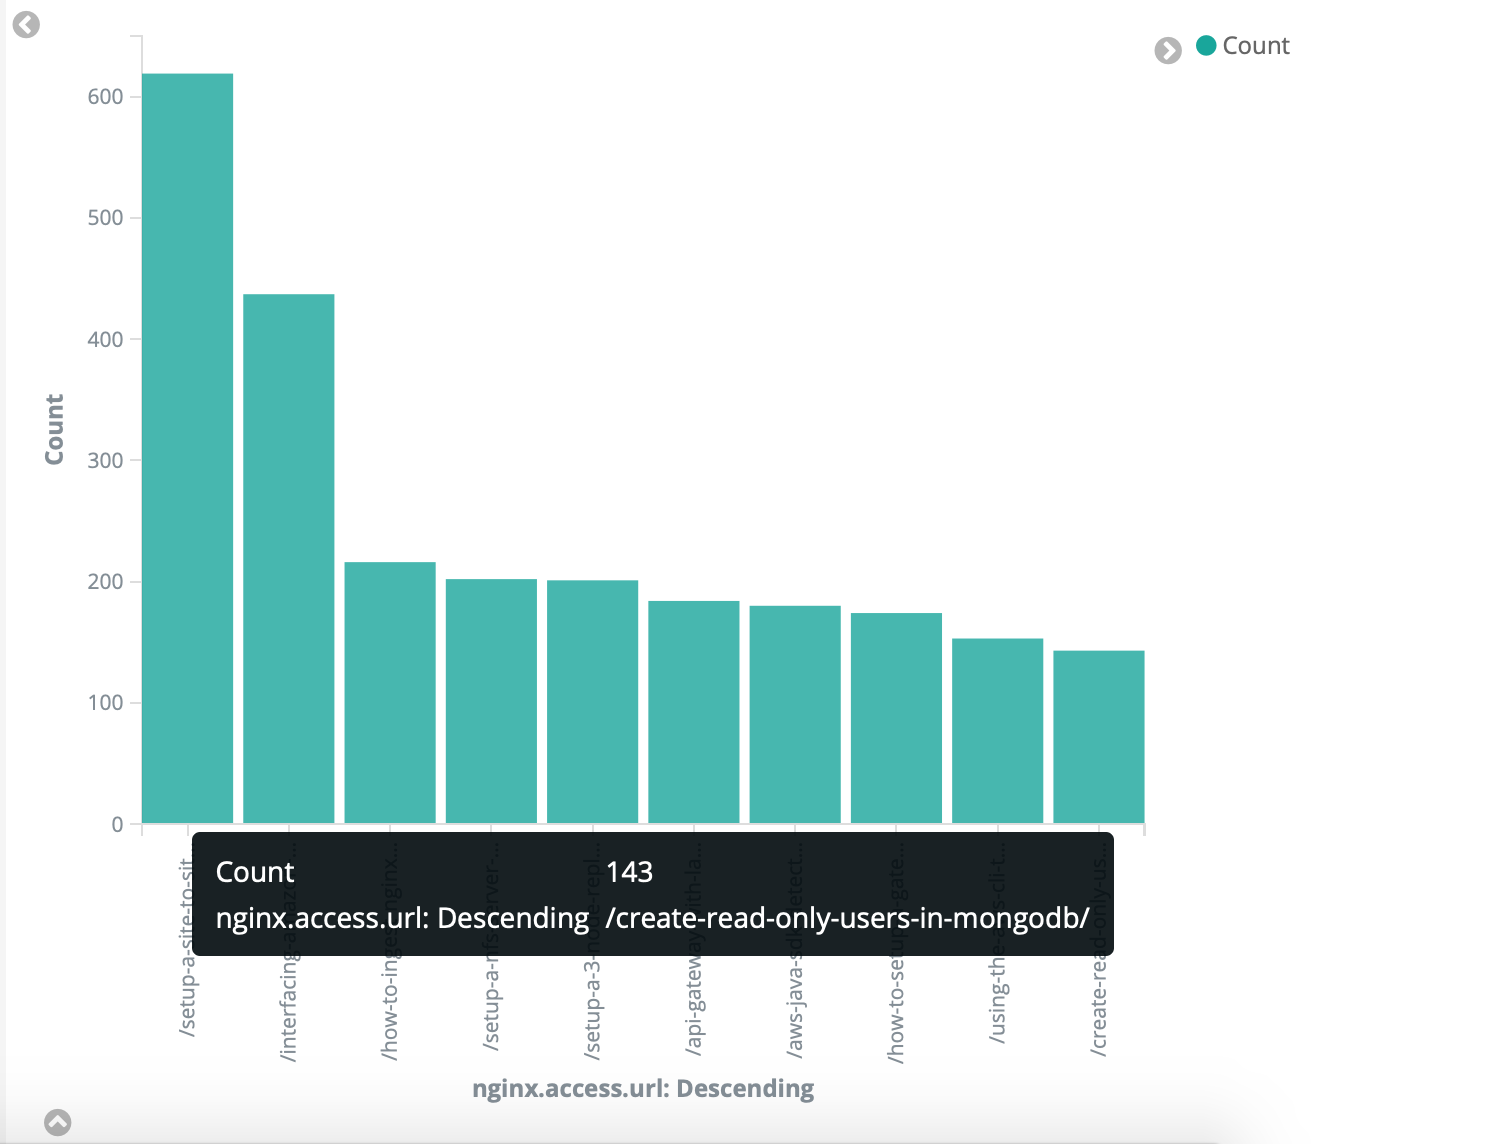
Top 10 Most Accessed Pages
4
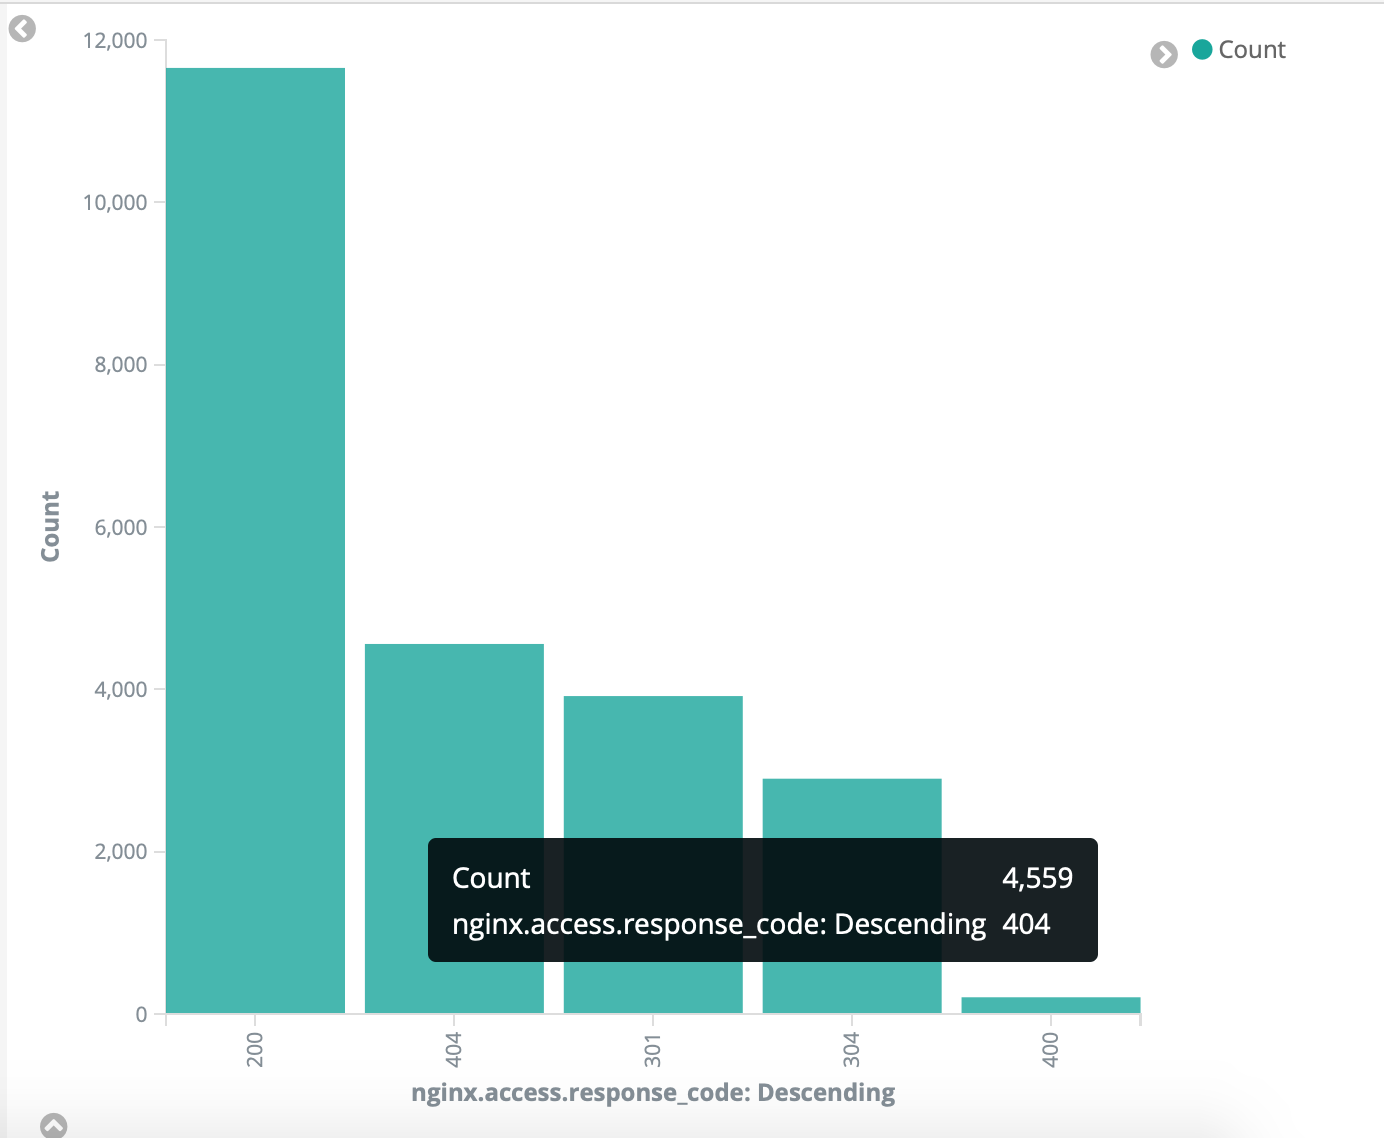
Top 5 HTTP Status Codes
5
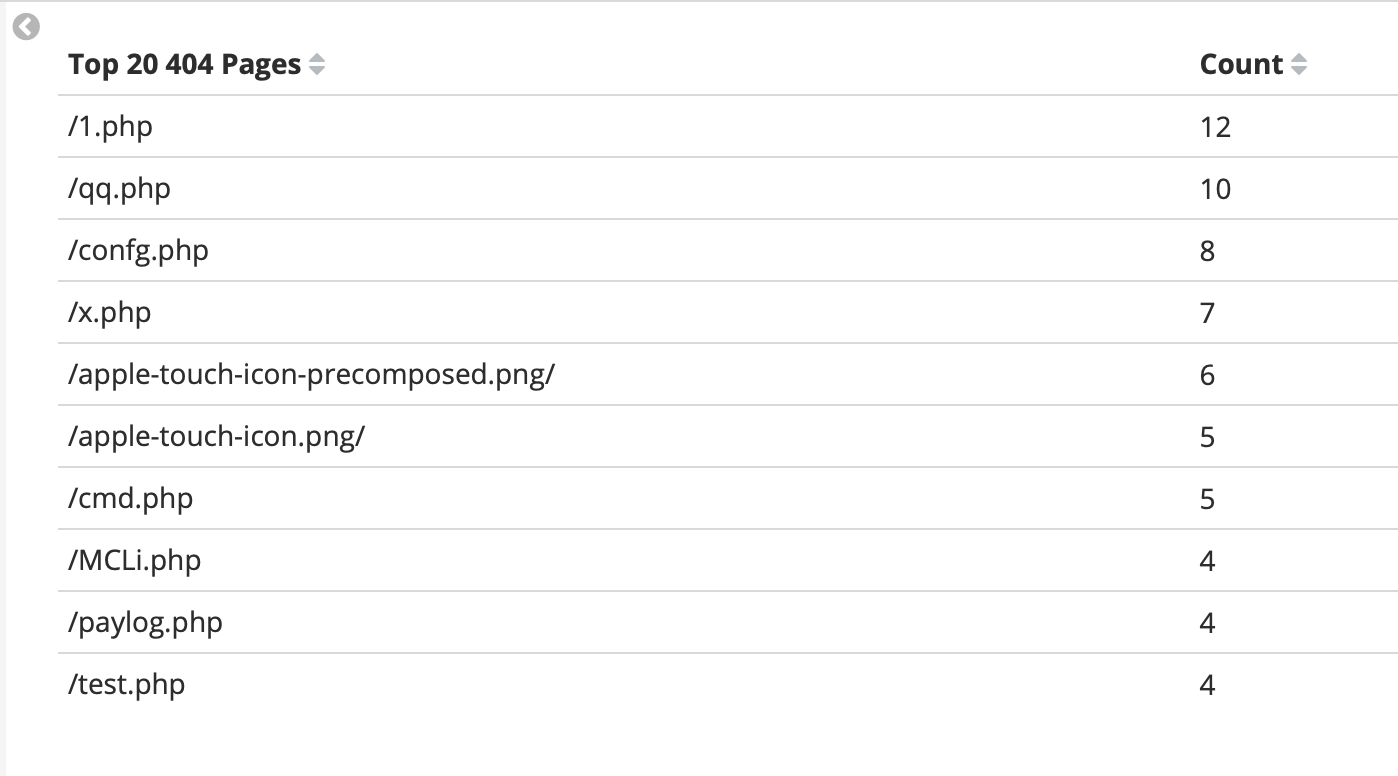
Top 10 Pages that returned 404 Responses
6
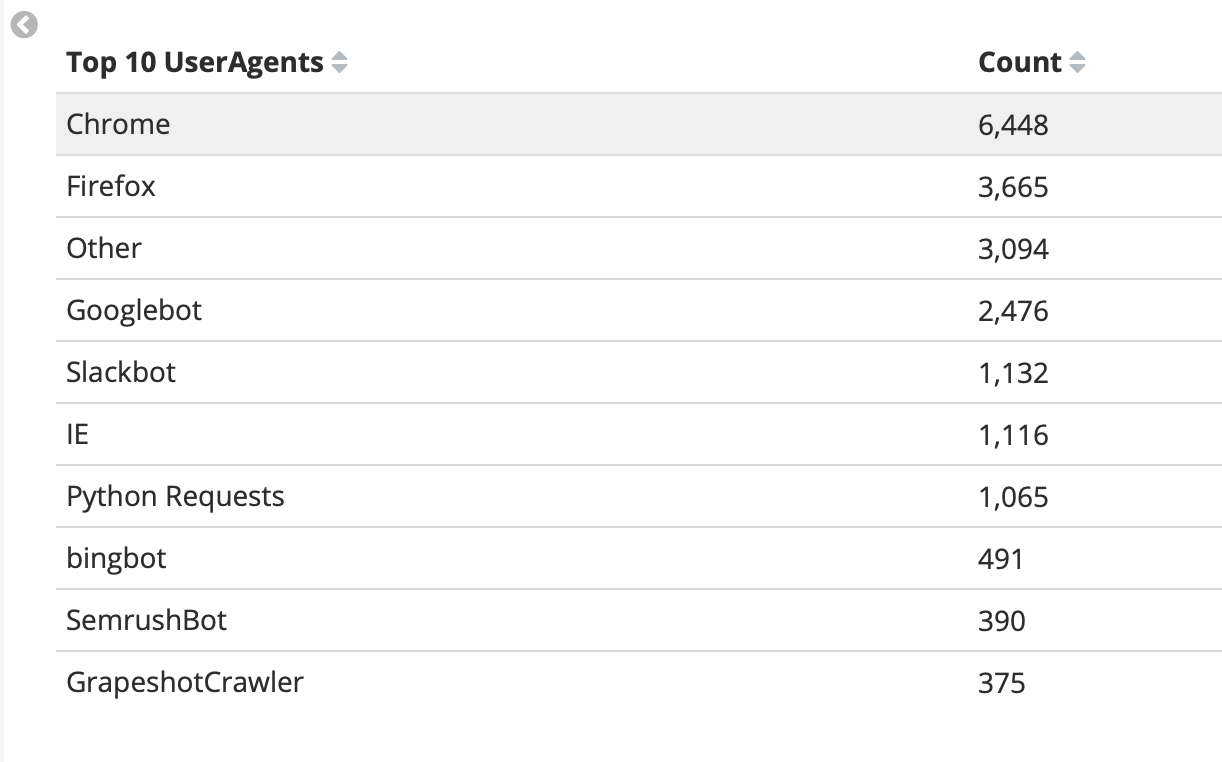
The Top 10 User Agents
7
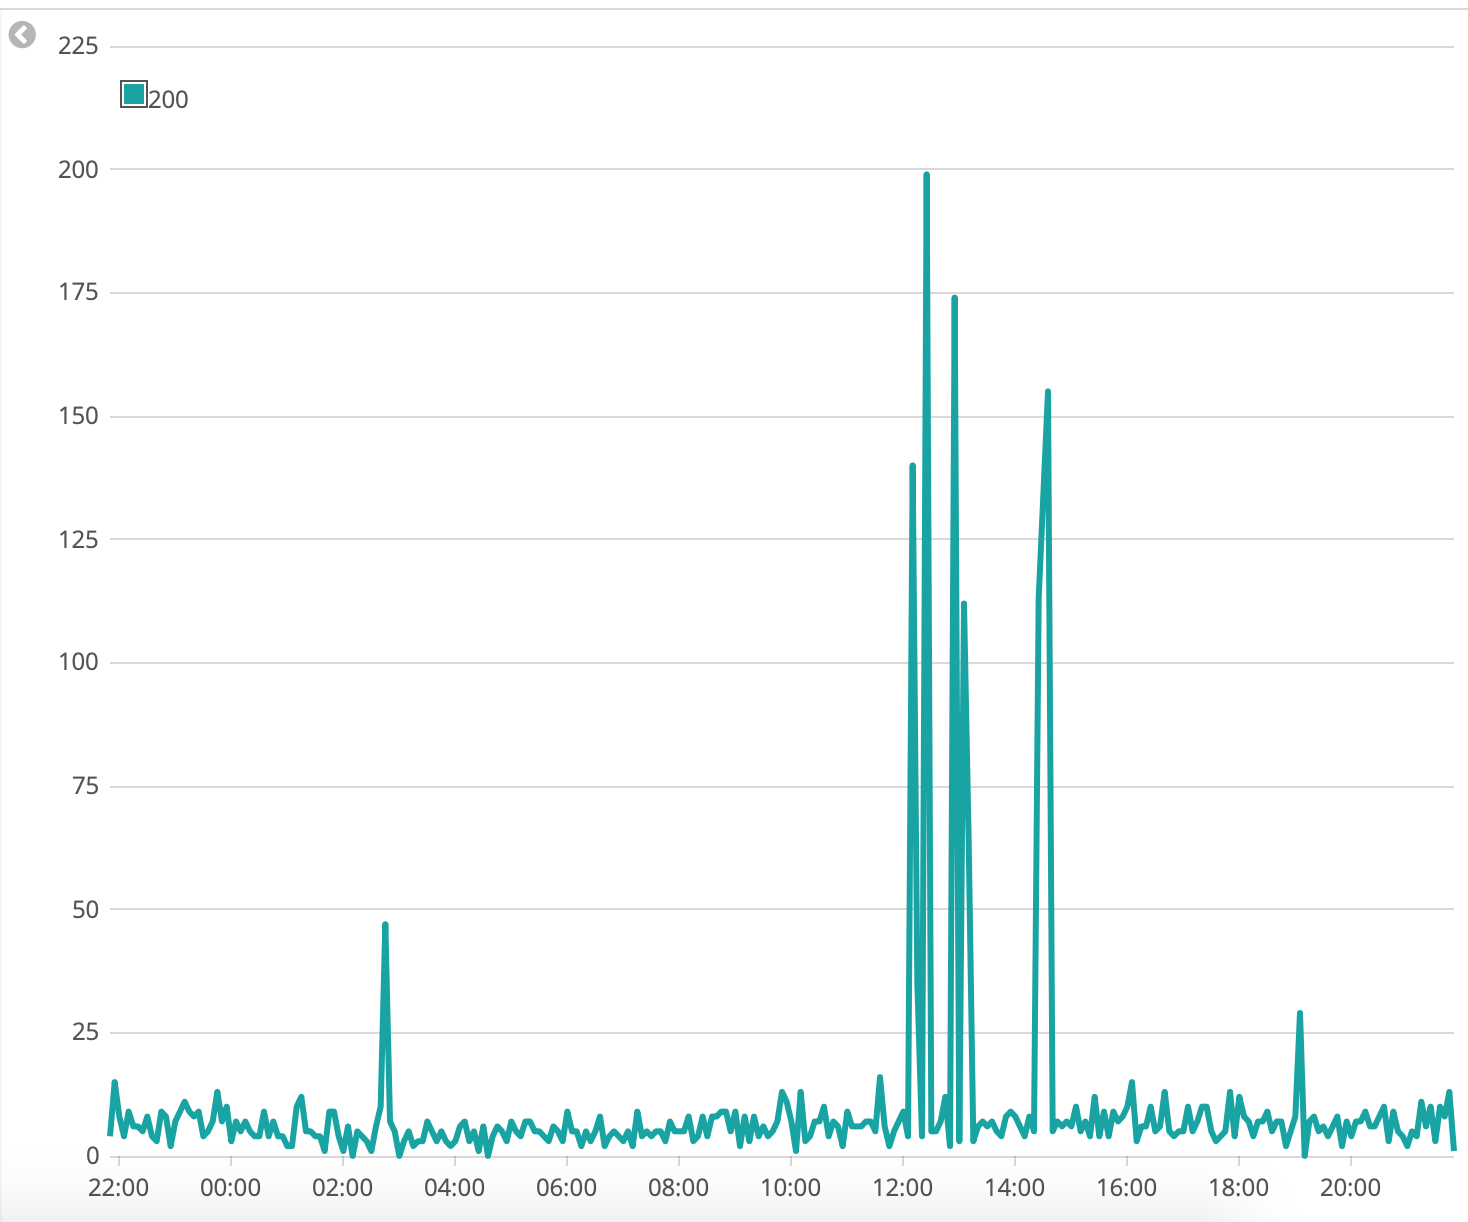
Timeseries: Status Codes Over Time
8
Timeseries: Successfull Website Hits over time
9
Counter with Website Hits
10
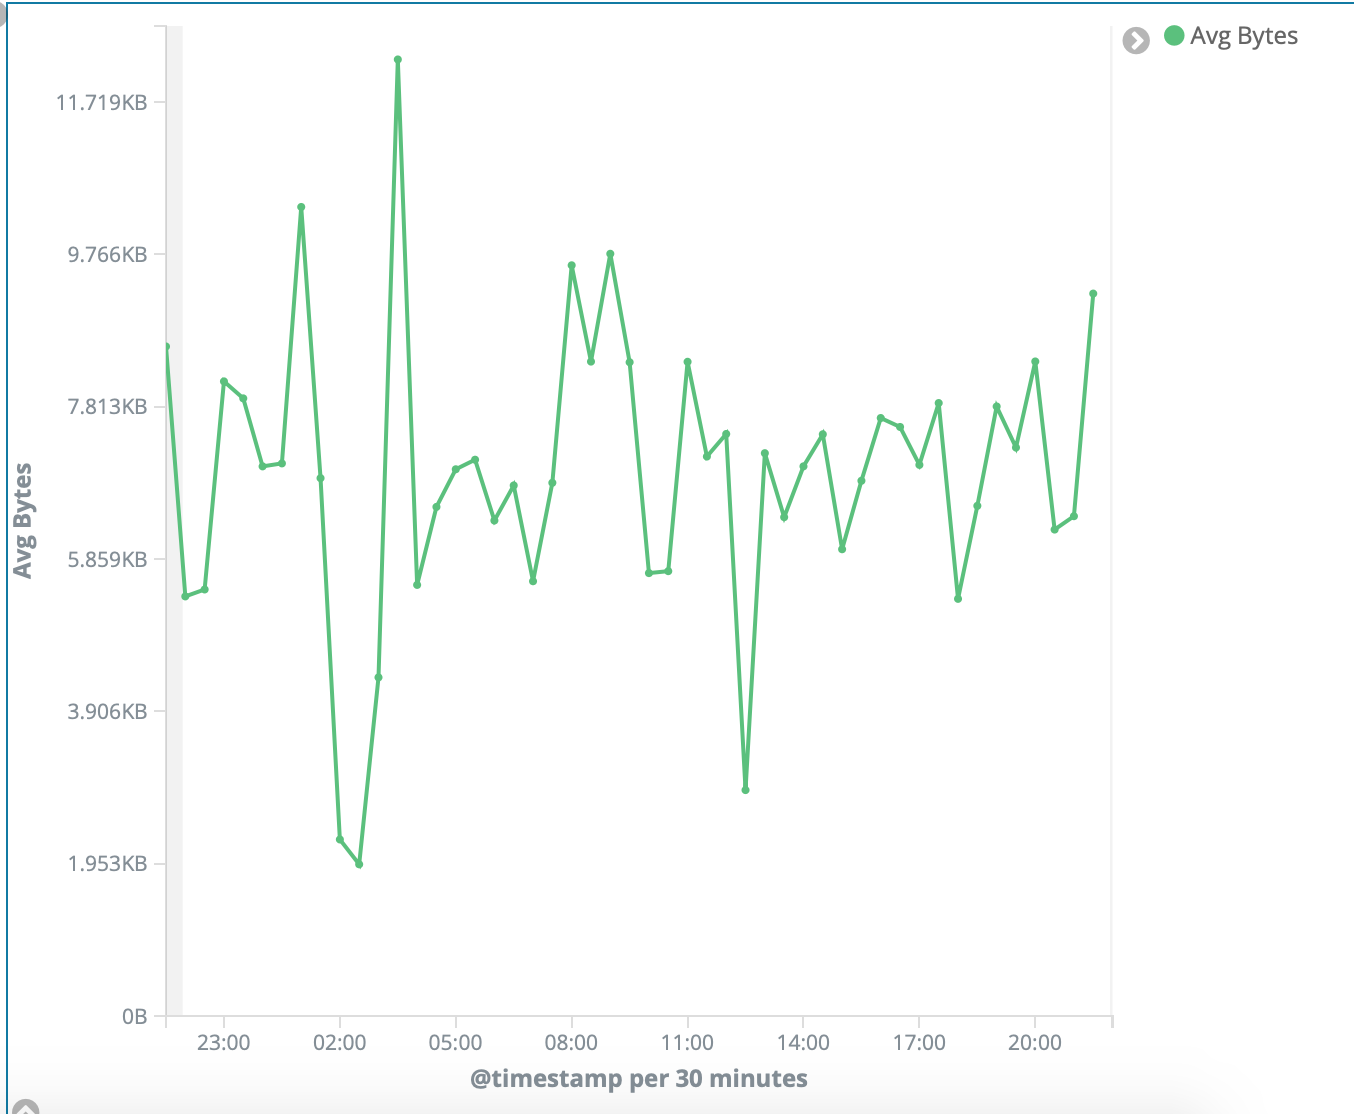
Average Bytes Returned
11
Tag Cloud with the City Names that Accessed my Blog
Pre-Requirements
I am consuming my nginx access logs with filebeat and shipping them to elasticsearch. You can check out this blogpost to set that up.
The GeoIP Processor plugin is installed on elasticsearch to enrich our data with geographical information. You can check out this blogpost to setup geoip.
Head over to Kibana, make sure that you have added the filebeat-* index patterns. If not, head over to Management -> Index Patterns -> Create Index -> Enter filebeat-* as you Index Pattern, select Next, select your @timestamp as your timestamp field, select create.
Now from the visualization section we will add 11 Visualizations. Everytime that you create a visualization, make sure that you select filebeat as your pattern (thats if you are using filebeat).
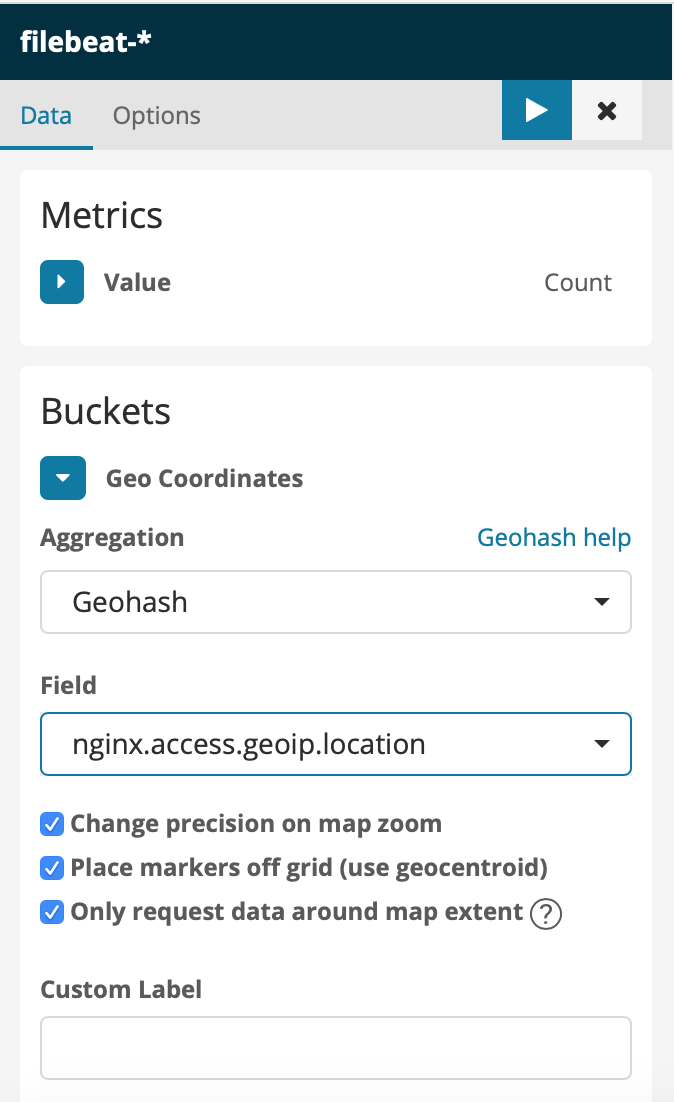
When configuring your visualization it will look like the configuration box from below:
Geomap: Map to see where people are connecting from
So when people are requesting pages that does not exist, it could most probably be bots trying to attack your site, or trying to gain access etc. This is a great view to see which ones are they trying and then you can handle it from there.
With timeseries data its great to see when there was a spike in status codes, when you identify the time, you can further investigate why that happened.
New Visualization: Timelion
1
.es(index=filebeat*, timefield='@timestamp', q=nginx.access.response_code:200).label('OK'), .es(index=filebeat*, timefield='@timestamp', q=nginx.access.response_code:404).label('Page Not Found')
Timeseries: Successfull Website Hits over Time
This is a good view to see how your website is serving traffic over time.
Line chart with the amount of bandwidth being transferred.
1234
New Visualization: Line

-> Metrics: Y-Axis, Aggregation: Average, Field: nginx.access.body_sent.bytes
-> Buckets: X-Axis, Aggregation: Date Histogram, Field: @timestamp
Tag Cloud with Most Popular Cities
I’ve used cities here, but its a nice looking visualization to group the most accessed fields. With server logs you can use this for the usernames failed in ssh attempts for example.
This is post 1 of my big collection of elasticsearch-tutorials which includes, setup, index, management, searching, etc. More details at the bottom.
In this tutorial we will setup a 5 node highly available elasticsearch cluster that will consist of 3 Elasticsearch Master Nodes and 2 Elasticsearch Data Nodes.
Master Nodes: Master nodes are responsible for Cluster related tasks, creating / deleting indexes, tracking of nodes, allocate shards to nodes, etc.
Data Nodes: Data nodes are responsible for hosting the actual shards that has the indexed data also handles data related operations like CRUD, search, and aggregations.
For more concepts of Elasticsearch, have a look at their basic-concepts documentation.
es-data-1: 10GB assigned to /dev/vdb
es-data-2: 10GB assigned to /dev/vdb
Authentication:
Note that I have configured the bind address for elasticsearch to 0.0.0.0 using network.host: 0.0.0.0 for this demonstration, but this means that if your server has a public ip address with no firewall rules or no auth, that anyone will be able to interact with your cluster.
This address will also be reachable for all nodes to see each other.
It’s advisable do protect your endpoint, either with basic auth using nginx which can be found in the embedded link, or using firewall rules to protect communication from the outside (depending on your setup)
Setup the Elasticsearch Master Nodes
The setup below how to provision a elasticsearch master node. Repeat this on node: es-master-1, es-master-2, es-master-3
Set your hosts file for name resolution (if you don’t have private dns in place):
The elasticsearch config, before we get to the full example config, I just want to show a snippet of how you could split up logs and data.
Note that you can seperate your logging between data/logs like this:
123456
# example of log splitting:
...
path:
  logs: /var/log/elasticsearch
  data: /var/data/elasticsearch
...
Also, your data can be divided between paths:
12345678
# example of data paths:
...
path:
  data:
    - /mnt/elasticsearch_1
    - /mnt/elasticsearch_2
    - /mnt/elasticsearch_3
...
Bootstrap the elasticsearch config with a cluster name (all the nodes should have the same cluster name), set the nodes as master node.master: true disable the node.data and specify that the cluster should at least have a minimum of 2 master nodes before it stops. This is used to prevent split brain.
To avoid a split brain, this setting should be set to a quorum of master-eligible nodes:
(master_eligible_nodes / 2) + 1
Ensure that pages are not swapped out to disk by requesting the JVM to lock the heap in memory by setting LimitMEMLOCK=infinity. Set the maxiumim file descriptor number for this process: LimitNOFILE and increase the number of threads using LimitNPROC:
1234567
$ vim /usr/lib/systemd/system/elasticsearch.service

[Service]
LimitMEMLOCK=infinity
LimitNOFILE=65535
LimitNPROC=4096
...
Increase the limit on the number of open files descriptors to user elasticsearch of 65536 or higher
Have a look at the nodes, you will see that the node.role for now shows mi:
12345
$ curl http://127.0.0.1:9200/_cat/nodes?v
ip heap.percent ram.percent cpu load_1m load_5m load_15m node.role master name
10.163.68.8 11 80 18 0.28 0.14 0.09 mi - es-master-2
10.163.68.5 14 80 14 0.27 0.18 0.11 mi * es-master-1
10.163.68.4 15 79 6 0.62 0.47 0.18 mi - es-master-3
Setup the Elasticsearch Data Nodes
Now that we have our 3 elasticsearch master nodes running, its time to provision the 2 elasticsearch data nodes. This setup needs to be repeated on both es-data-1 and es-data-2.
Since we attached an extra disk to our data nodes, verify that you can see the disk:
12345
$ lsblk
NAME MAJ:MIN RM SIZE RO TYPE MOUNTPOINT
vda 253:0 0 25G 0 disk
└─vda1 253:1 0 25G 0 part /
vdb 253:16 0 10G 0 disk <----
Provision the block device with xfs or anything else that you prefer, create the directory where elasticsearch data will reside, change the ownership that elasticsearch has permission to write/read, set the device on startup and mount the disk:
Bootstrap the elasticsearch config with a cluster name, set the node.name to an identifier, in this case I will use the servers hostname, set the node.master to false as this will be data nodes, also enable these nodes as data nodes: node.data: true, configure the path.data: /data to the path that we configured, etc:
Reload the systemd daemon, enable and start elasticsearch. Allow it to start and check if the ports are listening with netstat -tulpn | grep 9200, then:
Let’s ingest some data into elasticsearch, we will create an index named first-index with some dummy data about people, username, name, surname, location and hobbies:
Now that we ingested our data into elasticsearch, lets have a look at the Indices API, where the number of documents, size etc should reflect:
123
$ curl http://127.0.0.1:9200/_cat/indices?v
health status index uuid pri rep docs.count docs.deleted store.size pri.store.size
green open first-index 1o6yM7tCSqagqoeihKM7_g 5 1 3 0 40.6kb 20.3kb
Now lets request a search, which will give you by default 10 returned documents:
Let’s have a look at our shards using the Shards API, you will also see where each document is assigned to a specific shard, and also if its a primary or replica shard:
123456789101112
$ curl http://127.0.0.1:9200/_cat/shards?v
index shard prirep state docs store ip node
first-index 4 p STARTED 0 230b 10.163.68.7 es-data-2
first-index 4 r STARTED 0 230b 10.163.68.11 es-data-1
first-index 2 p STARTED 0 230b 10.163.68.7 es-data-2
first-index 2 r STARTED 0 230b 10.163.68.11 es-data-1
first-index 3 r STARTED 1 6.6kb 10.163.68.7 es-data-2
first-index 3 p STARTED 1 6.6kb 10.163.68.11 es-data-1
first-index 1 r STARTED 2 13kb 10.163.68.7 es-data-2
first-index 1 p STARTED 2 13kb 10.163.68.11 es-data-1
first-index 0 p STARTED 0 230b 10.163.68.7 es-data-2
first-index 0 r STARTED 0 230b 10.163.68.11 es-data-1
Then we can also use the Allocation API to see the size of our indices, disk space per node:
As I finish up the writing of these posts they will be published under the #elasticsearch-tutorials category on my blog and for any other elasticsearch tutorials, you can find them under the #elasticsearch category.