Ruan Bekker's Blog

From a Curious mind to Posts on Github

Install Concourse CI V6 on Ubuntu 20.04

Concourse is a Pipeline Based Continious Integration system written in Go

Resources:

Older Version

An older version is available:

What is Concourse CI:

Concourse CI is a Continious Integration Platform. Concourse enables you to construct pipelines with a yaml configuration that can consist out of 3 core concepts, tasks, resources, and jobs that compose them. For more information about this have a look at their docs

What will we be doing today

We will setup a Concourse CI Server v6.7.6 (web and worker) on Ubuntu 20.04 and run the traditional Hello, World pipeline

Setup the Server:

Concourse needs PostgresSQL server:

1
2
3
$ apt update && apt upgrade -y
$ apt install postgresql postgresql-contrib -y
$ systemctl enable postgresql

Create the Database and User for Concourse on Postgres:

1
2
$ sudo -u postgres createuser concourse
$ sudo -u postgres createdb --owner=concourse atc

Download the Concourse and Fly Cli Binaries:

1
2
3
4
5
6
$ wget https://github.com/concourse/concourse/releases/download/v6.7.6/concourse-6.7.6-linux-amd64.tgz
$ wget https://github.com/concourse/concourse/releases/download/v6.7.6/fly-6.7.6-linux-amd64.tgz
$ tar -xvf concourse-6.7.6-linux-amd64.tgz -C /usr/local/
$ tar -xvf fly-6.7.6-linux-amd64.tgz
$ mv fly /usr/bin/fly
$ rm -rf concourse-6.7.6-linux-amd64.tgz fly-6.7.6-linux-amd64.tgz

Create the Encryption Keys:

1
2
3
4
5
$ mkdir /etc/concourse
$ ssh-keygen -t rsa -q -N '' -f /etc/concourse/tsa_host_key
$ ssh-keygen -t rsa -q -N '' -f /etc/concourse/worker_key
$ ssh-keygen -t rsa -q -N '' -f /etc/concourse/session_signing_key
$ cp /etc/concourse/worker_key.pub /etc/concourse/authorized_worker_keys

Concourse Web Process Configuration:

1
2
3
4
5
6
7
8
9
10
11
12
13
$ cat /etc/concourse/web_environment

PATH=/usr/local/sbin:/usr/local/bin:/usr/sbin:/usr/bin:/sbin:/bin:/usr/local/concourse/bin
CONCOURSE_ADD_LOCAL_USER=ruan:pass
CONCOURSE_SESSION_SIGNING_KEY=/etc/concourse/session_signing_key
CONCOURSE_TSA_HOST_KEY=/etc/concourse/tsa_host_key
CONCOURSE_TSA_AUTHORIZED_KEYS=/etc/concourse/authorized_worker_keys
CONCOURSE_POSTGRES_HOST=127.0.0.1
CONCOURSE_POSTGRES_USER=concourse
CONCOURSE_POSTGRES_PASSWORD=concourse
CONCOURSE_POSTGRES_DATABASE=atc
CONCOURSE_MAIN_TEAM_LOCAL_USER=ruan
CONCOURSE_EXTERNAL_URL=http://10.20.30.40:8080 # replace this with your ip address

Concourse Worker Process Configuration:

1
2
3
4
5
6
7
8
$ cat /etc/concourse/worker_environment

PATH=/usr/local/sbin:/usr/local/bin:/usr/sbin:/usr/bin:/sbin:/bin:/usr/local/concourse/bin
CONCOURSE_WORK_DIR=/var/lib/concourse
CONCOURSE_TSA_HOST=127.0.0.1:2222
CONCOURSE_TSA_PUBLIC_KEY=/etc/concourse/tsa_host_key.pub
CONCOURSE_TSA_WORKER_PRIVATE_KEY=/etc/concourse/worker_key
CONCOURSE_GARDEN_DNS_SERVER=8.8.8.8

Create a Concourse user:

1
2
3
4
$ mkdir /var/lib/concourse
$ sudo adduser --system --group concourse
$ sudo chown -R concourse:concourse /etc/concourse /var/lib/concourse
$ sudo chmod 600 /etc/concourse/*_environment

Create SystemD Unit Files, first for the Web Service:

1
2
3
4
5
6
7
8
9
10
11
12
13
14
$ cat /etc/systemd/system/concourse-web.service

[Unit]
Description=Concourse CI web process (ATC and TSA)
After=postgresql.service

[Service]
User=concourse
Restart=on-failure
EnvironmentFile=/etc/concourse/web_environment
ExecStart=/usr/bin/concourse web

[Install]
WantedBy=multi-user.target

Then the SystemD Unit File for the Worker Service:

1
2
3
4
5
6
7
8
9
10
11
12
13
14
$ cat /etc/systemd/system/concourse-worker.service

[Unit]
Description=Concourse CI worker process
After=concourse-web.service

[Service]
User=root
Restart=on-failure
EnvironmentFile=/etc/concourse/worker_environment
ExecStart=/usr/bin/concourse worker

[Install]
WantedBy=multi-user.target

Create a postgres password for the concourse user:

1
2
3
4
$ cd /home/concourse/
$ sudo -u concourse psql atc
atc=> ALTER USER concourse WITH PASSWORD 'concourse';
atc=> \q

Start and Enable the Services:

1
2
3
4
5
6
7
$ systemctl start concourse-web concourse-worker
$ systemctl enable concourse-web concourse-worker postgresql
$ systemctl status concourse-web concourse-worker

$ systemctl is-active concourse-worker concourse-web
active
active

The listening ports should more or less look like the following:

1
2
3
4
5
6
7
8
9
10
11
12
13
14
15
16
$ netstat -tulpn

Active Internet connections (only servers)
Proto Recv-Q Send-Q Local Address           Foreign Address         State       PID/Program name
tcp        0      0 127.0.0.1:7777          0.0.0.0:*               LISTEN      4530/concourse
tcp        0      0 127.0.0.1:7788          0.0.0.0:*               LISTEN      4530/concourse
tcp        0      0 127.0.0.1:8079          0.0.0.0:*               LISTEN      4525/concourse
tcp        0      0 0.0.0.0:22              0.0.0.0:*               LISTEN      1283/sshd
tcp        0      0 127.0.0.1:5432          0.0.0.0:*               LISTEN      4047/postgres
tcp6       0      0 :::36159                :::*                    LISTEN      4525/concourse
tcp6       0      0 :::46829                :::*                    LISTEN      4525/concourse
tcp6       0      0 :::2222                 :::*                    LISTEN      4525/concourse
tcp6       0      0 :::8080                 :::*                    LISTEN      4525/concourse
tcp6       0      0 :::22                   :::*                    LISTEN      1283/sshd
udp        0      0 0.0.0.0:68              0.0.0.0:*                           918/dhclient
udp        0      0 0.0.0.0:42165           0.0.0.0:*                           4530/concourse

Client Side:

I will be using a the Fly cli from a Mac, so first we need to download the fly-cli for Mac:

1
2
3
4
$ wget https://github.com/concourse/concourse/releases/download/v6.7.6/fly-6.7.6-darwin-amd64.tgz
$ tar -xvf fly-6.7.6-darwin-amd64.tgz
$ sudo mv fly /usr/local/bin/fly
$ rm -rf fly-6.7.6-darwin-amd64.tgz

Next, we need to setup our Concourse Target by Authenticating against our Concourse Endpoint, lets setup our target with the name ci, and make sure to replace the ip address with the ip of your concourse server:

1
2
3
4
5
6
7
8
9
$ fly -t ci login -c http://10.20.30.40:8080
logging in to team 'main'

navigate to the following URL in your browser:

  http://10.20.30.40:8080/login?fly_port=42181

or enter token manually (input hidden):
target saved

Lets list our targets:

1
2
3
$ fly targets
name  url                        team  expiry
ci    http://10.20.30.40:8080    main  Wed, 08 Nov 2021 15:32:59 UTC

Listing Registered Workers:

1
2
3
$ fly -t ci workers
name              containers  platform  tags  team  state    version
10.20.30.40       0           linux     none  none  running  1.2

Listing Active Containers:

1
2
$ fly -t ci containers
handle                                worker            pipeline     job            build #  build id  type   name                  attempt

Hello World Pipeline:

Let’s create a basic pipeline, that will print out Hello, World!:

Our hello-world.yml

1
2
3
4
5
6
7
8
9
10
11
12
13
14
15
16
17
18
19
jobs:
- name: my-job
  plan:
  - task: say-hello
    config:
      platform: linux
      image_resource:
        type: docker-image
        source:
          repository: alpine
          tag: edge
      run:
        path: /bin/sh
        args:
        - -c
        - |
          echo "============="
          echo "Hello, World!"
          echo "============="

Applying the configuration to our pipeline:

1
2
3
4
5
6
7
8
9
10
11
12
13
14
15
16
17
18
19
20
21
22
23
24
25
26
27
28
29
$ fly -t ci set-pipeline -p yeeehaa -c hello-world.yml
jobs:
  job my-job has been added:
    name: my-job
    plan:
    - task: say-hello
      config:
        platform: linux
        image_resource:
          type: docker-image
          source:
            repository: alpine
            tag: edge
        run:
          path: /bin/sh
          args:
          - -c
          - |
            echo "============="
            echo "Hello, World!"
            echo "============="

apply configuration? [yN]: y
pipeline created!
you can view your pipeline here: http://10.20.30.40:8080/teams/main/pipelines/yeeehaa

the pipeline is currently paused. to unpause, either:
  - run the unpause-pipeline command
  - click play next to the pipeline in the web ui

We can browse to the WebUI to unpause the pipeline, but since I like to do everything on cli as far as possible, I will unpause the pipeline via cli:

1
2
$ fly -t ci unpause-pipeline -p yeeehaa
unpaused 'yeeehaa'

Now our Pipeline is unpaused, but since we did not specify any triggers, we need to manually trigger the pipeline to run, you can either via the WebUI, select your pipeline which in this case will be named yeeehaa and then select the job, which will be my-job then hit the + sign, which will trigger the pipeline.

I will be using the cli:

1
2
$ fly -t ci trigger-job --job yeeehaa/my-job
started yeeehaa/my-job #1

Via the WebUI on http://10.20.30.40:8080/teams/main/pipelines/yeeehaa/jobs/my-job/builds/1 you should see the Hello, World! output, or via the cli, we also have the option to see the output, so let’s trigger it again, but this time passing the --watch flag:

1
2
3
4
5
6
7
8
9
10
11
12
$ fly -t ci trigger-job --job yeeehaa/my-job --watch
started yeeehaa/my-job #2

initializing
running /bin/sh -c echo "============="
echo "Hello, World!"
echo "============="

=============
Hello, World!
=============
succeeded

Listing our Workers and Containers again:

1
2
3
4
5
6
7
$ fly -t ci workers
name              containers  platform  tags  team  state    version
10.20.30.40       2           linux     none  none  running  1.2

$ fly -t ci containers
handle                                worker            pipeline     job         build #  build id  type   name           attempt
36982955-54fd-4c1b-57b8-216486c58db8  10.20.30.40       yeeehaa      my-job      2        729       task   say-hello      n/a

Wireguard VPN With Unbound ADS Blocking DNS

In this tutorial we will setup a Wireguard VPN with Unbound DNS Server with some additional configuration to block ads for any clients using the DNS Server while connected to the VPN.

A massive thank you to complexorganizations for providing the source where this tuturial is based off.

Install Packages

I will be using Debian Buster for this installation:

1
2
3
4
$ apt update
$ apt upgrade -y
$ apt update && apt install iptables curl coreutils bc jq sed e2fsprogs -y
$ apt install linux-headers-"$(uname -r)" -y

I want to disable IPv6, in my case I had to apply a couple of kernel parameter tweaks:

1
2
3
4
5
$ echo net.ipv6.conf.all.disable_ipv6 = 1 > /etc/sysctl.d/70-disable-ipv6.conf
$ echo "net.ipv6.conf.$(ip -4 route ls | grep default | grep -Po '(?<=dev )(\S+)' | head -1).disable_ipv6 = 1" >> /etc/sysctl.d/70-disable-ipv6.conf
$ echo 'net.ipv4.ip_forward = 1' > /etc/sysctl.d/60-enable-ip-forwarding.conf
$ sysctl -p -f /etc/sysctl.d/70-disable-ipv6.conf
$ sysctl -p -f /etc/sysctl.d/60-enable-ip-forwarding.conf

Environment Variables

A couple of environment variables that we will reference during our installation, tweak where your setup differs:

1
2
3
4
5
6
7
8
9
10
11
$ export NPROC=$(nproc)
$ export SERVER_HOST=$(curl -s -4 ifconfig.co)
$ export SERVER_PORT="51820"
$ export MTU_CHOICE="1280"
$ export NAT_CHOICE="25"
$ export IPV4_SUBNET="10.7.0.0/24"
$ export PRIVATE_SUBNET_V4=${IPV4_SUBNET}
$ export GATEWAY_ADDRESS_V4="${PRIVATE_SUBNET_V4::-4}1"
$ export PRIVATE_SUBNET_MASK_V4=$(echo "$PRIVATE_SUBNET_V4" | cut -d "/" -f 2)
$ export CLIENT_DNS="$GATEWAY_ADDRESS_V4"
$ export CLIENT_ALLOWED_IP="0.0.0.0/0"

Unbound Installation

Download the unbound root.hints file from internic:

1
$ curl https://www.internic.net/domain/named.cache --create-dirs -o /etc/unbound/root.hints

Generate the /etc/unbound/unbound.conf config:

1
2
3
4
5
6
7
8
9
10
11
12
13
14
15
16
17
18
19
20
21
22
23
24
25
26
27
28
29
$ echo "include: \"/etc/unbound/unbound.conf.d/*.conf\"
server:
    num-threads: $NPROC
    verbosity: 1
    root-hints: /etc/unbound/root.hints
    # auto-trust-anchor-file: /var/lib/unbound/root.key
    interface: 0.0.0.0
    interface: ::0
    max-udp-size: 3072
    access-control: 0.0.0.0/0                 refuse
    access-control: $PRIVATE_SUBNET_V4               allow
    access-control: 127.0.0.1                 allow
    private-address: $PRIVATE_SUBNET_V4
    hide-identity: yes
    hide-version: yes
    harden-glue: yes
    harden-dnssec-stripped: yes
    harden-referral-path: yes
    unwanted-reply-threshold: 10000000
    val-log-level: 1
    cache-min-ttl: 1800
    cache-max-ttl: 14400
    prefetch: yes
    qname-minimisation: yes
    prefetch-key: yes
    forward-zone:
        name: \".\"
        forward-addr: 1.1.1.1
        forward-addr: 8.8.8.8" >> /etc/unbound/unbound.conf

Download the host entries for all the ad servers which we will block:

1
$ curl https://raw.githubusercontent.com/StevenBlack/hosts/master/alternates/social/hosts -o /tmp/adblocking_hosts

Include the ads configuration in /etc/unbound/unbound.d/ads.conf:

1
2
$ echo "server:" > /etc/unbound/unbound.conf.d/ads.conf
$ cat /etc/unbound/adblocking_hosts | grep '^0\.0\.0\.0' | awk '{print "    local-zone: \""$2"\" redirect\n    local-data: \""$2" A 0.0.0.0\""}' >> /etc/unbound/unbound.conf.d/ads.conf

Update the VPN Server’s nameserver configuration to unbound:

1
2
3
4
$ chattr -i /etc/resolv.conf
$ mv /etc/resolv.conf /etc/resolv.conf.old
$ echo "nameserver 127.0.0.1" >>/etc/resolv.conf
$ chattr +i /etc/resolv.conf

Enable and Restart Unbound:

1
2
$ systemctl enable unbound
$ systemctl restart unbound

Test if DNS Resolution works:

1
$ dig google.com

Wireguard Installation

Include the sources and install wireguard and its dependencies:

1
2
3
4
$ echo "deb http://deb.debian.org/debian/ unstable main" >>/etc/apt/sources.list.d/unstable.list
$ echo -e "Package: *\nPin: release a=unstable\nPin-Priority: 90"  >>/etc/apt/preferences.d/limit-unstable
$ apt update
$ apt install wireguard qrencode haveged ifupdown -y

Set the environment variables and tweak where you need to:

1
2
3
4
5
6
7
8
9
10
$ export SERVER_PRIVKEY=$(wg genkey)
$ export SERVER_PUBKEY=$(echo "$SERVER_PRIVKEY" | wg pubkey)
$ export CLIENT_NAME="ruan-pc"
$ export CLIENT_PRIVKEY=$(wg genkey)
$ export CLIENT_PUBKEY=$(echo "$CLIENT_PRIVKEY" | wg pubkey)
$ export CLIENT_ADDRESS_V4="${PRIVATE_SUBNET_V4::-4}3"
$ export PRESHARED_KEY=$(wg genpsk)
$ export WIREGUARD_PUB_NIC="wg0"
$ export PEER_PORT=$(shuf -i1024-65535 -n1)
$ export WG_CONFIG="/etc/wireguard/$WIREGUARD_PUB_NIC.conf"

Create the wireguard clients directory and create the config filename:

1
2
$ mkdir -p /etc/wireguard/clients
$ touch $WG_CONFIG && chmod 600 $WG_CONFIG

Create the wireguard server config content and write it to the config file:

1
2
3
4
5
6
7
8
9
10
11
12
13
14
$ echo "# $PRIVATE_SUBNET_V4 $SERVER_HOST:$SERVER_PORT $SERVER_PUBKEY $CLIENT_DNS $MTU_CHOICE $NAT_CHOICE $CLIENT_ALLOWED_IP
[Interface]
Address = $GATEWAY_ADDRESS_V4/$PRIVATE_SUBNET_MASK_V4
ListenPort = $SERVER_PORT
PrivateKey = $SERVER_PRIVKEY
PostUp = iptables -A FORWARD -i $WIREGUARD_PUB_NIC -o $SERVER_PUB_NIC -j ACCEPT; iptables -t nat -A POSTROUTING -o $SERVER_PUB_NIC -j MASQUERADE; iptables -A INPUT -s $PRIVATE_SUBNET_V4 -p udp -m udp --dport 53 -m conntrack --ctstate NEW -j ACCEPT
PostDown = iptables -D FORWARD -i $WIREGUARD_PUB_NIC  -o $SERVER_PUB_NIC -j ACCEPT; iptables -t nat -D POSTROUTING -o $SERVER_PUB_NIC -j MASQUERADE; iptables -D INPUT -s $PRIVATE_SUBNET_V4 -p udp -m udp --dport 53 -m conntrack --ctstate NEW -j ACCEPT
SaveConfig = false
# $CLIENT_NAME start
[Peer]
PublicKey = $CLIENT_PUBKEY
PresharedKey = $PRESHARED_KEY
AllowedIPs = $CLIENT_ADDRESS_V4/32
# $CLIENT_NAME end >>" >> $WG_CONFIG

Create the client config:

1
2
3
4
5
6
7
8
9
10
11
12
13
$ echo "# $CLIENT_NAME
[Interface]
Address = $CLIENT_ADDRESS_V4/$PRIVATE_SUBNET_MASK_V4
DNS = $CLIENT_DNS
ListenPort = $PEER_PORT
MTU = $MTU_CHOICE
PrivateKey = $CLIENT_PRIVKEY
[Peer]
AllowedIPs = $CLIENT_ALLOWED_IP
Endpoint = $SERVER_HOST:$SERVER_PORT
PersistentKeepalive = $NAT_CHOICE
PresharedKey = $PRESHARED_KEY
PublicKey = $SERVER_PUBKEY" >> /etc/wireguard/clients/"$CLIENT_NAME"-$WIREGUARD_PUB_NIC.conf

Restart and Enable Wireguard:

1
2
$ systemctl enable wg-quick@$WIREGUARD_PUB_NIC
$ systemctl restart wg-quick@$WIREGUARD_PUB_NIC

Connect your Client

Head over to Wireguard.com and install the client of your choice then generate a QR Code:

1
$ qrencode -t ansiutf8 -l L </etc/wireguard/clients/"$CLIENT_NAME"-$WIREGUARD_PUB_NIC.conf

Configure your client and connect to the VPN, after the connection has been established you can have a look on the server for connection details with:

1
$ wg show

Once connected head over to a website with ads, such as https://www.speedtest.net/ and you should see no ads.

Thanks

Thanks for reading, if you like my content, check out my website or follow me at @ruanbekker on Twitter.

SSH Using AWS SSM Session Manager

You can use SSM Session Manager to connect to your EC2 instances, as long as your EC2 instance has the associated IAM Role which includes the AmazonSSMManagedInstanceCore managed policy.

AWS EC2 Console

Head over to “Connect” and select “Session Manager”:

image

You should get a shell:

image

AWS CLI

You can also use the CLI:

1
aws --profile prod ssm start-session --target i-0ebba722b102179b6

If you get this error:

image

Head over to:

https://docs.aws.amazon.com/systems-manager/latest/userguide/session-manager-working-with-install-plugin.html

Install the session manager plugin, for Mac:

1
2
3
4
$ curl "https://s3.amazonaws.com/session-manager-downloads/plugin/latest/mac/sessionmanager-bundle.zip" -o "sessionmanager-bundle.zip"
$ unzip sessionmanager-bundle.zip
$ sudo ./sessionmanager-bundle/install -i /usr/local/sessionmanagerplugin -b /usr/local/bin/session-manager-plugin
$ rm -rf sessionmanager-bundle

After installation:

1
2
3
4
5
6
$ aws --profile prod ssm start-session --target i-0ebba722b102179b6
Starting session with SessionId: ruan.bekker-0b07cbbe261885ad3

sh-4.2$ sudo su - ec2-user
Last login: Wed Jan  6 12:55:03 UTC 2021 on pts/0
[ec2-user@ip-172-31-23-246 ~]$

Note: when you are using ssm session manager you don’t require security groups or a direct routable network to your instance.

Bash Functions FTW

You can implement this into a bash function:

1
2
3
4
5
6
7
8
9
10
$ cat ~/.functions.aws
aws-ssh(){
  instance_name=${1}
  instance_id=$(aws --profile prod ec2 describe-instances --filter "Name=tag:Name,Values=${instance_name}" --query "Reservations[].Instances[?State.Name == 'running'].InstanceId[]" --output text)
  aws --profile prod ssm start-session --target ${instance_id}
}

$ aws-ssh ssm-session-manager-ssh-test2
Starting session with SessionId: ruan.bekker-04daf56c5f3668790
sh-4.2$

If you have your own SSH key, you can use this ~/.ssh/config:

1
2
3
# AWS SSM Session Manager
Host i-*
    ProxyCommand sh -c "aws --profile prod ssm start-session --target %h --document-name AWS-StartSSHSession --parameters 'portNumber=%p'"
1
2
3
4
5
6
7
8
9
10
$ ssh -i ~/.ssh/infra.pem ec2-user@i-0ebba722b102179b6
Warning: Permanently added 'i-0ebba722b102179b6' (ECDSA) to the list of known hosts.
Last login: Wed Jan  6 13:04:03 2021

       __|  __|_  )
       _|  (     /   Amazon Linux 2 AMI
      ___|\___|___|

https://aws.amazon.com/amazon-linux-2/
[ec2-user@ip-172-31-23-246 ~]$

Related:

Thanks

Thanks for reading, if you like my content, check out my website or follow me at @ruanbekker on Twitter.

Bypass the Medium Paywall System

Do you like reading stories on medium.com but not a big fan of the paywall system?

image

Copy the link, DM yourself on twitter and paste the link:

image

Click on the pasted link, and enjoy:

image

Generate Grafana Loki Log Links From Metric Label Values

In this tutorial we will generate Loki Log links from selected dropdown template variables in a Grafana Dashboard.

Context

To give more context, we have a Grafana Dashboard with all our services, and when you select that service you see all the metrics of that service, now if you want to see the logs of that service, the selected label values will be parsed to a log link which you can click and it will take you to the Loki Explorer and parse the label values to the log link, so your logql will already be generated for you.

In order to achieve this, our metrics and logs need to share the same labels and label values (environment, container_name) etc.
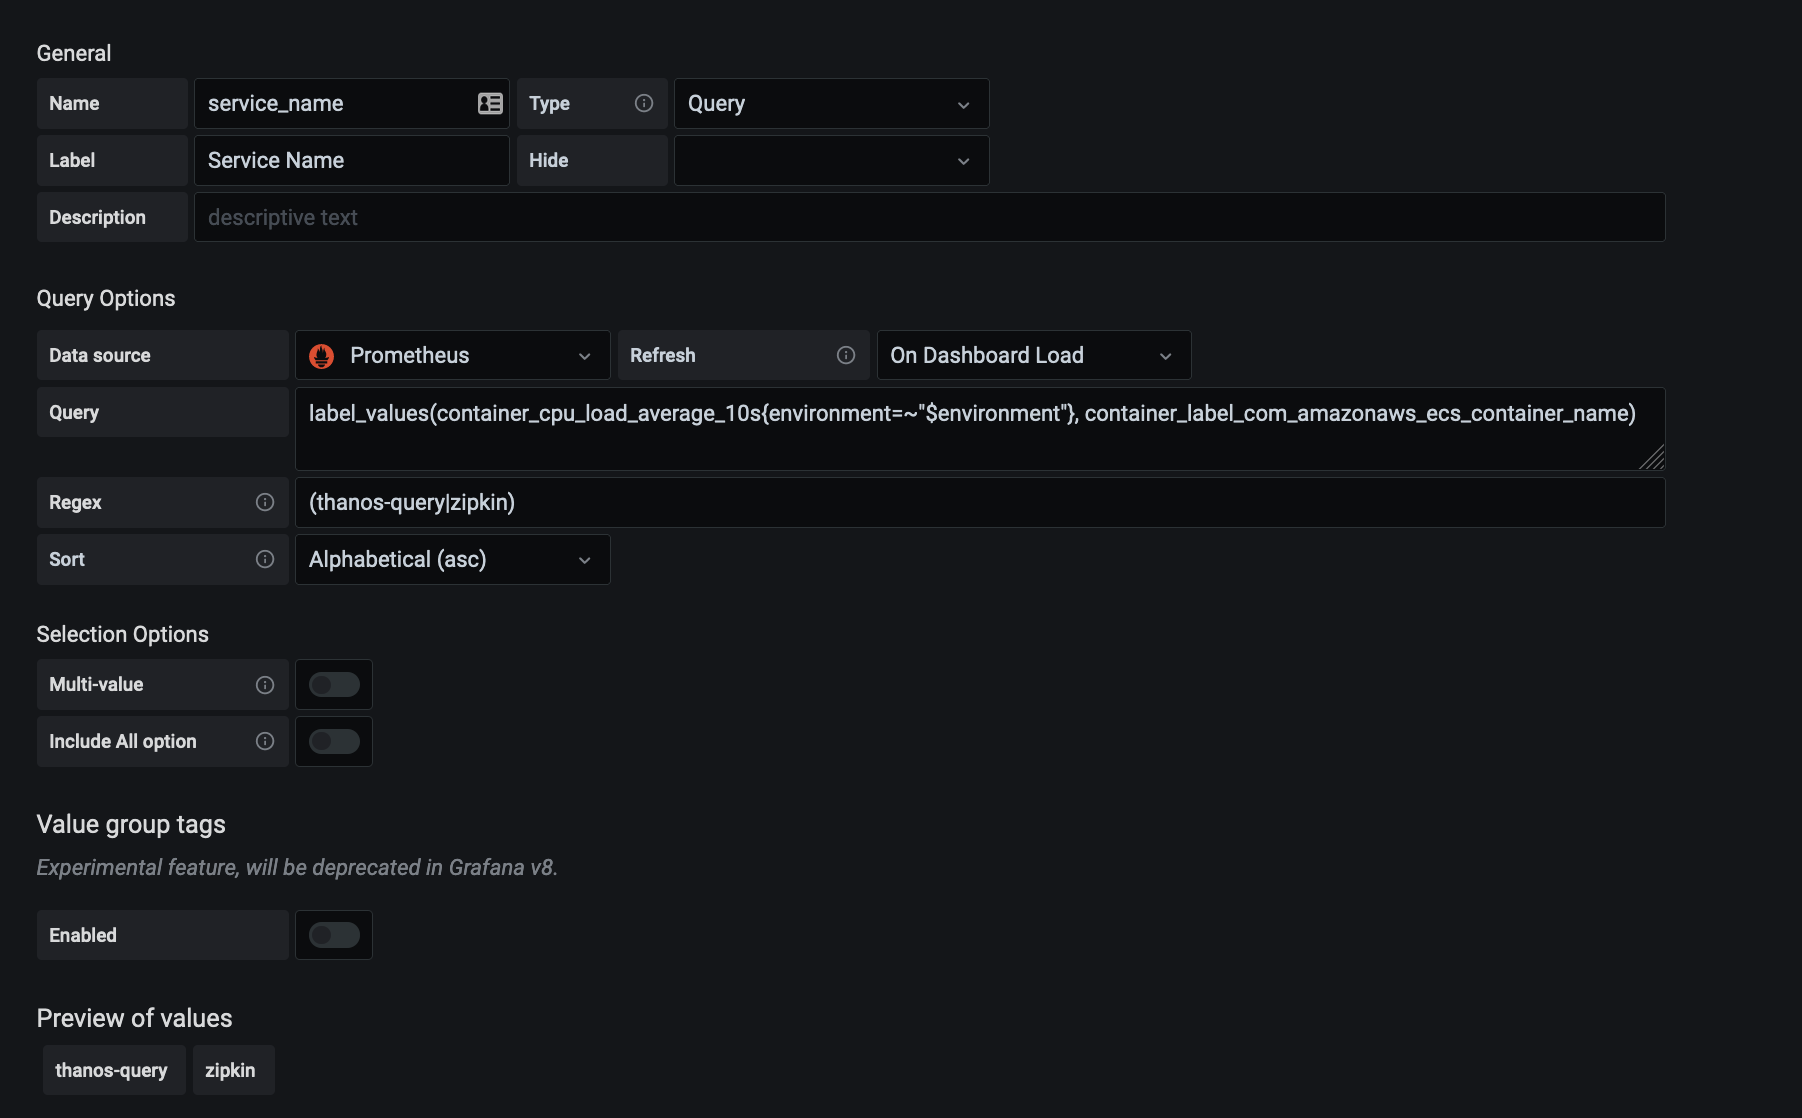
Dashboard Variables

First we have our environment variable:

image

And here we have our service variable:

image

Then for our container_name we have:

image

Notice the /^(.*?)-[0-9]/ thats just to strip the end, if we remove it it will be:

image

Grafana Dashboard

Now when we select the environment, service, we get presented with a Loki LogURL:

image

If we look at our dashboard links, under the dashboard settings:

image

The Logs Uri is:

1
https://grafana.mydomain.com/explore?orgId=1&left=%5B%22now-1h%22,%22now%22,%22Loki%22,%7B%22expr%22:%22%7Bcontainer_name%3D~%5C%22.*$container_name.*%5C%22%7D%22%7D,%7B%22mode%22:%22Logs%22%7D,%7B%22ui%22:%5Btrue,true,true,%22none%22%5D%7D%5D

Now when we select our label values from the dropdown for our service and we follow the link we will get:

image

Visualize Weather Data With Grafana and the DHT22 Sensor

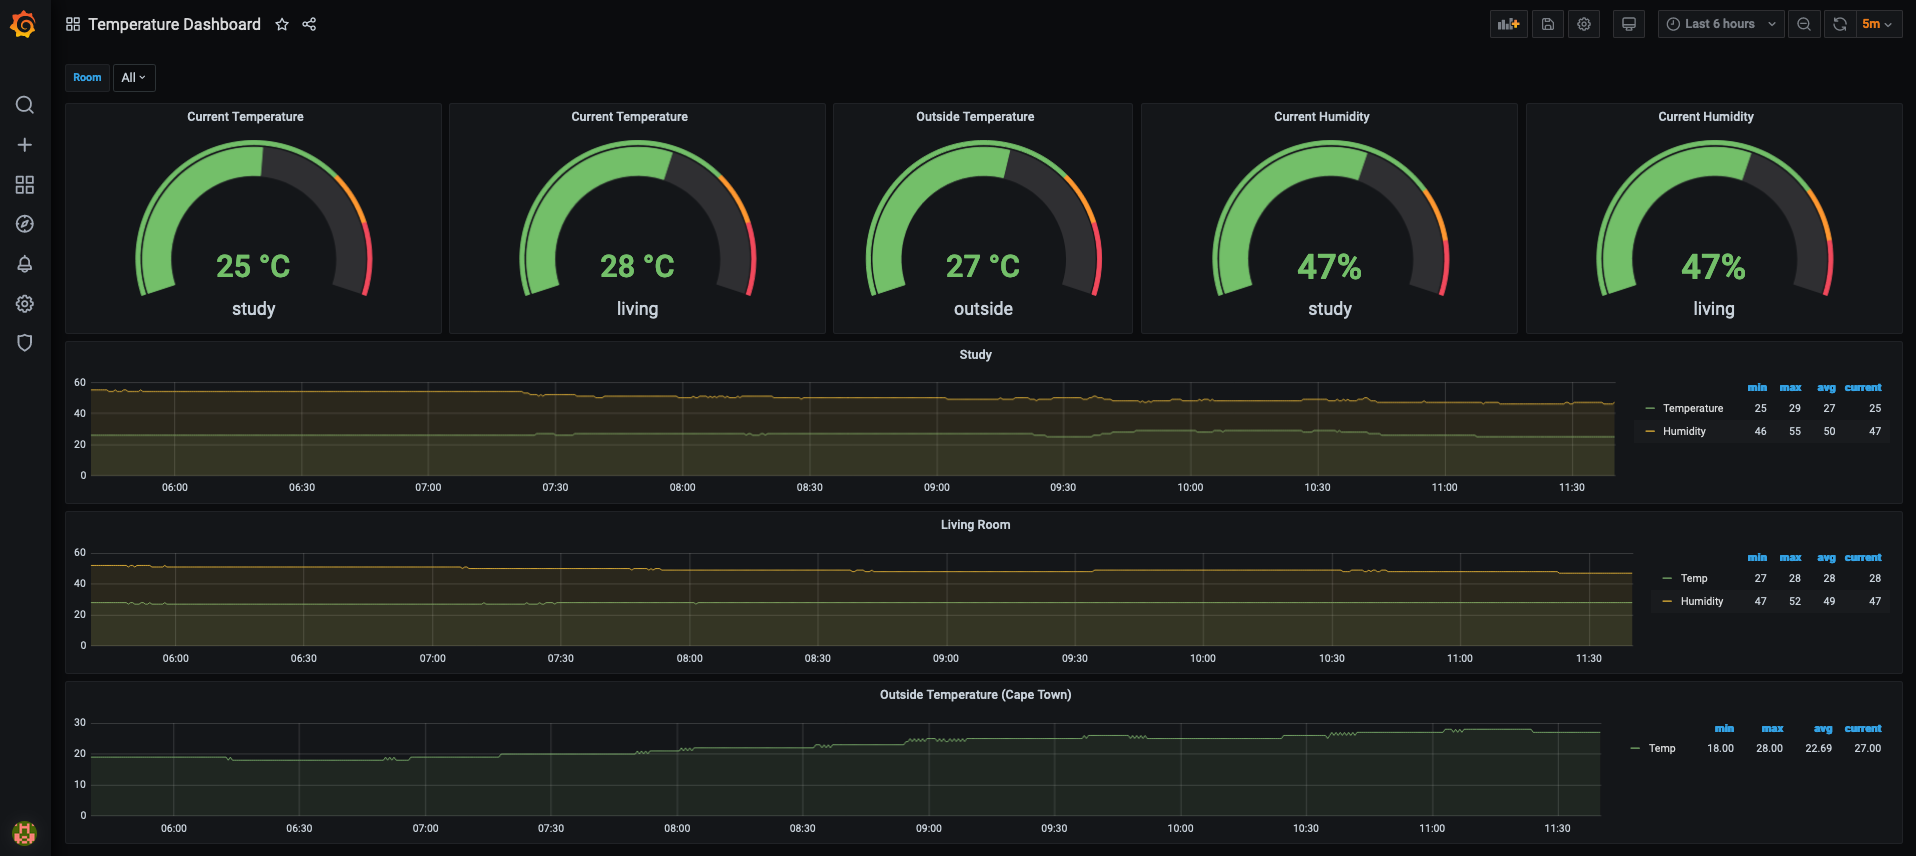
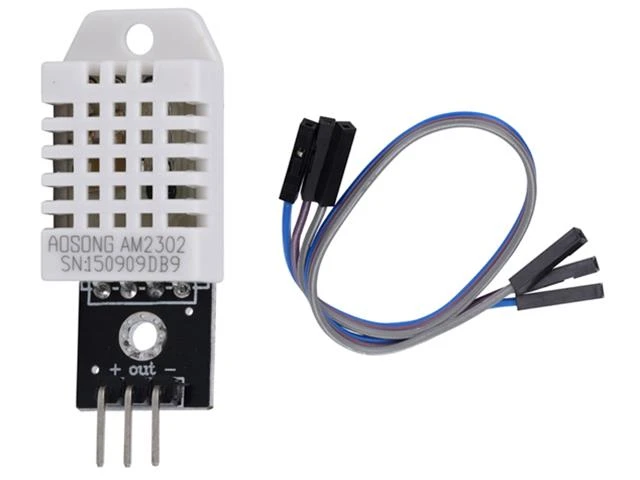
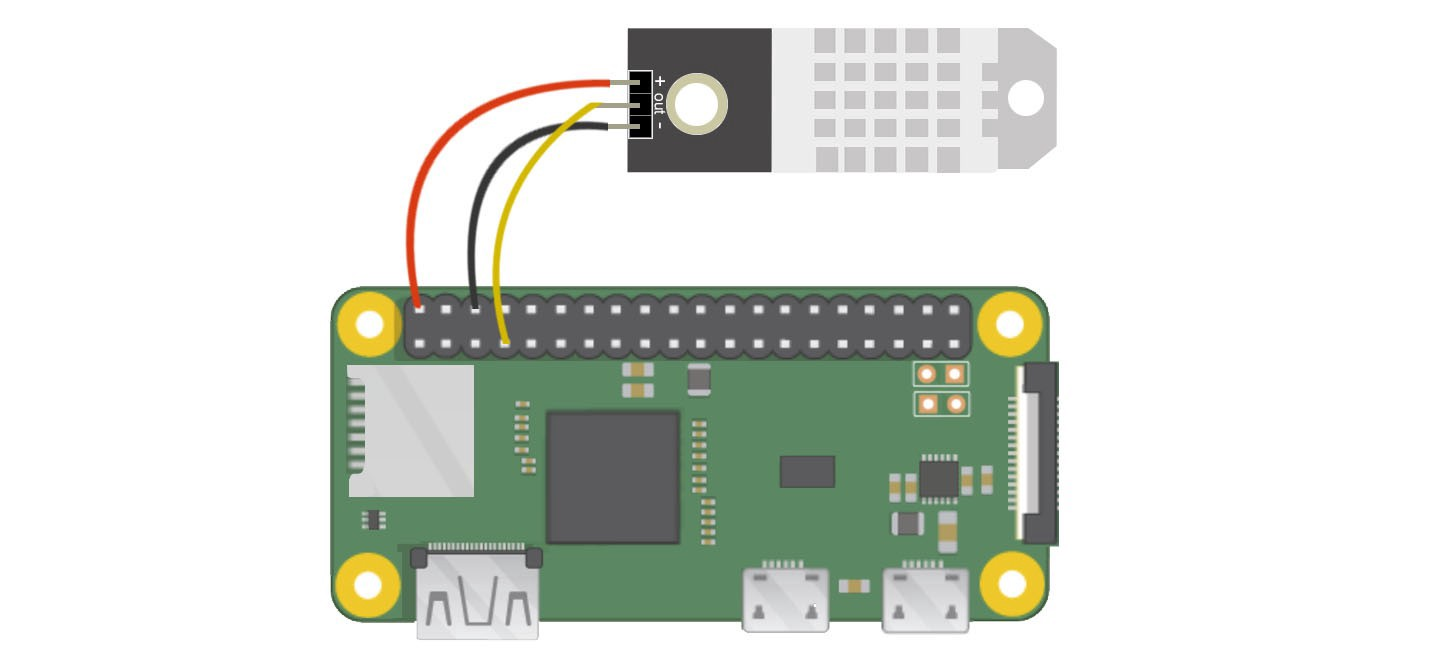
In this tutorial, we will connect the DHT22 sensor to the Raspberry Pi Zero via the GPIO pins to measure temperature and humidity and visualize it with Grafana.

Note: This post was originally posted on my RaspberryPi Blog

Then we will write a Python exporter for prometheus to expose our metrics so that we can visualize it in Grafana.

The Endgoal

image

The Hardware

This is how the sensor looks like (I got it from Communica)

image

Connecting the Sensor

You can use the following graphic to connect your sensor to your raspberry pi:

image

Installing Software

To install the required software, we will be using pip:

1
$ pip3 install Adafruit_DHT --user

Once we installed the software we can configure it

Interact with the Sensor

Enter your python interpreter:

1
2
$ python3
>>>

Then import the library, and get the current temperature and humidity:

1
2
3
4
5
6
7
8
>>> import Adafruit_DHT as dht
>>> humidity, temperature = dht.read_retry(dht.DHT22, 4)
>>> humidity = format(humidity, ".2f") + "%"
>>> humidity
'47.20%'
>>> temperature = format(temperature, ".2f") + "C"
>>> temperature
'29.10C'

Let’s create a python script for it:

1
2
3
4
5
6
7
8
9
10
11
12
13
14
15
$ cat temps.py
#!/usr/bin/env python3

import Adafruit_DHT as dht_sensor
import time

def get_temperature_readings():
    humidity, temperature = dht_sensor.read_retry(dht_sensor.DHT22, 4)
    humidity = format(humidity, ".2f") + "%"
    temperature = format(temperature, ".2f") + "C"
    return {"temperature": temperature, "humidity": humidity}

while True:
    print(get_temperature_readings())
    time.sleep(30)

And run it:

1
2
3
4
5
6
$ python3 temps.py
{'temperature': '28.00C', 'humidity': '47.40%'}
{'temperature': '28.00C', 'humidity': '47.30%'}
{'temperature': '28.00C', 'humidity': '47.70%'}
{'temperature': '28.00C', 'humidity': '47.40%'}
{'temperature': '28.00C', 'humidity': '47.60%'}

Visualize with Grafana

Let’s visualize our data with Grafana. For this, we need to write an exporter so that Prometheus can scrape the data.

Let’s create a python flask application with the prometheus client library for python to expose the metrics to prometheus with a /metrics endpoint.

Note: I have used OpenWeatherMap’s API to get the outside temperature for my location.

1
2
3
4
5
6
7
8
9
10
11
12
13
14
15
16
17
18
19
20
21
22
23
24
25
26
27
28
29
30
31
32
33
34
35
36
37
38
39
40
41
42
43
44
45
46
47
48
49
50
51
52
53
54
55
56
57
58
59
60
61
62
63
64
65
$ cat flask_temps.py
#!/usr/bin/env python3

import Adafruit_DHT as dht_sensor
import time
from flask import Flask, Response
from prometheus_client import Counter, Gauge, start_http_server, generate_latest
import requests

params = {"lat": "-xx.xxxxx", "lon": "xx.xxxx", "units": "metric", "appid": "your-api-key"}
baseurl = "https://api.openweathermap.org/data/2.5/weather"
content_type = str('text/plain; version=0.0.4; charset=utf-8')

def get_temperature_readings():
    humidity, temperature = dht_sensor.read_retry(dht_sensor.DHT22, 4)
    humidity = format(humidity, ".2f")
    temperature = format(temperature, ".2f")
    outside_temp = get_outside_weather()
    if all(v is not None for v in [humidity, temperature, outside_temp]):
        response = {"temperature": temperature, "humidity": humidity, "outside_temp": outside_temp}
        return response
    else:
        time.sleep(0.2)
        humidity, temperature = dht_sensor.read_retry(dht_sensor.DHT22, 4)
        humidity = format(humidity, ".2f")
        temperature = format(temperature, ".2f")
        outside_temp = get_outside_weather()
        response = {"temperature": temperature, "humidity": humidity, "outside_temp": outside_temp}
        return response

def get_outside_weather():
    response = requests.get(baseurl, params=params)
    temp = response.json()['main']['temp']
    return temp

app = Flask(__name__)

current_humidity = Gauge(
        'current_humidity',
        'the current humidity percentage, this is a gauge as the value can increase or decrease',
        ['room']
)

current_temperature = Gauge(
        'current_temperature',
        'the current temperature in celsius, this is a gauge as the value can increase or decrease',
        ['room']
)

current_temperature_outside = Gauge(
        'current_temperature_outside',
        'the current outside temperature in celsius, this is a gauge as the value can increase or decrease',
        ['location']
)

@app.route('/metrics')
def metrics():
    metrics = get_temperature_readings()
    current_humidity.labels('study').set(metrics['humidity'])
    current_temperature.labels('study').set(metrics['temperature'])
    current_temperature_outside.labels('za_ct').set(metrics['outside_temp'])
    return Response(generate_latest(), mimetype=content_type)

if __name__ == '__main__':
    app.run(host='0.0.0.0', port=5000)

Then install the flask and prometheus_client package:

1
$ python3 -m pip install flask prometheus_client --user

When you run the program, you should be able to retrieve metrics from the exporter by making a request on port 5000 on the /metrics request path:

1
2
3
4
5
6
7
8
9
10
11
12
13
14
15
16
17
18
19
20
21
22
23
24
25
26
27
28
29
30
31
32
33
34
35
36
37
38
39
40
41
42
43
44
45
46
$ curl http://localhost:5000/metrics
# HELP python_gc_objects_collected_total Objects collected during gc
# TYPE python_gc_objects_collected_total counter
python_gc_objects_collected_total{generation="0"} 646.0
python_gc_objects_collected_total{generation="1"} 129.0
python_gc_objects_collected_total{generation="2"} 0.0
# HELP python_gc_objects_uncollectable_total Uncollectable object found during GC
# TYPE python_gc_objects_uncollectable_total counter
python_gc_objects_uncollectable_total{generation="0"} 0.0
python_gc_objects_uncollectable_total{generation="1"} 0.0
python_gc_objects_uncollectable_total{generation="2"} 0.0
# HELP python_gc_collections_total Number of times this generation was collected
# TYPE python_gc_collections_total counter
python_gc_collections_total{generation="0"} 104.0
python_gc_collections_total{generation="1"} 9.0
python_gc_collections_total{generation="2"} 0.0
# HELP python_info Python platform information
# TYPE python_info gauge
python_info{implementation="CPython",major="3",minor="7",patchlevel="3",version="3.7.3"} 1.0
# HELP process_virtual_memory_bytes Virtual memory size in bytes.
# TYPE process_virtual_memory_bytes gauge
process_virtual_memory_bytes 4.4761088e+07
# HELP process_resident_memory_bytes Resident memory size in bytes.
# TYPE process_resident_memory_bytes gauge
process_resident_memory_bytes 2.7267072e+07
# HELP process_start_time_seconds Start time of the process since unix epoch in seconds.
# TYPE process_start_time_seconds gauge
process_start_time_seconds 1.61044381853e+09
# HELP process_cpu_seconds_total Total user and system CPU time spent in seconds.
# TYPE process_cpu_seconds_total counter
process_cpu_seconds_total 5.86
# HELP process_open_fds Number of open file descriptors.
# TYPE process_open_fds gauge
process_open_fds 6.0
# HELP process_max_fds Maximum number of open file descriptors.
# TYPE process_max_fds gauge
process_max_fds 1024.0
# HELP current_humidity the current humidity percentage, this is a gauge as the value can increase or decrease
# TYPE current_humidity gauge
current_humidity{room="study"} 47.0
# HELP current_temperature the current temperature in celsius, this is a gauge as the value can increase or decrease
# TYPE current_temperature gauge
current_temperature{room="study"} 25.7
# HELP current_temperature_outside the current outside temperature in celsius, this is a gauge as the value can increase or decrease
# TYPE current_temperature_outside gauge
current_temperature_outside{location="za_ct"} 27.97

Now to configure our prometheus scrape config to scrape our endpoint:

1
2
3
4
5
6
7
8
9
10
$ cat /etc/prometheus/prometheus.yml
...
scrape_configs:
  - job_name: 'temperature-exporter'
    scrape_interval: 15s
    static_configs:
    - targets: ['192.168.0.5:5000']
      labels:
        instance: 'pi-zero'
        room: 'study'

Then restart prometheus and head over to Grafana.

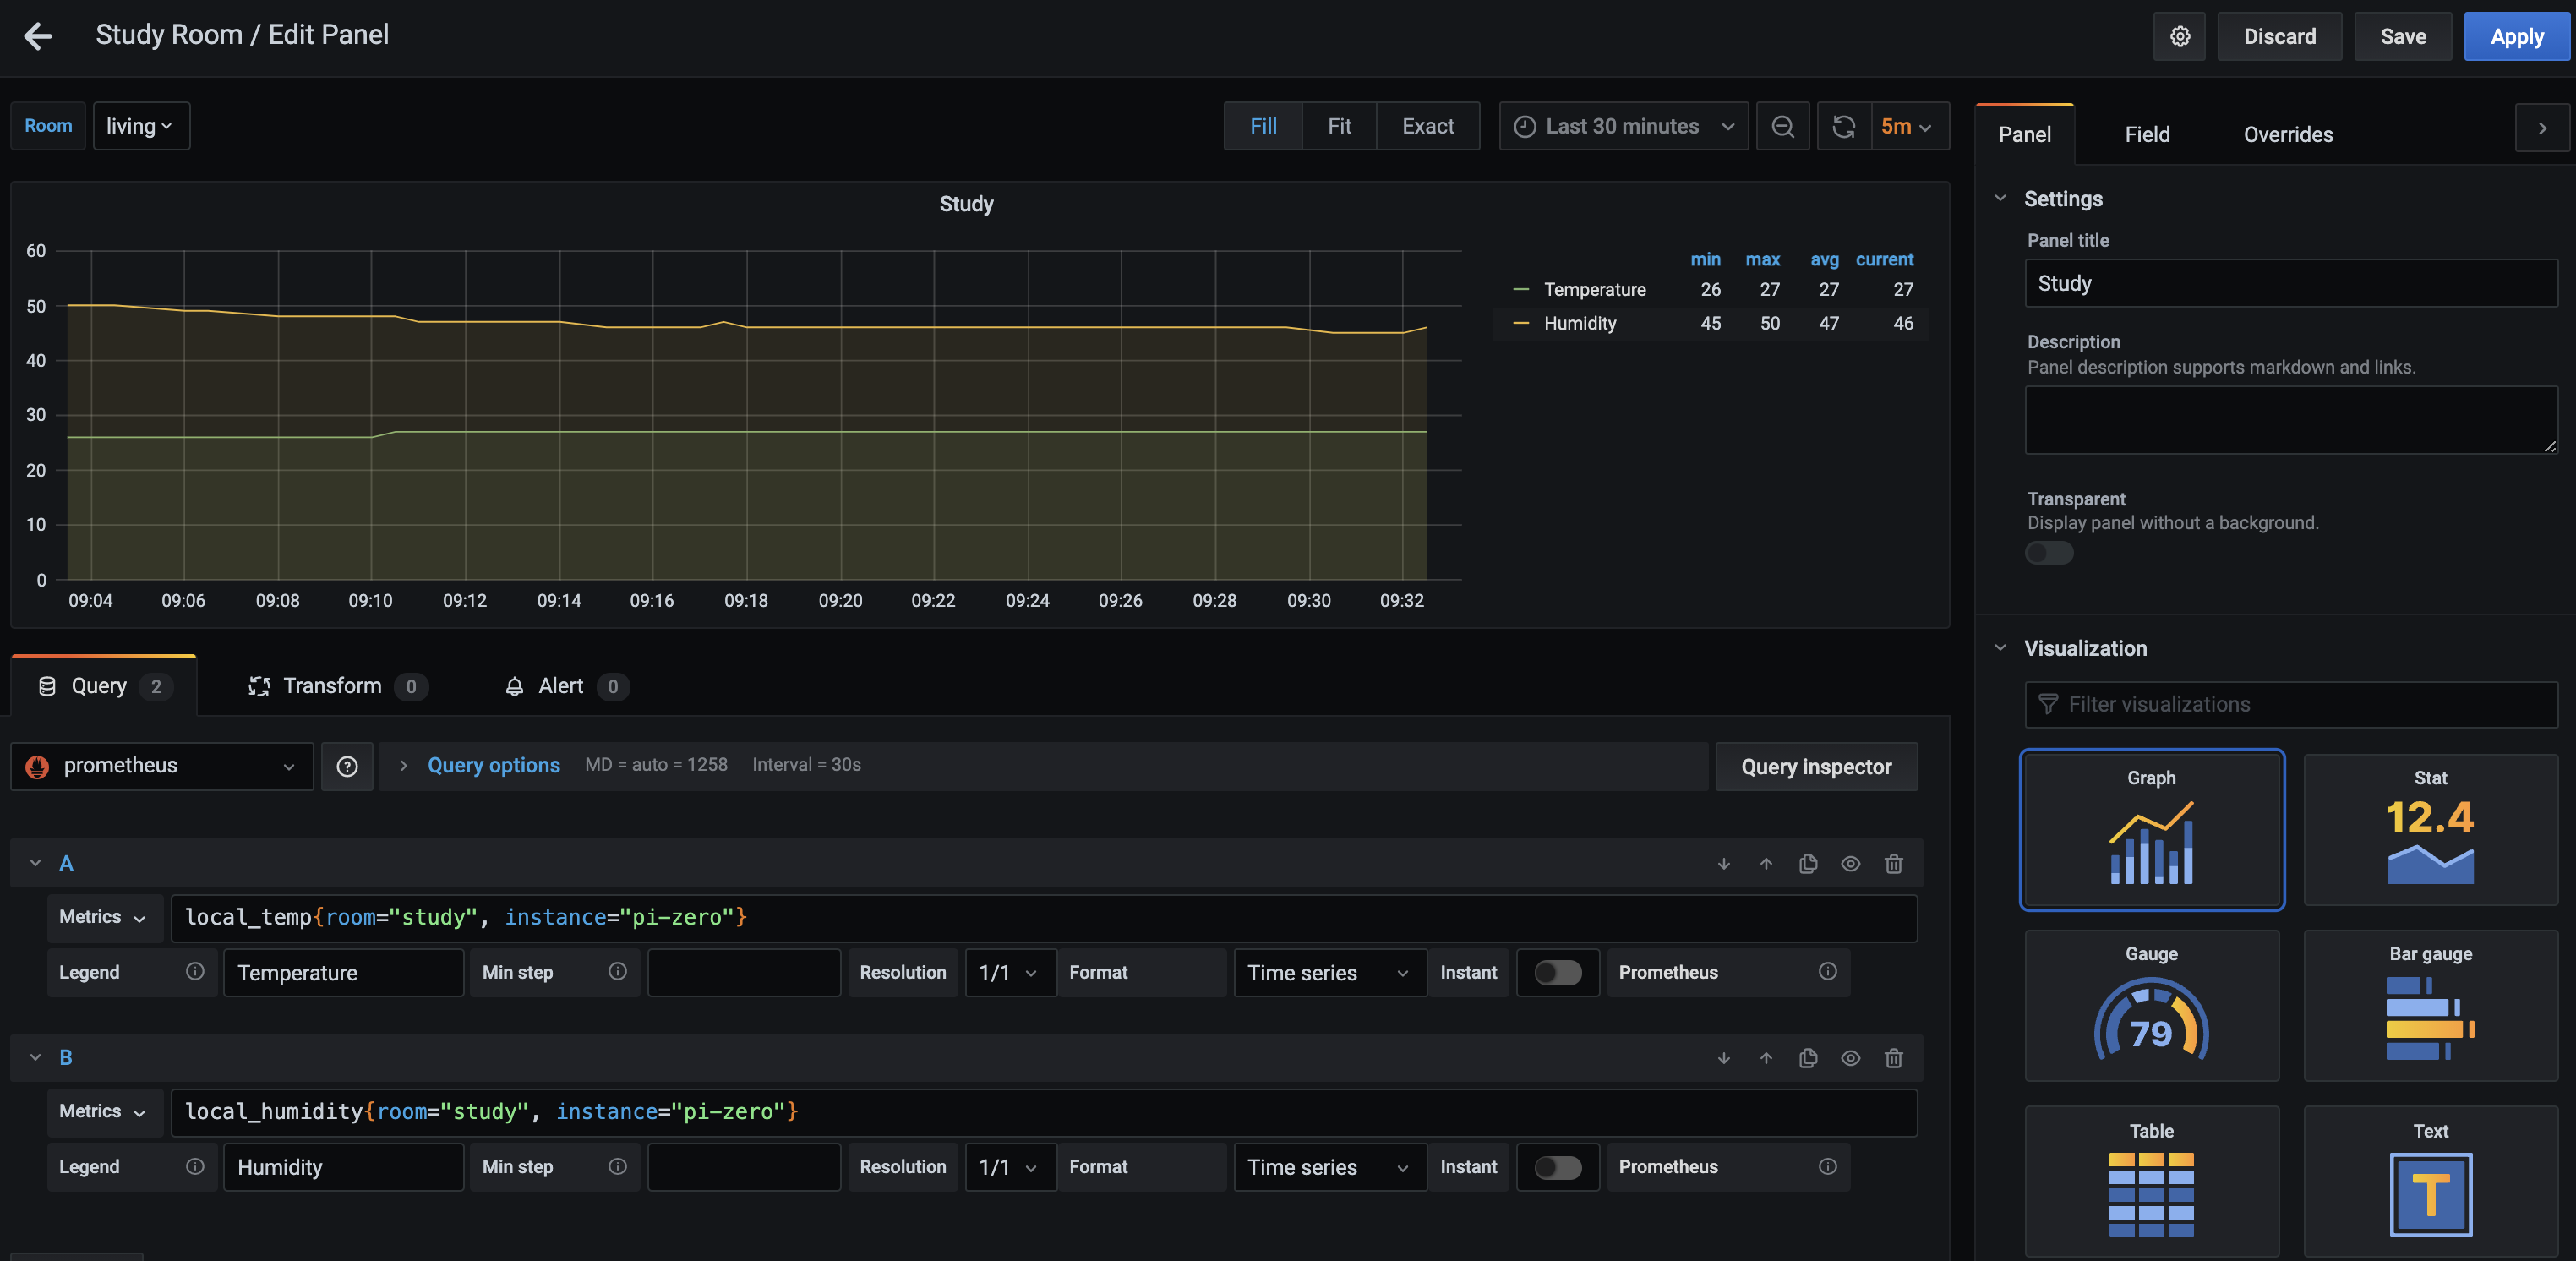
We will be adding a new panel with a graph visualization, and from our prometheus datasource, we will be referencing the 2 metrics (different from the screenshot):

1
2
3
current_humidity{room="study"} 47.0
current_temperature{room="study"} 25.7
current_temperature_outside{location="za_ct"} 27.97

As can be seen below:

image

After a bit of customization, you can get something more or less like this:

image

Thank You

Thanks for reading, if you like my content feel free to visit my website ruan.dev or follow me on Twitter @ruanbekker

CICD With DroneCI and Gitea Using Docker Compose

In this post we wil set up a drone-ci and gitea stack using docker-compose and then running a test pipeline.

I have posted a few times about this topic, but this post will be used when I create other examples and wanting to use this post for the ones not having the stack booted yet.

The Source Code

All the code will be in my github repository.

For our docker-compose.yml:

1
2
3
4
5
6
7
8
9
10
11
12
13
14
15
16
17
18
19
20
21
22
23
24
25
26
27
28
29
30
31
32
33
34
35
36
37
38
39
40
41
42
43
44
45
46
47
48
49
50
51
52
53
54
55
56
57
58
59
60
61
62
63
64
65
66
67
68
69
70
71
72
73
74
75
76
77
78
79
80
81
82
83
version: '3.6'

services:
  gitea:
    container_name: gitea
    image: gitea/gitea:${GITEA_VERSION:-1.10.6}
    restart: unless-stopped
    environment:
      # https://docs.gitea.io/en-us/install-with-docker/#environments-variables
      - APP_NAME="Gitea"
      - USER_UID=1000
      - USER_GID=1000
      - RUN_MODE=prod
      - DOMAIN=${IP_ADDRESS}
      - SSH_DOMAIN=${IP_ADDRESS}
      - HTTP_PORT=3000
      - ROOT_URL=http://${IP_ADDRESS}:3000
      - SSH_PORT=222
      - SSH_LISTEN_PORT=22
      - DB_TYPE=sqlite3
    ports:
      - "3000:3000"
      - "222:22"
    networks:
      - cicd_net
    volumes:
      - ./gitea:/data

  drone:
    container_name: drone
    image: drone/drone:${DRONE_VERSION:-1.6.4}
    restart: unless-stopped
    depends_on:
      - gitea
    environment:
      # https://docs.drone.io/server/provider/gitea/
      - DRONE_DATABASE_DRIVER=sqlite3
      - DRONE_DATABASE_DATASOURCE=/data/database.sqlite
      - DRONE_GITEA_SERVER=http://${IP_ADDRESS}:3000/
      - DRONE_GIT_ALWAYS_AUTH=false
      - DRONE_RPC_SECRET=${DRONE_RPC_SECRET}
      - DRONE_SERVER_PROTO=http
      - DRONE_SERVER_HOST=${IP_ADDRESS}:3001
      - DRONE_TLS_AUTOCERT=false
      - DRONE_USER_CREATE=${DRONE_USER_CREATE}
      - DRONE_GITEA_CLIENT_ID=${DRONE_GITEA_CLIENT_ID}
      - DRONE_GITEA_CLIENT_SECRET=${DRONE_GITEA_CLIENT_SECRET}
    ports:
      - "3001:80"
      - "9001:9000"
    networks:
      - cicd_net
    volumes:
      - /var/run/docker.sock:/var/run/docker.sock
      - ./drone:/data

  drone-runner:
    container_name: drone-runner
    image: drone/drone-runner-docker:${DRONE_RUNNER_VERSION:-1}
    restart: unless-stopped
    depends_on:
      - drone
    environment:
      # https://docs.drone.io/runner/docker/installation/linux/
      # https://docs.drone.io/server/metrics/
      - DRONE_RPC_PROTO=http
      - DRONE_RPC_HOST=drone
      - DRONE_RPC_SECRET=${DRONE_RPC_SECRET}
      - DRONE_RUNNER_NAME="${HOSTNAME}-runner"
      - DRONE_RUNNER_CAPACITY=2
      - DRONE_RUNNER_NETWORKS=cicd_net
      - DRONE_DEBUG=false
      - DRONE_TRACE=false
    ports:
      - "3002:3000"
    networks:
      - cicd_net
    volumes:
      - /var/run/docker.sock:/var/run/docker.sock

networks:
  cicd_net:
    name: cicd_net

Our boot.sh which we will use to override environment variables:

1
2
3
4
5
6
7
8
9
10
11
12
13
14
15
16
17
18
19
#!/usr/bin/env bash

export HOSTNAME=$(hostname)
export DRONE_VERSION=1.10.1
export DRONE_RUNNER_VERSION=1.6.3
export GITEA_VERSION=1.13
export IP_ADDRESS=192.168.0.6
export MINIO_ACCESS_KEY="EXAMPLEKEY"
export MINIO_SECRET_KEY="EXAMPLESECRET"
export GITEA_ADMIN_USER="example"
export DRONE_RPC_SECRET="$(echo ${HOSTNAME} | openssl dgst -md5 -hex)"
export DRONE_USER_CREATE="username:${GITEA_ADMIN_USER},machine:false,admin:true,token:${DRONE_RPC_SECRET}"
export DRONE_GITEA_CLIENT_ID=""
export DRONE_GITEA_CLIENT_SECRET=""
docker-compose up -d

echo ""
echo "Gitea: http://${IP_ADDRESS}:3000/"
echo "Drone: http://${IP_ADDRESS}:3001/"

Deploy the Stack

Set the following in your boot.sh:

1
2
IP_ADDRESS=192.168.0.6       -> either reachable dns or ip address which will be your clone address and ui addresses.
GITEA_ADMIN_USER="giteauser" -> will be the user you register with in drone

Now boot the stack:

1
$ bash boot.sh

Note: Theres a current issue where webhooks get fired twice, if you see that just restart gitea with docker restart gitea.

  • Head over to: http://${IP_ADDRESS}:3000/user/settings/applications and create a new OAuth2 Application and set the Redirect URI to http://${IP_ADDRESS}:3001/login

  • Capture the client id and client secret and populate them in the boot.sh in DRONE_GITEA_CLIENT_ID and DRONE_GITEA_CLIENT_SECRET and run bash boot.sh again. This will give drone the correct credentials in order to authenticate with gitea.

  • Now when you head over to http://${IP_ADDRESS}:3001/ you will be asked to authorize the application and you should be able to access drone.

Drone CLI

Install Drone CLI: - https://docs.drone.io/cli/install/

1
2
3
$ curl -L https://github.com/drone/drone-cli/releases/latest/download/drone_darwin_amd64.tar.gz | tar zx
$ sudo mv drone /usr/local/bin/drone
$ chmod +x /usr/local/bin/drone

Get your Drone Token: - http://${IP_ADDRESS}:3001/account

1
2
3
$ export DRONE_SERVER=http://${IP_ADDRESS}:3001
$ export DRONE_TOKEN=one-from-the-account-page
drone info

Build your first pipeline

Create a test repo in gitea:

image

Commit a .drone.yml file for drone:

1
2
3
4
5
6
7
8
9
10
11
12
13
14
15
kind: pipeline
type: docker
name: hello-world

trigger:
  branch:
    - master
  event:
    - push

steps:
  - name: say-hello
    image: busybox
    commands:
      - echo hello-world

Head over to drone and sync your repositories:

image

Activate your repository:

image

Push a commit to master and see your pipeline running:

image

More Examples

For more examples view my example section on the github repository: - https://github.com/ruanbekker/drone-gitea-on-docker#more-examples

Ship Your Docker Logs to Loki Using Fluentbit

In this tutorial, I will show you how to ship your docker containers logs to Grafana Loki via Fluent Bit.

Grafana and Loki

First we need to get Grafana and Loki up and running and we will be using docker and docker-compose to do that.

Our docker-compose-loki.yml:

1
2
3
4
5
6
7
8
9
10
11
12
13
14
15
16
17
18
19
20
21
22
23
24
25
26
27
28
29
30
31
32
33
34
35
36
37
38
39
40
41
42
version: "3.7"

services:
  grafana:
    image: grafana/grafana:7.4.2
    container_name: 'grafana'
    restart: unless-stopped
    volumes:
      - ./data/grafana/data:/var/lib/grafana
      - ./configs/grafana/datasource.yml:/etc/grafana/provisioning/datasources/datasource.yml
    networks:
      - public
    ports:
      - 3000:3000
    depends_on:
      - loki
    logging:
      driver: "json-file"
      options:
        max-size: "1m"  
  
  loki:
    image: grafana/loki:2.1.0
    container_name: loki
    command: -config.file=/mnt/loki-local-config.yaml
    user: root
    restart: unless-stopped
    volumes:
      - ./data/loki/data:/tmp/loki
      - ./configs/loki/loki.yml:/mnt/loki-local-config.yaml
    ports:
      - 3100:3100
    networks:
      - public
    logging:
      driver: "json-file"
      options:
        max-size: "1m"

networks:
  public:
    name: public

We are referencing 2 config files, first our loki datasource defined by ./configs/grafana/datasource.yml:

1
2
3
4
5
6
7
8
9
10
11
12
apiVersion: 1

datasources:
- name: loki
  type: loki
  access: proxy
  orgId: 1
  url: http://loki:3100
  basicAuth: false
  isDefault: true
  version: 1
  editable: true

And our second config is our loki config ./configs/loki/loki.yml:

1
2
3
4
5
6
7
8
9
10
11
12
13
14
15
16
17
18
19
20
21
22
23
24
25
26
27
28
29
30
31
32
33
34
35
36
37
38
39
40
41
42
43
44
45
auth_enabled: false

server:
  http_listen_port: 3100

ingester:
  lifecycler:
    address: 127.0.0.1
    ring:
      kvstore:
        store: inmemory
      replication_factor: 1
    final_sleep: 0s
  chunk_idle_period: 5m
  chunk_retain_period: 30s
  max_transfer_retries: 0

schema_config:
  configs:
    - from: 2018-04-15
      store: boltdb
      object_store: filesystem
      schema: v11
      index:
        prefix: index_
        period: 168h

storage_config:
  boltdb:
    directory: /tmp/loki/index

  filesystem:
    directory: /tmp/loki/chunks

limits_config:
  enforce_metric_name: false
  reject_old_samples: true
  reject_old_samples_max_age: 168h

chunk_store_config:
  max_look_back_period: 0s

table_manager:
  retention_deletes_enabled: false
  retention_period: 0s

Once you have everything in place, boot the grafana and loki containers:

1
$ docker-compose -f docker-compose-loki.yml up -d

Fluent Bit

Next we need to boot our log processor and forwarder, fluent bit. In our docker-compose-fluentbit.yml:

1
2
3
4
5
6
7
8
9
10
11
12
13
14
15
16
17
18
19
version: "3.7"

services:
  fluent-bit:
    image: grafana/fluent-bit-plugin-loki:latest
    container_name: fluent-bit
    environment:
      - LOKI_URL=http://loki:3100/loki/api/v1/push
    volumes:
      - ./fluent-bit.conf:/fluent-bit/etc/fluent-bit.conf
    ports:
      - "24224:24224"
      - "24224:24224/udp"
    networks:
      - public

networks:
  public:
    name: public

And as you can see we are referencing a config ./configs/fluentbit/fluent-bit.conf:

1
2
3
4
5
6
7
8
9
10
11
12
13
14
15
[INPUT]
    Name        forward
    Listen      0.0.0.0
    Port        24224
[Output]
    Name grafana-loki
    Match *
    Url ${LOKI_URL}
    RemoveKeys source,container_id
    Labels {job="fluent-bit"}
    LabelKeys container_name
    BatchWait 1s
    BatchSize 1001024
    LineFormat json
    LogLevel info

Once you have your configs in place, boot fluent-bit:

1
$ docker-compose -f docker-compose-fluentbit.yml up -d

Nginx App

Now to configure our docker container to ship its logs to fluent-bit, which will forward the logs to Loki.

In our docker-compose-app.yml:

1
2
3
4
5
6
7
8
9
10
11
12
version: "3"

services:
  nginx-json:
    image: ruanbekker/nginx-demo:json
    container_name: nginx-app
    ports:
      - 8080:80
    logging:
      driver: fluentd
      options:
        fluentd-address: 127.0.0.1:24224

The fluent-bit container listens on port 24224 locally on our docker host and is not reachable via its container network, so let’s boot our application:

1
$ docker-compose -f docker-compose-app.yml up -d

Once our application is up, let’s make a request to our nginx-app:

1
2
$ curl http://localhost:8080/
ok

Now head over to Grafana at http://localhost:3000/explore and query: {job="fluent-bit", container_name="/nginx-app"} and you should see something like this:

image

Beautiful right? I know.

Github Repo

The source code for this can be found on:

Installing Arduino and Setup the NodeMCU ESP32

A couple of weeks ago I got myself the NodeMCU ESP32 Development Board:

image

If you want to view more in-depth specs about the board you can have a look at the ESP32 Datasheet, but in short it has:

  • ESP32-D0WDQ6 Processor
  • WiFi with frequency range of 2.4G ~ 2.5G (2400M ~ 2483.5M)
  • Bluetooth 4.2
  • 32Mbit built in Flash
  • 2x19pin extension headers, breakout all the I/O pins of the module
  • 2x keys, used as reset or user-defined

About this Tutorial

In this tutorial we will download and install Arduino and how to setup our ESP32 Board, then just running a basic hello world application

Installing Arduino

Head over to arduino.cc/en/software and download arduino for your operating system.

Once installed you can reference arduino-esp32 for your operating system, but in general you will open the Arduino application, select Preferences and provide the following link on the “Additional Boards Manager URL”:

1
https://raw.githubusercontent.com/espressif/arduino-esp32/gh-pages/package_esp32_index.json

Hit OK, then select Tools, Board, Board Manager, then search for “esp32”, then install esp32 by Espressif Systems:

image

Then make sure to select the board by navigating to Tools, Board, ESP32 Arduino, ESP32 Dev Module:

image

Select the upload rate from Tools, Upload Rate to 115200 and select the serial port, from mine it is Tools, Port, usb-serial-0001 (your’s might differ)

Hello World Application

Now that we have Arduino installed and our board configured, let’s write a hello world application, from the input text section:

1
2
3
4
5
6
7
8
9
10
void setup() {
  Serial.begin(115200);
  Serial.println("Setup done");
  delay(5000);
}

void loop() {
  Serial.println("Hello, World");
  delay(1000);
}

From the setup function we set the baud rate and print a line then sleep for 5 seconds, once that is done we call the loop function which will print “Hello, World” and sleep for 1 second, and that will loop indefinitely.

Once you are done, save your sketch and upload it to the board by either selecting the upload button or from Sketch, Upload.

When the code has been compiled the device will reset and you can open the serial monitor, by selecting Tools, Serial Monitor:

image

Thank You

Thank you for reading.

Reduce Docker Log Size on Disk

In cases where you are using the defaults for logging and your application logs a lot you can consume a lot of disk space and you can run out of disk space quite quickly.

If it’s a case where you already ran out of disk space, we can investigate the disk space consumed by docker logs:

1
2
3
4
$ cd /var/lib/docker/containers
$ du -sh *
6.0G  14052251a0f13f46f65bc73d10c01408130ee8ae71529600ba5bd6bee76af4ee
1.2G  e6b40b1d30c5cf05e8cb201ca9abf6bd283d7cf7ceaa3be2a0422be7cd750a33

Referenced from https://blog.birkhoff.me/devops-truncate-docker-container-logs-periodically-to-free-up-server-disk-space/ you can truncate those files:

1
$ sh -c 'truncate -s 0 /var/lib/docker/containers/*/*-json.log'

Check the size again:

1
2
3
$ du -sh *
40K   14052251a0f13f46f65bc73d10c01408130ee8ae71529600ba5bd6bee76af4ee
36K   e6b40b1d30c5cf05e8cb201ca9abf6bd283d7cf7ceaa3be2a0422be7cd750a33

To overcome this issue you can use this in logging options in your compose:

1
2
3
4
5
6
...
    logging:
      driver: "json-file"
      options:
        max-size: "1m"
...